<<
5-Waters Volume 2 - Water Supplies
3 Castle Hill Water Supply
3.1 Scheme Summary
Estimated Population Served
| 406
|
Scheme Coverage (1 Jan 2021)
| Full Charges | 131
|
| Half Charges | 0
|
| >1 Charges | 0
|
System Components
| Bores/Intakes (No.) | 1 River Gallery
|
Treatment/Disinfection
| 1
|
| Reservoirs (No.) | 3
|
| Pump Stations (No.) | 1
|
| Piped (m) | 8,820
|
| History | Original scheme installation date | 1982
|
Value ($)
| Replacement Cost | $2,696,878
|
| Depreciated Replacement Cost | $1,233,115
|
| Financial | Operator cost (scheduled and reactive maintenance) per connection | $291.05/connection
|
Demand (m3) (1 Jan – 31 Dec 2020)
| Average daily (m3/day) | 140
|
| Peak daily (m3/day) | 739 |
| Minimum daily (m3/day) | - |
| Average daily per connection (m3/day) | 0.5 |
|
Type of Supply |
|
Unrestricted
|
Target Pressure & Flow at boundary
|
Pressure |
>310 kPa |
|
Flow |
>20 L/min |
|
Sustainability |
Well Security |
Unsecure |
3.2 Key Issues
The following key issues are associated with the Castle Hill water supply. A list of district wide issues are located in 5Waters Activity Management Plan: Volume 1.
Table 3‑1 Castle Hill Scheme Issues
| Castle Hills isolated location and distance from the maintenance contractors base keeps the operational and maintenance costs high. The rating base is small and there are also limited skills available within Castle Hill. | Council will investigate the potential for remote monitoring in conjunction with identifying and training and local operators to perform basic operation and maintenance tasks, including consideration of health, safety and employment regulations. Council also plans to investigate optimisation of maintenance and renewals to ensure costs stay at a minimum. |
| The water treatment plant requires upgrading to comply with the Health Act and DWSNZ. However, this may prove difficult for an unprotected source catchment with variable water quality. | Council will identify options. Through the Water Safety Plans, process barriers will be installed to manage potential risks.
|
Catchment management
| Council are investigating water quality within the water supply protection zones, and working with ECan on this matter
|
Pressure zoning
| Council are considering pressure zoning and additional pressure monitoring in the reticulation network. We are developing a Target Pressure Plan and Network Management Strategy.
|
3.3 Overview & History
The Castle Hill Water Supply was commissioned during 1982 servicing the township, which was developed to utilise the high country tourist attractions within the area i.e. skiing and tramping.
The scheme draws water from an infiltration gallery established in the base of Thomas Stream, an unprotected, but undeveloped catchment. Water is treated and has turbidity control and chlorination but does not fully comply with DWSNZ. This is a gravity fed supply and full fire fighting capacity is provided from 3 of 500 m3 timber tanks.
There are few permanent residents in the village which has been developed in stages since the early 1980s. Most properties are used as seasonal holiday homes with a number available for holiday rental. There are currently no business activities in the village. Further development is planned, with a hospitality facility. The water headworks will provide sufficient capacity, in line with the 1982 design.
The remote location and harsh alpine environment present challenges for operation and maintenance of a water supply. The village can be isolated following heavy snowfall and storm events that periodically close State Highway 73.
The community is located within the alpine fault line, and is expected to incur significant damage to its water infrastructure resulting from a 76MMI event.
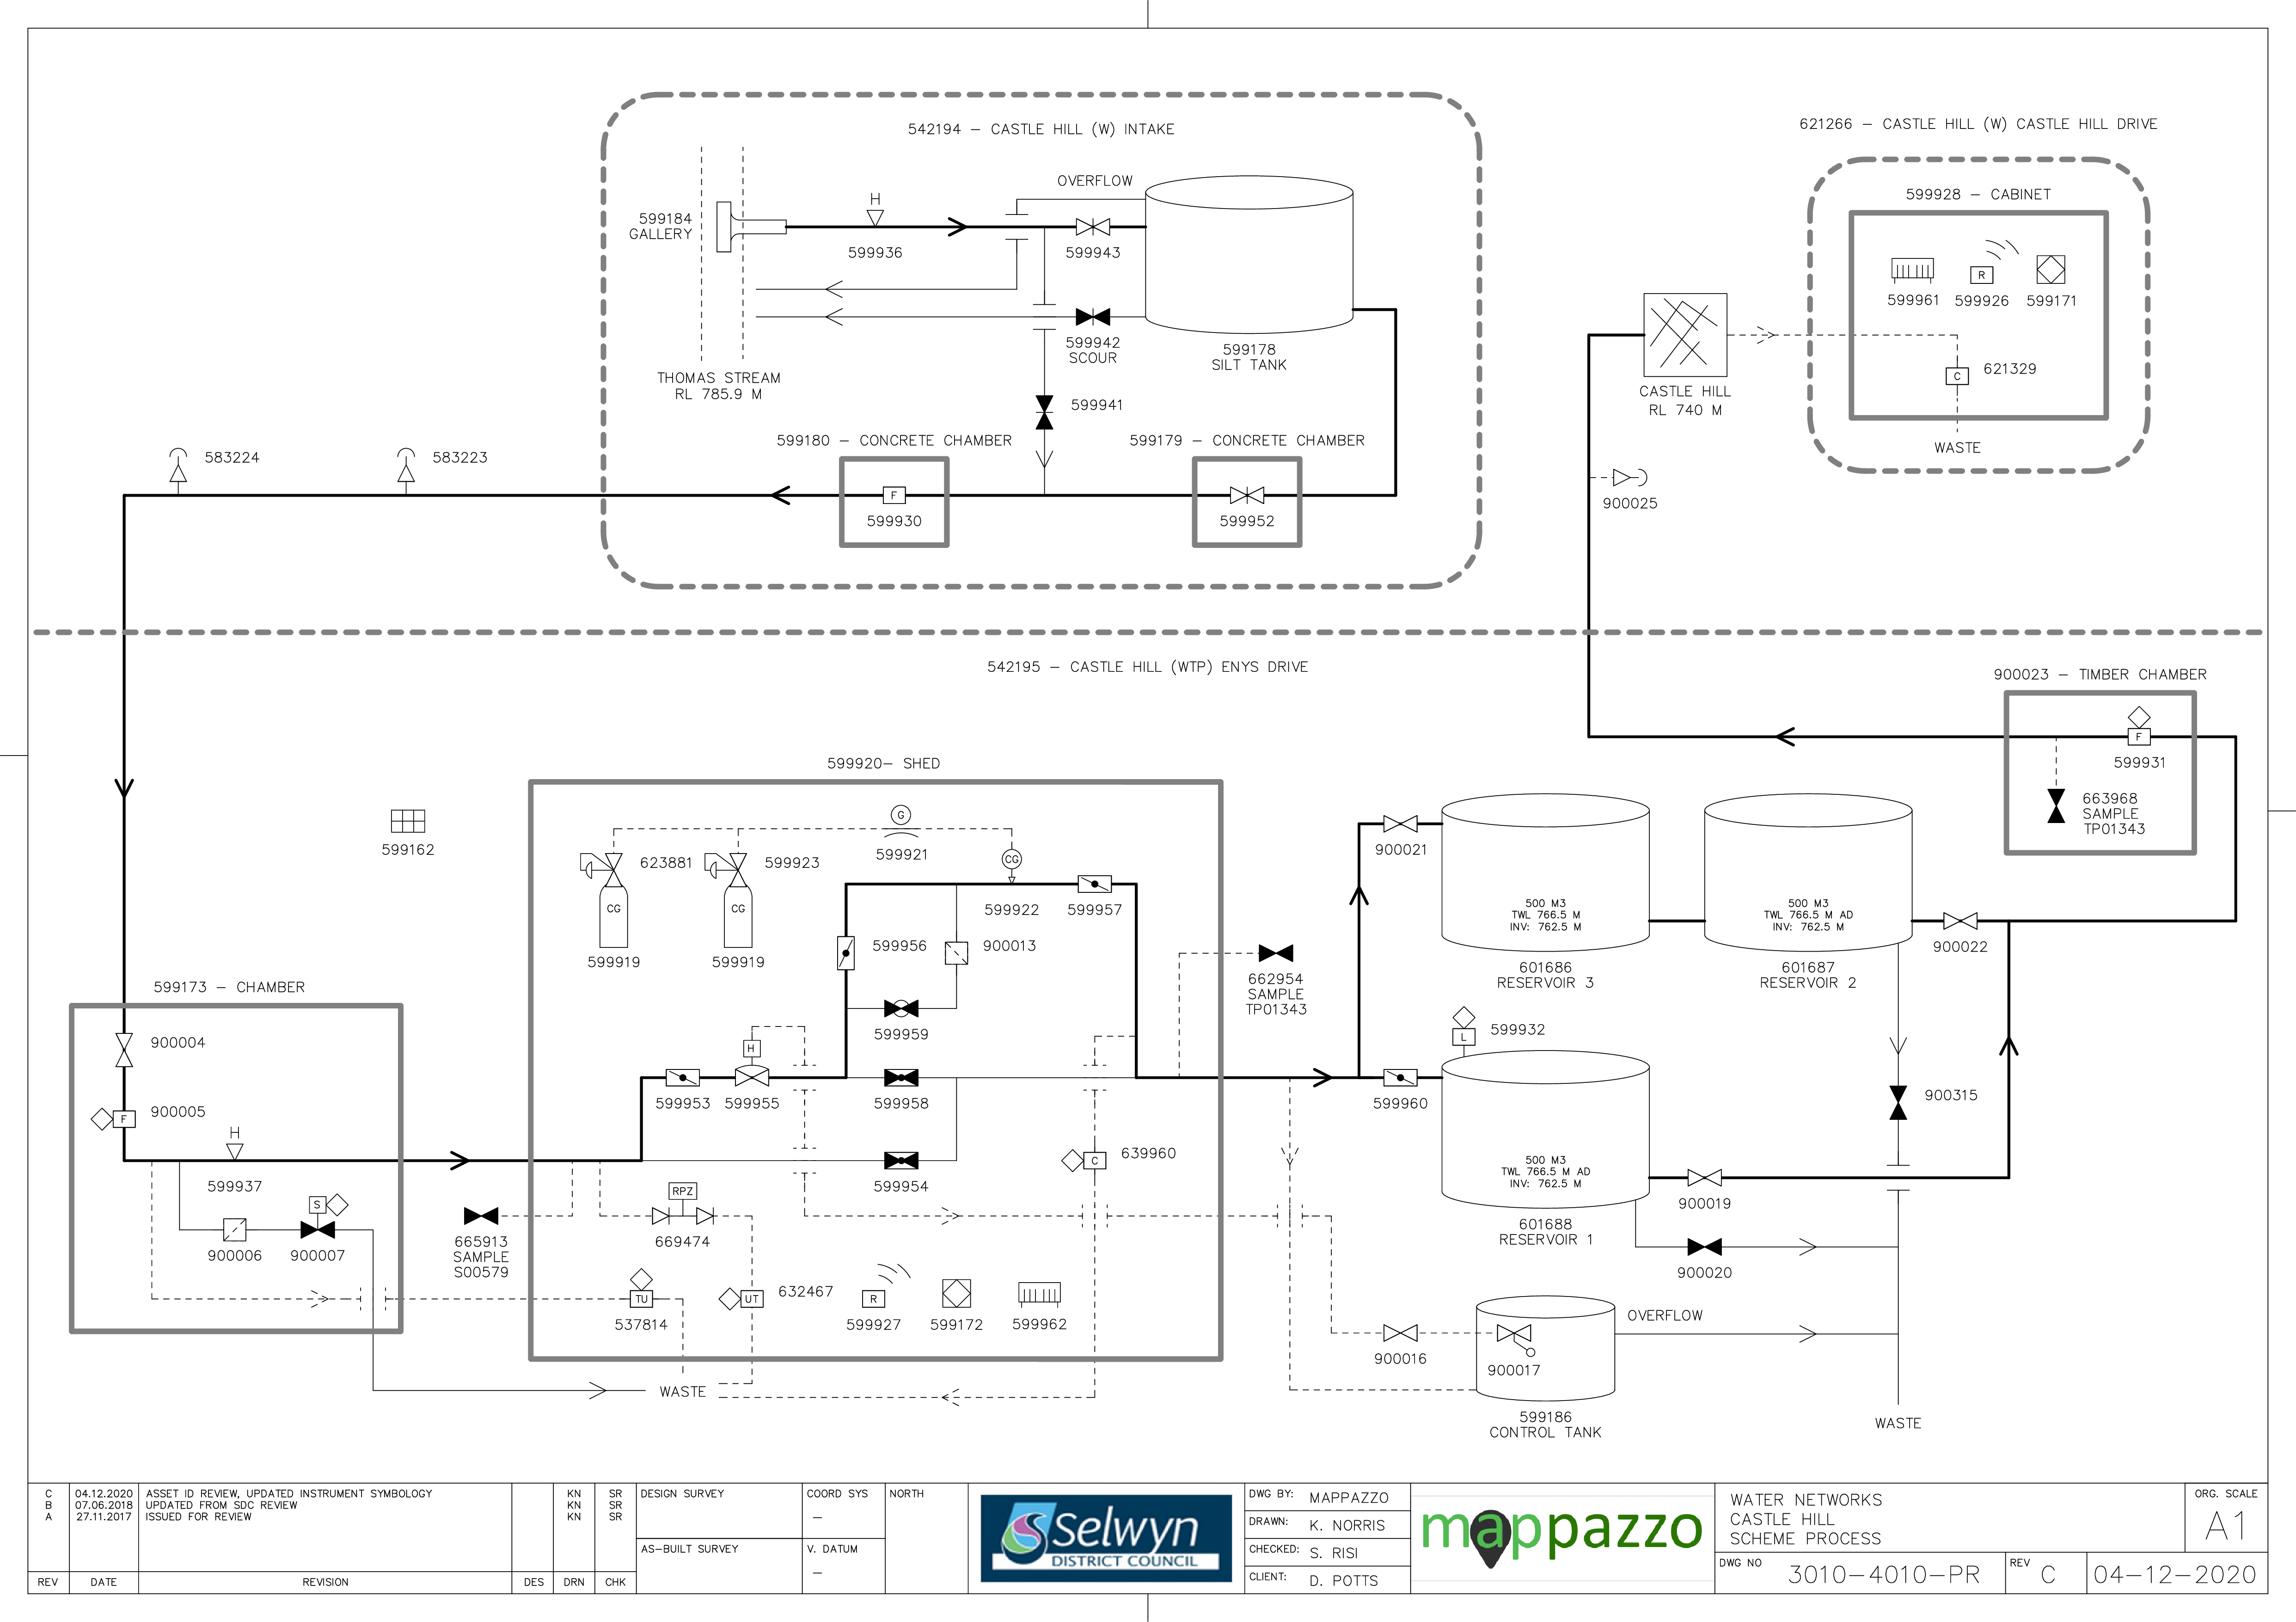
Figure 3‑2 Scheme Schematic
3.4 System Capacity
Castle Hill Village has not developed to the extent anticipated when the water supply was constructed in the early 1980s. About 126 houses have been built. Most are holiday homes used predominantly over the winter period (ski season) with a few occupied by permanent residents. There is no business activity. Small subdivisions and land sales continue but this can easily be accommodated by the current headworks infrastructure. Figure 3-3 shows the projected water demand, based on housing projections.
The supply includes three large reservoirs providing a total of around 1500 m3 of treated water storage capacity, about five times peak day demand. The large storage volume permits selective abstraction of water from Thomas Stream, i.e. when water quality is poor the intake is shut down. The 200mm diameter supply main from the reservoir offers plenty of capacity for current and foreseeable needs.
Hydraulic models have been used to plan future water infrastructure for Castle Hill, as part of a master planning exercise. The master planning provides an assessment of the sizing and timing of new infrastructure for new water sources and pipelines to service growth. Part of the master planning requires a water balance to be developed to forecast growth, using historical peak demand per household. The water balance forecasts the peak instantaneous flow per year versus the water resources available to determine the staging of new water sources. The master planning exercise has identified that a new water source or consent amendment will be required in 2022/23, to service growth in Castle Hill (Table 3-3).
Table 3‑2 Capacity Summary
| Consented Take | 13.8
| 1192 | 178,800 * | - |
| Peak Demand | 9.2 ** | 580 ** | ~60,800 | - |
* inferred value, ** 10 Jan 2015
Table 3-3 Future Sources
Additional source/consent amendment/ Treated water capacity upgrade
| 2022/23
| 14
|
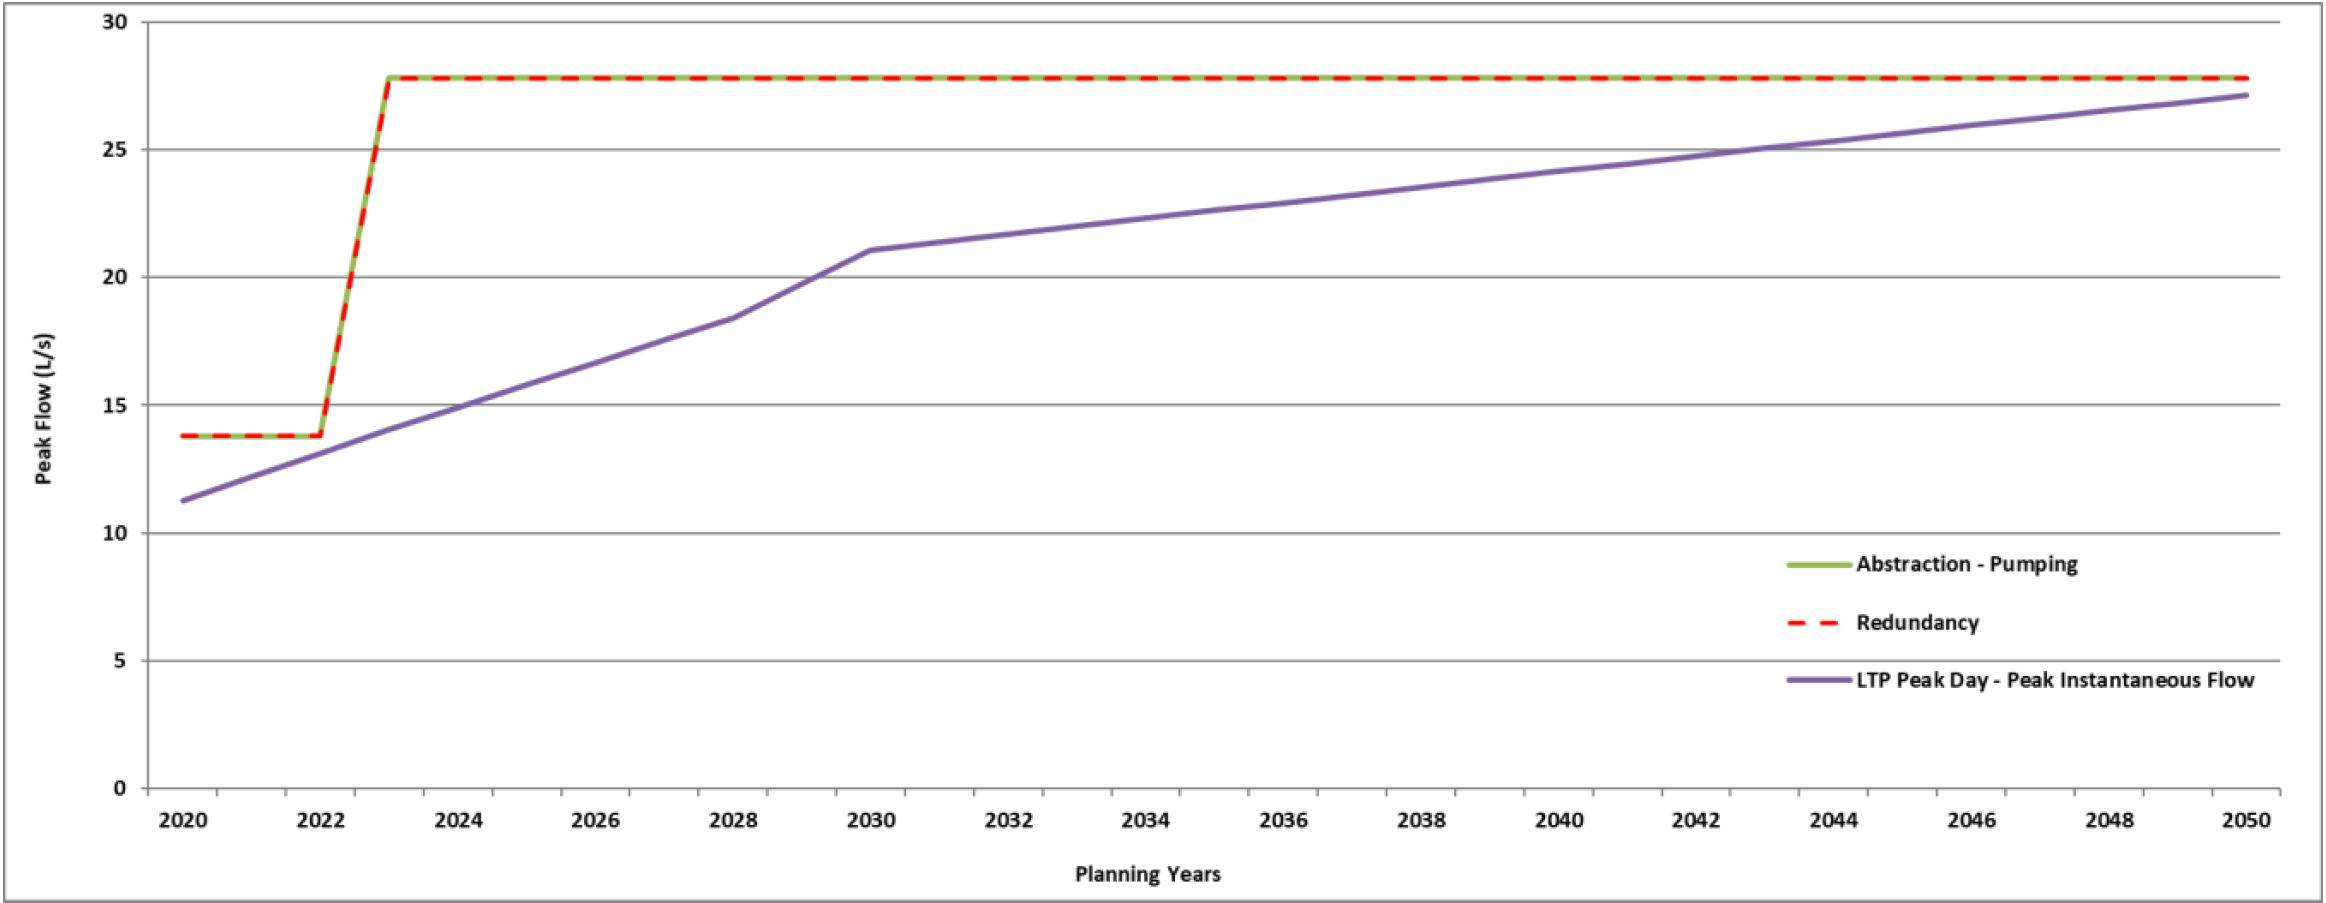
Figure 3‑3 Castle Hill Water Demand
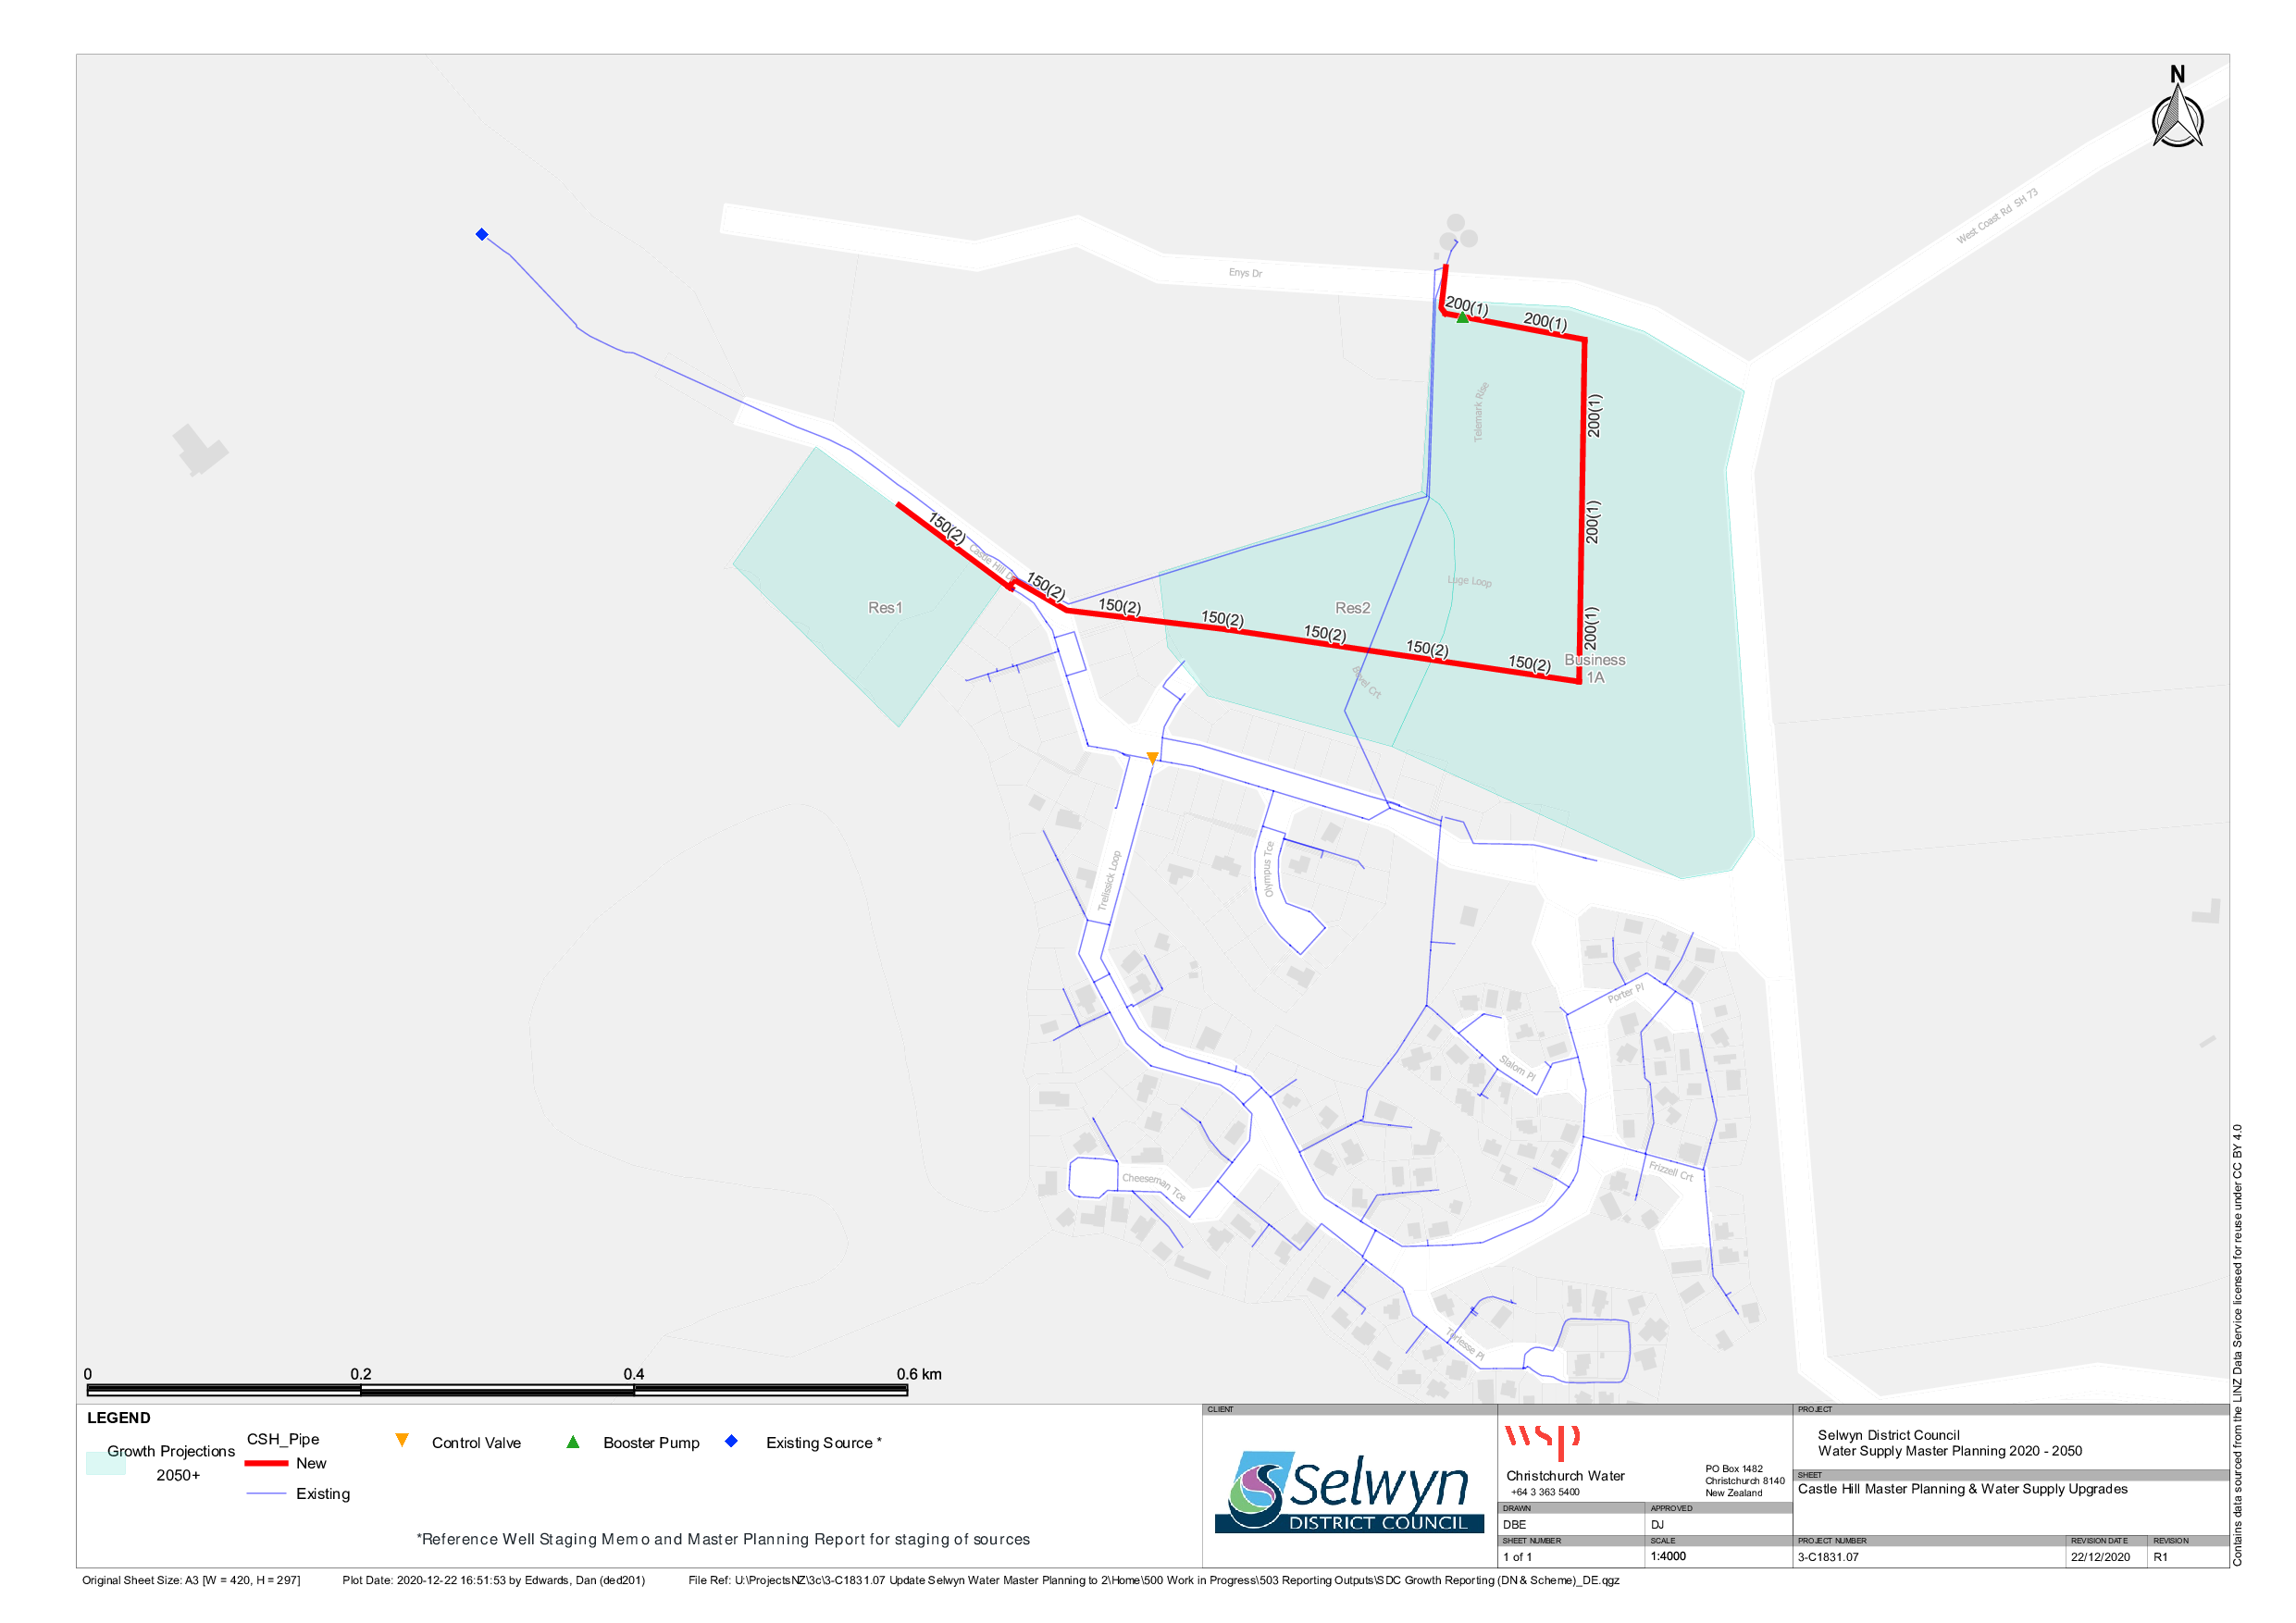
Figure 3-4 Castle Hill Master Plan
3.5 Resource Consents
The Castle Hill water supply has a number of resource consents. Table 3‑4 shows the water take permitted by the resource consents for this scheme.
Table 3‑4 Resource Consents
CRC991053
| To take surface water, at or about map reference NZMS 260 K34:040-773, for community water supply. | Castle Hill Village, CASTLE HILL | 24-Dec-98
| 23-Dec-33
| 13.8 | 1192 |
3.6 Water Quality
The Castle Hill water supply is a non-secure source where the source and treatment plant is sampled weekly and reticulation is sampled monthly.
The following details E. coli transgressions for the sample periods 2012 to 2020.
Source
There have been 110 samples with E. coli identified during the period 2013 - 2020, highlighting the importance of water treatment for this scheme.
Figure 3‑5 E. coli identified in source water
Treatment
There have been four E. coli treatment transgressions within this period, they all occurred in July 2012.
Zone
There have been three E. coli transgression during this period, they all occurred in July 2012.
Chemical Analysis
The following is a summary of the raw water chemical analysis carried out at the Castle Hill Water Supply.
Table 3‑5 Castle Hill Water Supply Raw Water Chemical Analysis Summary
Total Lead (g/m3)
| 0.01 (Maximum Acceptable Value)
| 0.00022 | 0.00023 | 0.00014 | 0.00031
| 0.00013
| 0.000232
| <0.00011
| ✓ |
pH (pH units)
| 7-8.5 (Guideline Value)
| 7.5
| 7
| 7.1 | 7.4
| 7.4
| 7.3
| 7.6 | ✓
|
| Total Hardness (g/m3 as CaCO3) | <200 (Guideline Value)
| 21 | 19.6
| 19.9
| 21
| 22.3
| 21.03
| 23.17
| ✓ |
Total Calcium (g/m3)
| n/v | 7
| 6.6
| 6.9 | 7.3
| 7.67
| 7.27
| 7.89
| ✓
|
Total Iron (g/m3)
| <0.2 (Guideline Value)
| <0.02
| 0.051
| 0.025
| 0.023
| < 0.021 | <0.021
| <0.021 | ✓ |
Total Sodium (g/m3)
| <200 (Guideline Value)
| 2.5
| 2.5
| 2.4 | 2.6 | 2.55
| 2.26 | 2.61 | ✓ |
Nitrate - Nitrogen (g/m3)
| 11.3 (Maximum Acceptable Value)
| 0.05 | 0.09
| 0.07
| 0.08 | < 0.05 | 0.057
| 0.052 | ✓
|
3.7 Scheme Assets
A summary of material and diameter for pipes in Castle Hill is shown below by Figure 3‑6 and Figure 3‑7.
Figure 3‑6 Pipe Material – Castle Hill
Figure 3‑7 Pipe Diameter – Castle Hill
3.8 Operational Management
The water supply is operated and maintained under two maintenance contracts as follows:
- Contract 1241: Water Services Contract. Contract is with SICON who undertakes investigations, conditions inspections, proactive and reactive maintenance and minor asset renewals; and
- Contract 1202: Parks and Reserves Contract. Contract is with SICON who undertakes the maintenance of land scape features related to water services e.g. mowing, gardens etc.
Water quality sampling is completed under an agreement with Food and Health Ltd as required.
3.9 Photos of Main Assets
3.10 Risk Assessment
A risk assessment has been undertaken for the Castle Hill scheme. The key output from the risk assessment is the identification of any extreme and high risks which need to be mitigated. In order to mitigate these risks they have been included and budgeted for in the projects within this LTP. Table 3‑6 outlines the risk priority rating, Table 3‑7 outlines the risks and the list of key projects is found in Table 3‑11.
Table 3‑6 Risk Priority Rating
> 50
| Extreme | Awareness of the event to be reported to Council. Urgent action to eliminate / mitigate / manage the risk. Document risk and action in the AMP.
|
35-50
| Very High | Risk to be eliminated / mitigated / managed through normal business planning processes with responsibility assigned. |
| 14-35 | High | Manage risk using routine procedures. |
| 3.5-14 | Moderate | Monitor the risk. |
< 3.5
| Low
| Awareness of the event to be reported to Council. Immediate action required to eliminate / mitigate / manage the risk. Document risk and action in the AMP.
|
Table 3‑7 Risks – Castle Hill
| High water use due to leaks causes additional operation costs | Leak detection | 2014 | 27 | 27 | 12 |
| Insufficient monitoring of Cl2 results in treatment system over or inadequately chlorinating | Install chlorine analyser before reservoirs to check dose | 2014 | 12 | 2.1 | 2.1 |
| Manual operation of scheme is costly | Automate flushing to waste at reservoir site | 2014 | 4 | 2.1 | 2.1 |
No reservoir turnover and bottom filled
| Upgrade pipework so that water goes through all reservoirs (connect 2 res's to the other 1). Install additional pressure transducer. | 2014 | 12
| 12 | 6
|
| Poor tank maintenance leads to tank failure | Maintenance - re tighten covers/liners | 2014 | 6 | 6 | 2.1 |
| Electrical failure due to lightning or network spikes | Install surge diverters | 2014 | 6 | 2.1 | 2.1 |
| Failure to meet NES water meter standards | NES Water Meter Compliance | 2014 | 20 | 6 | 6 |
| Inability to collect income from non-metered properties | Install property water meters | 2014 | 27 | 27 | 2.1 |
| Non-consented activities | Renewal of consents | 2014 | 27 | 27 | 6 |
| Inadequate treatment under all conditions | Water quality upgrade | 2017 |
| 45 | 3.5 |
The list of district wide risks can be found in 5Waters Activity Management Plan: Volume 1.
3.11 Asset Valuation Details
The total replacement value of assets within the Castle Hill water scheme is $2,696,878 with further details in Table 3‑8 below.
Table 3‑8 Replacement Value, Castle Hill
Plant and Equipment
| $1,369,222
|
Water Reticulation
| Hydrant | $47,316
|
|
| Lateral | $69,980
|
| Pipe | $942,613
|
| Supply Point | $221,352
|
Valve
| $46,394
|
3.12 Renewals
The renewal profile has been taken from the 2019 5 Waters Valuation. A graph showing the renewals for this scheme are shown by Figure 3‑8 below. The majority of renewals occur in 2037/38.
Figure 3‑8 Castle Hill Water Renewal Profile
3.13 Critical Assets
The criticality model for Castle Hill has been updated for the 2021 AcMP. The methodology of the criticality model can be found in 5Waters Activity Management Plan: Volume 1 and it provides details of how the criticality has been calculated for the reticulation assets. Table 3‑9 and Figure 3‑9 below shows the calculated criticality for all of the assets within this scheme that have a recorded known length.
Table 3‑9 Length of Assets per Criticality Level
5
| Low
| 3,705
|
4
| Medium-Low | 1,787
|
3
| Medium | 1,711
|
2
| Medium-High | 1,860
|
1
| High | 169
|
3.14 Asset Condition
The asset condition model was run for Castle Hill in 2021. The methodology of the model can be found in 5Waters Activity Management Plan: Volume 1 which provides details of how the model has been calculated for the pipe reticulation assets. Figure 3‑10 below shows the level of asset condition for these assets within this scheme that have a recorded known condition.
Table 3‑10 provides a description of the condition rating used within the condition model.
Table 3‑10 Asset Condition Grading
| 1.0 | Excellent |
| 2.0 | Good |
| 3.0 | Moderate |
| 4.0 | Poor |
| 5.0+ | Fail |
The number of pipe faults is also measured through the asset management system. Figure 3‑11 shows the known historic pipe failures within this scheme.
3.15 Funding Program
The 10 year budgets are shown by Table 3‑11. Budgets are split into expenditure, renewals, projects and capital projects. Expenditure and renewals have been reported on a district-wide basis in
Volume 1. These can be found by following the links:
Renewal Strategy
Expenditure
All figures are ($) not adjusted for CPI “inflation". They are calculated on historical data, and population growth where relevant.
All figures are ($) not adjusted for CPI “inflation". They are calculated on historical data, and population growth where relevant.
Table 3‑11 Budget Summary
| 2021/2022 | $5,000
| -
|
2022/2023
| -
| $30,000
|
| 2023/2024 | -
| -
|
| 2024/2025 | -
| -
|
| 2025/2026 | -
| -
|
| 2026/2027 | -
| -
|
2027/2028
| -
| - |
2028/2029
| -
| -
|
2029/2030
| -
| -
|
2031/2032
| -
| -
|
| Total | $5,000
| $30,000
|
An explanation of the categories within the budgets are as follows below:
- Expenditure consists of operation and maintenance costs;
- Renewals are replacement of assets which are nearing or exceeded their useful life;
- Projects are investigations, decisions and planning activities which exclude capital works; and
- Capital projects are activities involving physical works.
Table 3‑12 Key Projects
Capital Projects
| TBC
| Pressure sensors
| -
| $30,000
| -
| -
| 100% LoS
|
Projects
| TBC
| Investigate water loss
| $5,000
| -
| -
| -
| 100% LoS
|
* Where LoS refers to Level of Service and G refers to Growth
The list of district wide projects can be found in 5Waters Activity Management Plan: Volume 1.
Discussion on Projects
Projects have been determined based on their:
- Relevance to the scheme
- Requirement to be completed under legislation
- Ability to bring the scheme up to or maintain the Level of Service required under council's Asset Management Policy.
Many projects are jointly funded by more than one scheme and activity. Each scheme pays a pro-rata share only, equivalent to the number of connections.
Discussion on Capital and Projects
Where relevant, Capital (Levels of Service) and Capital (Growth) projects have been included in the scheme financial details.
Levels of Service Projects and growth splits have been provided to ensure the costs of population driven works are clear.
<<
5-Waters Volume 2 - Water Supplies


