<<
5-Waters Volume 2 - Water Supplies
4 Claremont Water Supply
4.1 Scheme Summary
| Estimated Population Served | 163
|
Scheme Coverage (1 Jan 2018)
| Full Charges | 54
|
| Half Charges | 0
|
| >1 Charges | 5
|
System Components
| Bores/Intakes (No.) | 1
|
Treatment/Disinfection
| 1
|
| Reservoirs (No.) | 1
|
| Pump Stations (No.) | 1 |
| Piped (m) | 2,687
|
| History | Original scheme installation date | 2005
|
Value ($)
| Replacement Cost | $687,006
|
| Depreciated Replacement Cost | $472,185
|
| Financial | Operator cost (scheduled and reactive maintenance) per connection | $700.95/connection
|
Demand (m3) (1 Jan – 31 Dec 2020)
| Average daily (m3/day) | 153
|
| Peak daily (m3/day) | 518 |
| Minimum daily (m3/day) | - |
| Average daily per connection (m3/day) | 2.4
|
| Type of Supply | | High pressure and unrestricted |
Target Pressure & Flow at boundary
| Pressure | >310 kPa |
| Flow | >20 L/min |
| Sustainability | Well Security | Secure |
4.2 Key Issues
The following key issues are associated with the Claremont water supply. A list of district wide issues are located in 5Waters Activity Management Plan: Volume 1.
Table 4‑1 Claremont Scheme Issues
| Confirmation of compliance with New Zealand Fire Fighting Code of Practice compliance issues. | Council will investigate and recommend the approach in relation to any New Zealand Fire Fighting Code of Practice compliance issues.
|
Catchment management
| To encompass a holistic view of the drinking water supply improved liaison with ECan and study of groundwater quality within the water supply protection zones are being investigated.
|
4.3 Overview & History
The Claremont Water Supply provides treated groundwater to a residential subdivision located on the south side of Main South Road, near Templeton. There are 59 sections within the subdivision, all of which are metered. Two backflow prevention devices are present within the scheme located at the two wastewater pump stations within the scheme.
The water supply for the subdivision was commissioned in 2005. Templeton is served by water from the Christchurch City Council supply. However, the Claremont subdivision is outside of the city boundary and therefore required a standalone supply. There is potential for the Claremont scheme to be connected to the Prebbleton supply (4 km away) in the future if the cost of supplying water from Prebbleton becomes more affordable than operating and maintaining the current supply.
Water for the Claremont water supply is obtained from a single deep bore off Devine Drive. The bore is 200 mm in diameter and 108 m deep. The water has been age tested to verify the potential secure status of the bore. Residence time results and subsequent sampling, combined with a physical inspection of the bore head, have led to the District Health Board (DHB) designating the Claremont bore as secure to date.
A single bore pump delivers water through the water treatment plant (WTP) where it is UV treated prior to being stored in a 110 m3 reservoir. The water is then boosted through three surface pumps to the reticulation. The scheme was designed as a high pressure, unrestricted metered supply. The booster pumps are controlled by a pressure sensor. When the pressure drops then either one or both of the smaller booster pumps start. If the pressure continues to drop, the larger fixed speed booster pumps is called to run. The smaller booster pumps continue to run. If the reservoir level becomes low, the bore pump is started, refilling the reservoir. The control system is linked to the Council’s Supervisory Control and Data Acquisition (SCADA) system and all inputs are powered by mains electricity. The SCADA system monitors the pumps, inflow into the reticulation, and reservoir level, recording among other things, daily water usage and pump hours. Alarms include pump fault and communications failure. The telemetry system has battery backup.

Figure 4‑2 Scheme Schematic
4.4 System Capacity
This water supply was developed to serve the 59 lot rural residential subdivision. Most allocated connections are utilised (6 unused connections remaining) and it is not intended that this supply area be extended. The supply is able to meet current peak demands without the need for water restrictions. Any further development in this area could potentially be served by connection to the nearby Christchurch City Council water supply.
Table 4‑2 Capacity Summary
| Abstraction Capacity | 11.7 | 1010 | - | 1 x bore pump (nom capacity) |
| Consented Take | 12 | 1037 * | 124,000 | |
| Peak Demand | 15.7 **
| 925 *** | 78,740 **** | |
* inferred value, ** 1 Feb 2015, *** 26 Jan 2015, **** 2014
4.5 Resource Consents
The Claremont water supply has a number of resource consents. Table 4‑3 shows the water take permitted by the resource consents for this scheme.
Table 4‑3 Resource Consents
CRC000094
| to take groundwater from a proposed bore, at or about map reference NZMS 260 M36:6658-3801 for the domestic supply of a residential subdivision. | Waterholes Road, TEMPLETON | 17-Nov-99 | 15-Nov-34 | 12 | |
This consent is currently under the developer's name (Debon Holdings Limited). Council is working to resolve this issue.
4.6 Water Quality
The Claremont water supply is a secure source and is currently sampled weekly within the treatment plant and monthly within the reticulation.
The following details E. coli transgressions for the sample periods 2012 to 2020.
Treatment
There have been no E. coli transgressions for this period in the treatment plant.
Reticulation
There have been no E. coli transgressions for this period in the reticulation zone.
Chemical Analysis
The following is a summary of the raw water chemical analysis carried out at the Claremont Water Supply.
Table 4‑4 Claremont Water Supply Raw Water Chemical Analysis Summary
| Total Lead (g/m3) | 0.01 (Maximum Acceptable Value)
| 0.00017 | <0.00011 | <0.00011
| ✓
|
| pH (pH units) | 7-8.5 (Guideline Value)
| 7.8 | 7.8
| 7.9
| ✓
|
| Total Hardness (g/m3 as CaCO3) | <200 (Guideline Value)
| 39 | 38.4
| 38.6
| ✓
|
| Total Calcium (g/m3) | n/v | 13.4 | 13.28 | 13.31
| ✓ |
| Total Iron (g/m3) | <0.2 (Guideline Value)
| <0.021 | < 0.021 | <0.021
| ✓ |
| Total Sodium (g/m3) | <200 (Guideline Value)
| 5.9 | 10.89 | 5.28
| ✓
|
Nitrate - Nitrogen (g/m3)
| 11.3 (Maximum Acceptable Value)
| 1.08
| 4.00
| 1.21
| ✓
|
4.7 Scheme Assets
A summary of material and diameter for pipes in Claremont is shown below by Figure 4‑3 and Figure 4‑4.
Figure 4‑3 Pipe Material – Claremont
Figure 4‑4
Pipe Diameter – Claremont
4.8 Operational Management
The water supply is operated and maintained under two maintenance contracts as follows:
- Contract 1241: Water Services Contract. Contract is with SICON who undertakes investigations, conditions inspections, proactive and reactive maintenance and minor asset renewals; and
- Contract 1202: Parks and Reserves Contract. Contract is with SICON who undertakes the maintenance of land scape features related to water services e.g. mowing, gardens etc.
Water quality sampling is completed under an agreement with Food and Health Ltd as required.
4.9 Photos of Main Assets

Photo 1: Bore
|
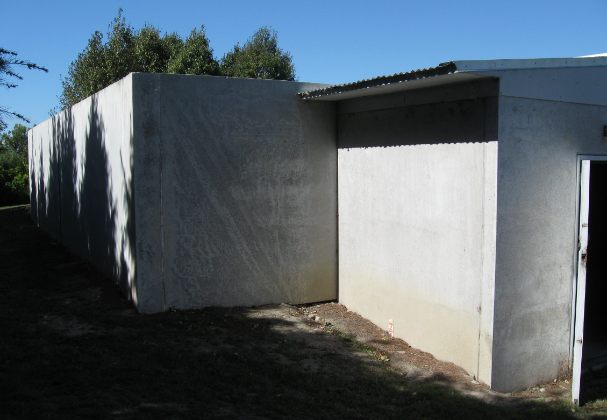
Photo 2: Reservoir
|
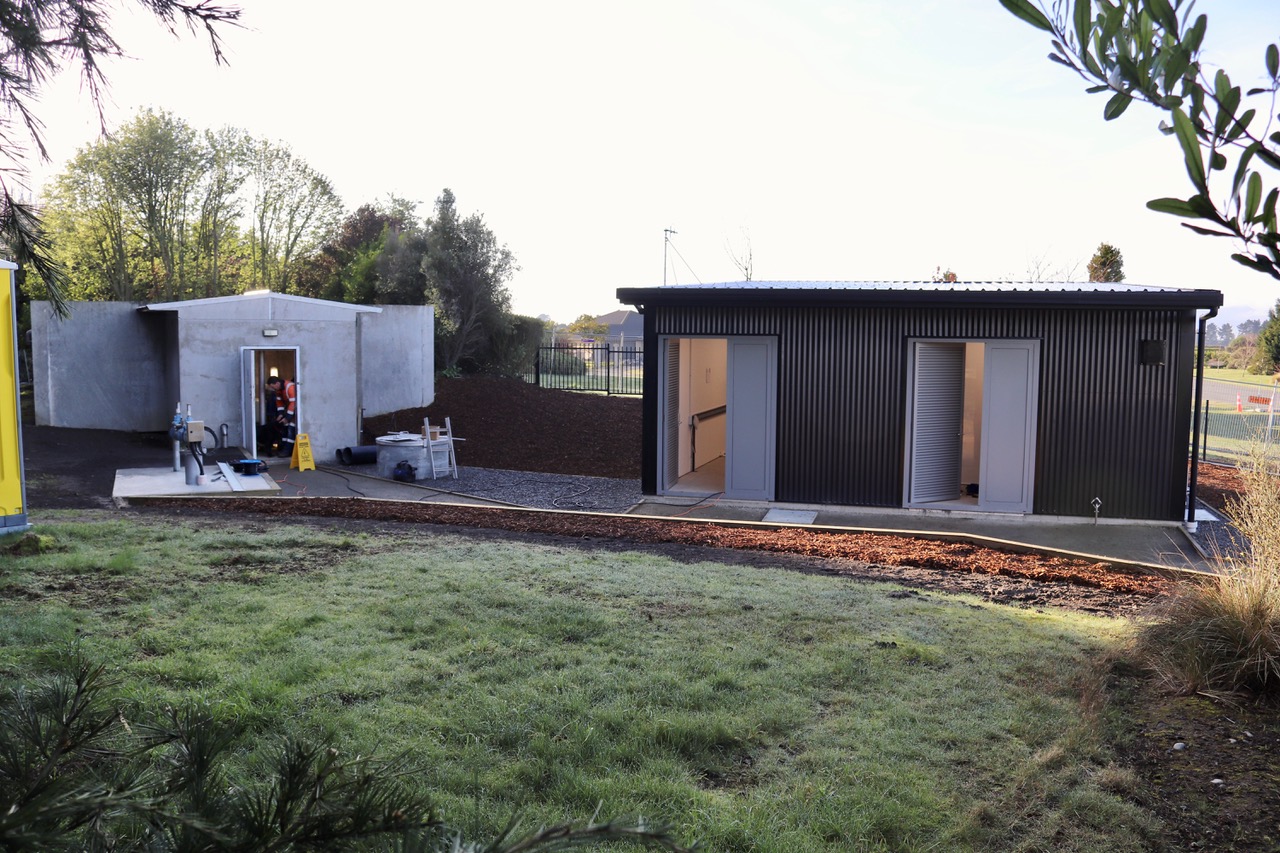
Photo 3: Pump shed
|
4.10 Risk Assessment
A risk assessment has been undertaken for the Claremont scheme. The key output from the risk assessment is the identification of any extreme and high risks which need to be mitigated. In order to mitigate these risks they have been included and budgeted for in the projects within this LTP. Table 4‑5 outlines the risk priority rating, Table 4‑6 outlines the risks and the list of key projects is found in Table 4‑11.
Table 4‑5 Risk Priority Rating
> 50
| Extreme
| Awareness of the event to be reported to Council. Urgent action to eliminate / mitigate / manage the risk. Document risk and action in the AMP. |
| 35-50 | Very High | Risk to be eliminated / mitigated / managed through normal business planning processes with responsibility assigned. |
| 14-35 | High | Manage risk using routine procedures. |
| 3.5-14 | Moderate | Monitor the risk. |
| < 3.5 | Low | Awareness of the event to be reported to Council. Immediate action required to eliminate / mitigate / manage the risk. Document risk and action in the AMP. |
Table 4‑6 Risks – Claremont
If reservoir overflows, into control shed
| Test reservoir overflow and ensure electrical controls in nearby building is not affected. Install splash protection e.g. a curtain. | 2014 | 12 | 12 | 6 |
Electrical failure due to lightning or network spikes
| Install surge diverters | 2014 | 6 | 6 | 6 |
| Failure to meet NES water meter standards | NES Water Meter Compliance | 2014 | 20 | 6 | 6 |
| Inability to collect income from non-metered properties | Install property water meters | 2014 | 27 | 0.6 | 0.6 |
| Non-compliance with the DWSNZ | DWSNZ - Age Testing | 2014 | 6 | 0.7 | 0.7 |
| Non-compliance with the DWSNZ | DWSNZ - Bore-head security | 2014 | 6 | 6 | 6 |
| Non-consented activities | Renewal of consents | 2014 | 27 | 27 | 6 |
| Overflow of tank into treatment building | Vent building outside | 2017 |
| 6
| 0.2 |
| SCADA control for remote control of pumps | Install remote controls | 2017 | | 4 | 0.2 |
The list of district wide risks can be found in 5Waters Activity Management Plan: Volume 1.
4.11 Asset Valuation Details
The total replacement value of assets within the Claremont water scheme is $687,006 as detailed in Table 4‑7 below.
Table 4‑7 Replacement Value, Claremont
Plant and Equipment
| $310,564
|
Water Reticulation
| Hydrant | $31,284
|
| Lateral | $29,231
|
| Pipe | $257,836
|
| Supply Point | $45,666
|
| Valve | $12,425
|
4.12 Renewals
The renewal profile has been taken from the 2019 5 Waters Valuation. A graph showing the renewals for this scheme are shown by Figure 4‑5 below. There is a backlog of overdue renewals.
Figure 4‑5 Claremont Water Renewal Profile
4.13 Critical Assets
The criticality model for Claremont has been updated for the 2021 AcMP. The methodology of the criticality model can be found in 5Waters Activity Management Plan: Volume 1 and it provides details of how the criticality has been calculated for the reticulation assets. Table 4‑8 and Figure 4‑6 below shows the calculated criticality for all of the assets within this scheme that have a recorded known length.
Table 4‑8 Length of Assets per Criticality Level
5
| Low | 1,257
|
4
| Medium-Low | 1,134
|
3
| Medium | 812
|
2
| Medium-High | 0 |
1
| High | 0 |
4.14 Asset Condition
The asset condition model was run for Claremont in 2021. The methodology of the model can be found in 5Waters Activity Management Plan: Volume 1 which provides details of how the model has been calculated for the pipe reticulation assets. Figure 4‑7 below shows the level of asset condition for these assets within this scheme that have a recorded known condition.
Table 4‑10 provides a description of the condition rating used within the condition model.
Table 4‑9 Asset Condition Grading
| 1.0 | Excellent |
| 2.0 | Good |
| 3.0 | Moderate |
| 4.0 | Poor |
| 5.0+ | Fail |
The number of pipe faults is also measured through the asset management system. Figure 4-8 shows the known historic pipe failures within this scheme.
4.15 Funding Program
The 10 year budgets are shown by Table 4‑12. Budgets are split into expenditure, renewals, projects and capital projects. Expenditure and renewals have been reported on a district-wide basis in Volume 1.
All figures are ($) not adjusted for CPI “inflation". They are calculated on historical data, and population growth where relevant.
Table 4‑10 Budget Summary
| 2021/2022 | -
| -
|
2022/2023
| -
| -
|
| 2023/2024 | -
| -
|
| 2024/2025 | -
| -
|
| 2025/2026 | -
| $200,000
|
| 2026/2027 | -
| -
|
| 2027/2028 | -
| $200,000
|
2028/2029
| -
| -
|
2029/2030
| -
| -
|
2031/2032
| -
| -
|
| Total | -
| $400,000
|
An explanation of the categories within the budgets are as follows below:
- Expenditure consists of operation and maintenance costs;
- Renewals are replacement of assets which are nearing or exceeded their useful life;
- Projects are investigations, decisions and planning activities which exclude capital works; and
- Capital projects are activities involving physical works.
Table 4‑11 Key Projects
Capital Projects
| -
| Reservoir internal wall
| -
| -
| -
| $200,000
| TBC
|
Capital Projects
| -
| Additional source: 140m deep bore
| -
| -
| -
| $200,000
| TBC
|
* Where LoS refers to Level of Service and G refers to Growth
The list of district wide projects can be found in 5Waters Activity Management Plan: Volume 1.
Discussion on Projects
Projects have been determined based on their:
- Relevance to the scheme
- Requirement to be completed under legislation
- Ability to bring the scheme up to or maintain the Level of Service required under council's Asset Management Policy.
Many projects are jointly funded by more than one scheme and activity. Each scheme pays a pro-rata share only, equivalent to the number of connections.
Discussion on Capital and Projects
Where relevant, Capital (Levels of Service) and Capital (Growth) projects have been included in the scheme financial details.
Levels of Service Projects and growth splits have been provided to ensure the costs of population driven works are clear.
<<
5-Waters Volume 2 - Water Supplies


