<<
5-Waters Volume 1
7 Lifecycle Management
This section outlines what is planned to manage and operate the assets at an agreed level of service while optimising lifecycle costs. It covers asset condition and criticality, operation and maintenance plan, renewal replacement plan, asset acquisition and disposal plan.
Lifecycle asset management focuses on management options and strategies considering all relevant economic and physical consequences, from initial planning through to disposal. The effective application of asset management principles will ensure the reliable delivery of service and reduce the long-term cost of ownership and in this way reduce service costs [19]. A well-structured lifecycle management plan will reduce the long term costs of ownership and in so doing reduce the service cost.
The Lifecycle Management Programmes cover the three key categories of work necessary to achieve the required outcomes from the 5Waters Activity. These key categories are:
Operations and Maintenance Plan:
To ensure efficient operation and serviceability of the assets so that they achieve their service potential over their useful lives. This includes the day-to-day work to keep the assets operating.
| Maintaining the service potential of the assets and ensuring that the assets achieve that potential
|
Renewal Plan:
To provide for the progressive replacement of individual assets that have reached the end of their useful lives (restores the original capacity)
|
Development Plan:
To improve parts of the system currently performing below target service standards and to allow development to meet future demand requirements
| Closing service gaps.
Meeting the future demand
|
The fourth category is the disposal programme (sale, disposal or relocation); while not as critical as the other four areas it still plays a role in the lifecycle management.
7.1 Asset Types
The 5Waters activity utilises a range of assets. The 5Waters assets are grouped into the following nine asset type groups below:
-
Water
Network
Assets: Reticulation level assets supplying potable water covering pipes, laterals, valves, hydrants, supply points and chambers.
-
Water
Facility
Assets: Encompasses all assets contained within a water facility such as pump stations, reservoirs, chambers, bores, water treatment (filtration, disinfection and dosing), SCADA and control assets.
-
Wastewater
Network
Assets: Reticulation level wastewater assets covering pipes, laterals, valves, manholes and chambers.
-
Wastewater
Facility
Assets: Encompasses all assets contained with a wastewater facility such as pump stations, chambers, wastewater treatment (aeration, filtration, disinfection), disposal, SCADA and control assets.
-
Stormwater
Assets: Stormwater assets covering inlet structures, pipes, laterals, valves, manholes, chambers, basins, ponds and swales, tanks, outlet structures, and management devices.
-
Land
Drainage
Assets: All land drainage assets covering pipes, culverts, land drains, gates, valves, manholes, chambers, ponds, weirs outfall structures.
-
Land
Drainage Facility
Assets: Encompasses all assets contained with a land drainage facility.
-
Water
Race
Assets: All water race assets covering inlet structures, tunnels, pipes, valves, culverts, water race channels (Main, Lateral and Local), outfall structures and control structures.
-
Water Race Facility
Assets: Encompasses all assets contained with a water race facility.
These asset types are structured in AMS, this is shown in
Figure 7‑1 and Figure 7‑2 below.
Figure 7‑1 5Waters Asset Classes

Figure 7‑2 5Waters P&E Asset Classes
A summary of material and diameter for water supply pipes is shown below in Figure 7‑3 and Figure 7‑4.
Figure 7‑3 Water Pipe Diameter
Figure 7‑4 Water Pipe Material
A summary of material and diameter for wastewater pipes is shown below in Figure 7‑5 and Figure 7‑6.
Figure 7‑5 Wastewater Pipe Diameter
Figure 7‑6 Wastewater Pipe Material
A summary of material and diameter for stormwater pipes is shown in Figure 7‑7 and Figure 7‑8 below.
Figure 7‑7 Stormwater Pipe Diameter
Figure 7‑8 Stormwater Pipe Material
A summary of material and diameter for land drainage pipes is shown below in Figure 7‑9 and Figure 7‑10.
Figure 7‑9 Land Drainage Pipe Diameter
Figure 7‑10 Land Drainage Pipe Material
A summary of material and diameter for water race pipes is shown in Figure 7‑11 and Figure 7‑12 below.
Figure 7‑11 Water Race Pipe Diameter
Figure 7‑12 Water Race Material
7.2 Asset Capacity and Performance
7.2.1 Water Supply Scheme Capacity
Water supply capacity assessments have been completed for all of the community drinking water supplies. These assessments have been completed to varying levels of detail relative to the nature of the supply, known issues, and anticipated growth pressures. The system capacity for these schemes, and details about the new well requirements, is located in Volume 2: Water Supply.
Hydraulic Models
Castle Hill, Darfield, Edendale, Kirwee, Lincoln, Leeston and Doyleston, Prebbleton, Rolleston, Southbridge and West Melton water supplies have been assessed using the existing hydraulic models to develop a higher level of understanding and confidence in the system capacities and potential to accommodate growth. These are the main townships and rapidly developing areas.
In response to the accelerated growth within the Selwyn District and the introduction of the Canterbury 'Land Use Recovery Plan', hydraulic models have been used to plan future water infrastructure for the water supplies. Hydraulic models have been built and calibrated to international best practice to carry out the
'30-year Water Infrastructure Master Planning'.
The master planning provides an assessment of the sizing and timing of new infrastructure for new water sources (wells) and pipelines to service growth. Part of the master planning requires a water balance to be developed to forecast growth, using historical peak demand per household. The water balance forecasts the peak instantaneous flow per year versus the water resources available to determine the staging of new wells. The well staging assumes that one well is redundant for each water supply, to take into consideration maintenance of wells, planning/timing of new wells and security of supply i.e. to maintain average/peak demand.
Other Capacity Assessments
Simple assessments using basic information and knowledge have been completed for Dunsandel, Springfield, Sheffield/Waddington, Springfield and Tai Tapu/Otahuna water supplies. These are smaller towns where growth is not anticipated and/or surplus capacity is available.
A low level assessment has been completed for Arthurs Pass, Claremont, Edendale, Johnson Road, Jowers Road, Lake Coleridge, Rakaia Huts, Raven Drive, Taumutu, Te Pirita and Upper Selwyn Huts. These supplies have typically been developed for a discrete group of properties and no further connections are anticipated/ permitted. Any adjacent development would typically need to provide new water supply infrastructure. These supplies are rural subdivision supplies (e.g. Edendale), alpine villages (e.g. Arthur's Pass), and recreational villages (e.g. Rakaia Huts).
Malvern Hills and Hororata-Acheron are two large rural water schemes, each comprising two supply areas. These are restricted supplies where water is trickle fed into consumer tanks via a restrictor, which limits the daily take to an agreed volume. Water is supplied for both domestic purposes and stock/ agricultural use.
7.2.2 Water Pipe Performance
The water hydraulic models were used to model pipe head loss and consequently to measure the performance of pipes in the network in early 2018 and again in 2021. This information is yet to be analysed, mapped in GIS and stored in AMS.
7.2.3 Wastewater Scheme Capacity and Pipe Performance
The Council has developed two wastewater models for the major townships. The Ellesmere Wastewater Model includes the townships of Doyleston, Leeston and Southbridge. The Eastern Selwyn Sewer Model includes the townships of Rolleston, Prebbleton, Lincoln, Springston and West Melton. A hydrological and hydraulic model of the two catchments were developed using InfoWorks ICM v6.0 modelling software. This was based primarily on Geographical Information Systems and supplemented by drawings (both design and as-built), operations and maintenance manuals, site visits, and operator knowledge.
The purpose of the models are to ensure that Council has accurate knowledge of the operational performance and hydraulic capacity of the:
- Ellesmere wastewater reticulation network, from collection through conveyance and pumping, to discharge at the Ellesmere Wastewater Treatment Plant (WWTP); and
- Eastern Selwyn Sewerage Scheme (ESSS) reticulation network from collection through conveyance and pumping to discharge at the Pines WWTP.
Council plans to use these models to inform future development in response to growth and for operational purposes.
7.3 Asset Condition
A condition grading model was adopted by Council in 2014 utilising three different data sources:
- CCTV;
- A condition formula; and
- Condition grades assigned by the maintenance contractor.
A condition rating was developed for pipes with expertise from Opus International Consultants. A Condition Grade (scale 1-5) was evaluated for pipes as a function of the percentage of life remaining. This is based on:
- Alignment of each pipe material useful life;
- Pipe use (e.g. water supply);
- Pipe Diameter; and
- Pie age at time of assessment.
Then the following equation is applied to each asset and then classified according to Table 7‑1.
Table 7‑1 Condition Grading
1
| 75%
| >75%
| Very Good
|
| 2 | 50% | >74% | Good |
| 3 | 25% | 46% | Moderate/Adequate |
| 4 | 3% | 24% | Poor |
| 5 | ≤0% | 2% | Very Poor |
Further details regarding the methodology is located in “Pipe Data Management 5Waters".
Closed circuit television (CCTV) inspection of wastewater gravity mains is also undertaken for various reasons. In general these include: locating sources of inflow, checking grades, confirming satisfactory installation at the time of asset vesting and locating blockages. CCTV data exists for 13% of our wastewater pipes, shown in Figure 7‑13 below.
Figure 7‑13 CCTV Condition Score for Wastewater Pipes
The condition grading model is applied to pipes across the 5 Waters. The model assigns condition grades in the following basis in priority order:
- CCTV Inspection value if under 10 years old; then
- Asset Condition Formula; then
- Maintenance contractor assigned value.
The following graphs illustrate the condition ratings of pipe within the district.
Figure 7‑14 Water Pipe Condition Rating
Figure 7‑15 Wastewater Pipe Condition Rating
Figure 7‑16 Stormwater Pipe Condition Rating
Figure 7‑17 Land Drainage Pipe Condition Rating
Figure 7‑18 Water Race Pipe Condition Rating
Condition assessment is currently limited to pipes, therefore an improvement item is to extend this model and determine the condition across the full range of asset types.
7.4 Asset Criticality
Critical assets are “those which have a high consequence of failure, but not necessarily a high probability of failure". These assets are typically the most important to the organisation and its customers, irrespective of the likelihood of a failure of the asset.
Asset criticality allows the assets to be prioritised, so that they can be managed more proactively in order to mitigate the risk associated with their failure. The proactive management approach includes:
- Priorities for undertaking condition assessments;
- Adjusting economic lives with respect to renewal profiles;
- Prioritising/deferring renewals;
- Prioritising expenditure;
- Operation and maintenance planning; and
- Priorities for collecting asset information to the required level of confidence.
In 2017 the asset criticality model was re-run. This included a model for sites which was reviewed. A consequence based assessment was used which considered the implications of asset failure in terms of its economic, social, cultural and environmental consequences.
7.4.1 Methodology
Criticality can be represented by the following basic equation:
Criticality = Effect x Duration x Number affected x Sensitivity
There are a number of elements that influence an asset's criticality. The following were included in the assessment of the raw Criticality Score for reticulation line assets:
-
Service Type: The community has different sensitivities to the loss of different services. Therefore assets were grouped according to the five service types.
-
Size: Size influences the cost associated with failure and size can typically provide a good approximation to the relative number of people affected.
-
Depth: Depth influences the cost associated with failure and the duration of the loss of service.
-
Dewatering and Sheet piling: These influence the cost associated with failure and the duration of the loss of service.
-
Location within a Road Carriageway: When compared to an equivalent failure within an adjacent berm, the failure of an asset under a road has a greater associated cost and will impact on a greater number of people.
The raw Criticality Score was adjusted on these assets for Social, Economic, Cultural or Environmental influences. For the purpose of this assessment this was accounted for by identifying those assets within, or adjacent to, any of the following significant locations:
-
Critical Customers: These include Aged Residential Care Facilities, Medical Centres, Hospitals, Community Care Facilities, Pharmacies, Medical Practices, Welfare Centres, and Dialysis Patients. These customers are considered to be relatively more sensitive to loss of service and some of these also effectively increase the number of people affected by a failure.
-
Schools: These customers are considered to be relatively more sensitive to loss of service and they also effectively increase the number of people affected by a failure.
-
Business Zone: Failures within a business zone would have a relatively greater economic effect and would typically affect more people.
-
Prisons: These customers are considered to be relatively sensitive to unplanned asset failure. These locations also increase the relative number of people affected and, due to the relative complexity of undertaking construction works, potentially the duration of disruption.
-
State Highways: In addition to the factors applied to work within roads already covered within the raw criticality score, asset failures under State Highways are considered to introduce even greater cost and disruption effects.
-
Railway lines: Failures under railway lines have relatively greater effects on cost and disruption.
-
Cemeteries: For cultural reasons, the community is relatively more sensitive to asset failure within cemeteries.
-
Historical or Cultural Locations: The community is relatively more sensitive to asset failure adjacent to these locations. This sensitivity is heightened further if the nature of the failure has the potential to damage the significant structure / location. At certain times of the year, failure in these locations could also affect a relatively higher number of people.
-
Reserves: Depending on the service type, reserves could have a relatively greater sensitivity to an asset failure and / or a failure could affect a relatively greater number of people.
-
Significant Natural Areas: Depending on the service type, these areas could have a relatively greater sensitivity to an asset failure.
-
Waterways: Depending on the service type, these areas could have a relatively greater sensitivity to an asset failure.
Once these assets were tagged a criticality score was assigned to the asset which determine where it fell in the criticality band: high, medium-high, medium, low-medium, and low.
Point assets associated with the pipe assets were assigned the same criticality. For example a pipe tagged with low criticality also tagged its associated hydrant or manhole with low criticality.
Sites or facilities, such as pump stations, were also tagged with their associated pipes criticality leaving or entering the site. These sites were reviewed and some scores were manually adjusted where appropriate.
The results of the criticality analysis are stored in GIS and AMS.
7.4.2 Results
A summary of the criticality results for the reticulation asset by length is provided below in Figure 7‑19 and Table 7‑2. The majority (72%) of reticulation assets are classed as low criticality with 0.9% being classed as high criticality. Wastewater has the longest length of assets where the criticality is classed as high.
Figure 7‑19 Criticality Band distribution for the 5Waters Activities
Table 7‑2 Criticality Results for 5Waters Reticulation Assets
| Low | 262,863 | 303,434 | 157,286 | 855,376 | 1,280,518 | 2,859,478 |
| Medium-Low | 33,362 | 84,427 | 10,212 | 251,157 | 416,329 | 795,487 |
| Medium | 47,712 | 28,240 | 13,649 | 125,956 | 23,223 | 238,780 |
| Medium-High | 23,025 | 32,954 | 4,902 | 87,940 | 9,374 | 158,195 |
| High | | 26,632
| 321 | 9,218 | 574 | 36,745 |
Total
| 366,962 | 475,688 | 186,369 | 1,329,647 | 1,730,019 | 4,088,685 |
For Plant sites the distribution is similar with only three sites being classed as high, this is shown below in Table 7‑3.
Table 7‑3 Plant Sites and Criticality
Low
| 36 |
| Medium-Low | 41 |
| Medium | 33 |
Medium-High
| 21 |
| High | 10 |
|
Grand Total | 141 |
Further information on the criticality results in located in Volume 2, 3, 4, 5 and 6 at a scheme basis. Further details regarding the methodology is located in “5Waters Criticality Assessment, Asset Criticality Report".
7.4.3 Priorities for Critical vs Non-Critical Assets
The failure of a critical asset suggests that maintenance, refurbishment or asset renewal should be carried out at an earlier stage in the asset lifecycle than would be the case for a non-critical asset. Typically, the risk of asset failure increases as its condition deteriorates, so for a critical asset the intervention should be programmed before the condition reaches a pre-determined threshold in order to minimise the risk of asset failure.
For non-critical assets, where the consequence of failure is minimal, a possible asset management strategy is to allow the asset to “run to failure". For example a non-essential pump which can easily and quickly be replaced without disrupting the service provided to customers can be left to replaced when it fails to operate.
Prioritisation relating to asset criticality is also discussed in Section 0 Critical Assets Priorities.
In the future, subject to the availability of resources, it is intended that selection and prioritisation criteria for asset renewals and new asset investment will put a greater emphasis on condition, performance, risk and failure history assessment. This approach will utilise Optimised Decision Making (ODM) tools such as:
- Intervention (condition trigger) based renewal programs for critical assets based on service impact analysis.
- Risk-based economic analysis – economic quantification of the risk exposure comparing this with the capital costs of a project. This approach is also known as Failure Mode Effects and Criticality Analysis and is expected to be achieved through an interactive AMS/GIS workspace.
- Multi-criteria analysis – rating the effectiveness of a project against a range of evaluation factors, e.g. social, environmental, financial, growth, etc. outcomes.
Development of this approach has been included as an Improvement Plan task.
7.4.4 Asset Criticality at an Operational Level
The integration of criticality into the day to day operation and management of the 5Waters is an integral part of the 5Waters strategy with the following:
- Criticality assessments of assets within the 5Waters allows all staff involved in the management, administration and operation of the services to have the ability to ascertain via GIS, AMS or handhelds the location and relevant details of critical assets;
- Priority will be given to ensuring that data confidence ratings for high criticality assets are high;
- Priority will also be given to managing the assets better. The Maintenance Contract C1170 Variation (June 2014) includes requirements for inspection of assets that vary with criticality for facilities, mains, hydrants, air valves, manholes etc. Inspections will also improve data confidence in the quality of asset data;
- Renewal strategy that facilitates the renewal of critical assets in a proactive manner;
- Condition assessments will be dependent on asset criticality and the percentage of life expectancy still attributed to the asset; and
- Workshops for operational staff on the background and requirements of criticality.
7.5 Asset Valuations
WSP was commissioned by Selwyn District Council to value its water supply, wastewater, stormwater, land drainage and water race assets as at 1st July 2019.
The current valuation shows a total value of assets of $728 million (total gross optimised replacement cost, excluding land), depreciated replacement cost of $567 million and annual depreciation of $9 million.
The purpose of the valuation is for reporting utility asset values in the financial statements of Council and for determining renewal funding. Table 7‑4 and Figure 7‑20 below provide a summary of the 2019 5Waters valuation.
Table 7‑4 Summary of Utility Asset Values at 1st July 2019
Water Supply | $184,226,000
| $128,780,000
| $3,801,000
|
Wastewater
| $311,469,000
| $258,847,000
| $4,265,000
|
Stormwater | $70,207,000
| $62,340,000
| $813,000
|
Land Drainage | $45,098,000
| $44,162,000
| $36,000
|
Water Race | $117,674,000
| $73,076,000
| $527,000
|
Total Value | $728,674,000
| $567,205,000
| $9,442,000
|
Figure 7‑20 Replacement Value across the 5Waters
7.5.1 Water
The water supply reticulation assets include the pipes, fittings, fire hydrants, supply points, plant and equipment items. The replacement cost, depreciated replacement cost and annual depreciation of the stormwater assets by scheme are summarised in Figure 7‑21.
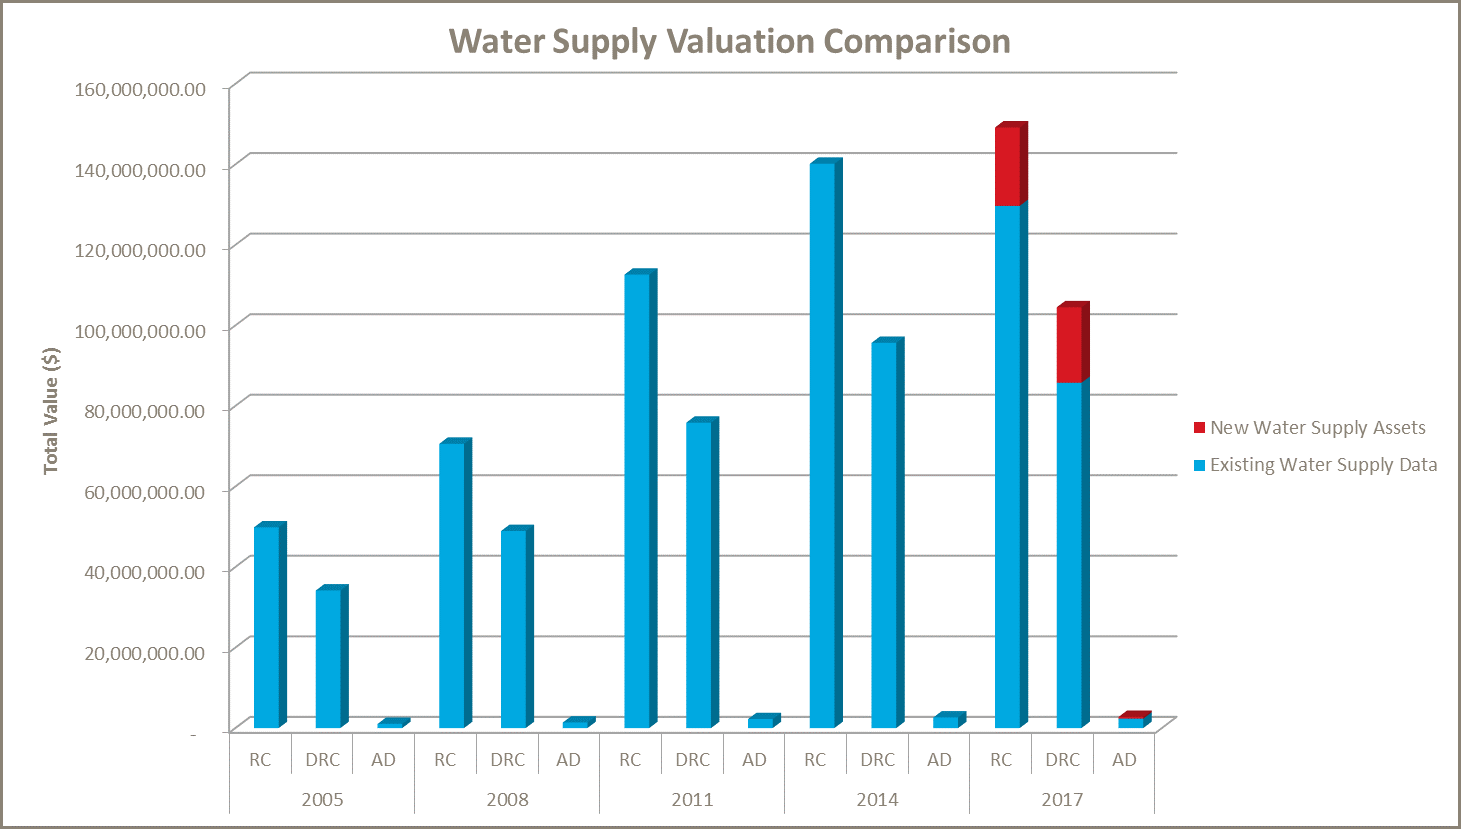
Figure 7‑21 Water Asset Valuation Summary 2019
Overall the water supply assets have increased in depreciated replacement value by 21% and annual depreciation by -3%.
7.5.2 Wastewater
The wastewater reticulation assets include the pipes, fittings, manholes, chambers and plants and equipment items. The replacement cost, depreciated replacement cost and annual depreciation of the wastewater assets are summarised in Figure 7‑22 below.
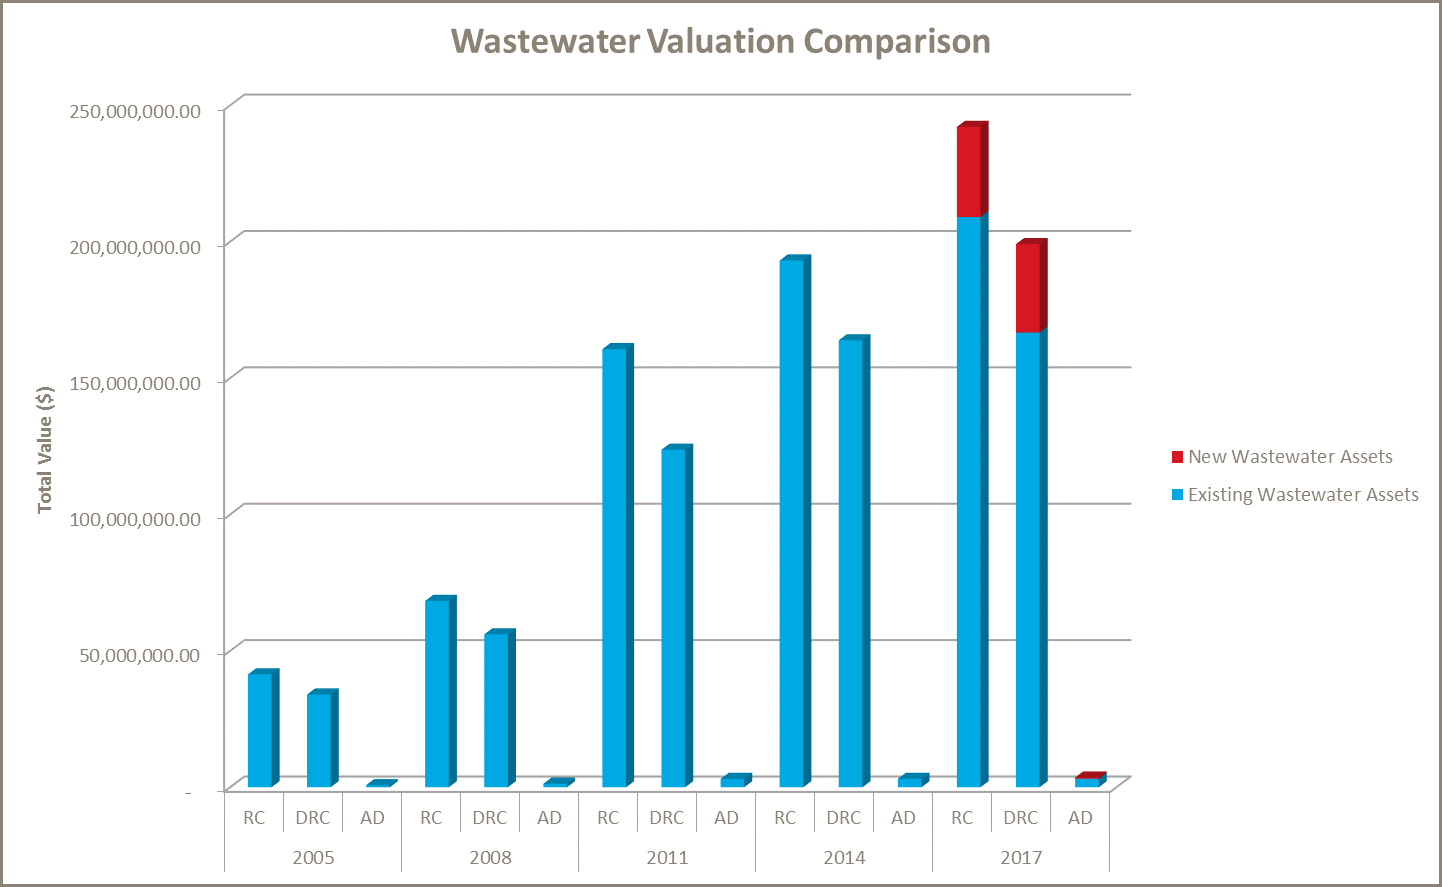
Figure 7‑22 Wastewater Asset Valuation Summary 2019
Overall the wastewater assets have increased in depreciated replacement value by 30% and annual depreciation by only 19%.
7.5.3 Stormwater
The stormwater reticulation assets include pipes, fittings, detention areas, pump stations and soakage pits. The replacement cost, depreciated replacement cost and annual depreciation of the stormwater assets by scheme are summarised in Figure 7‑23 below.
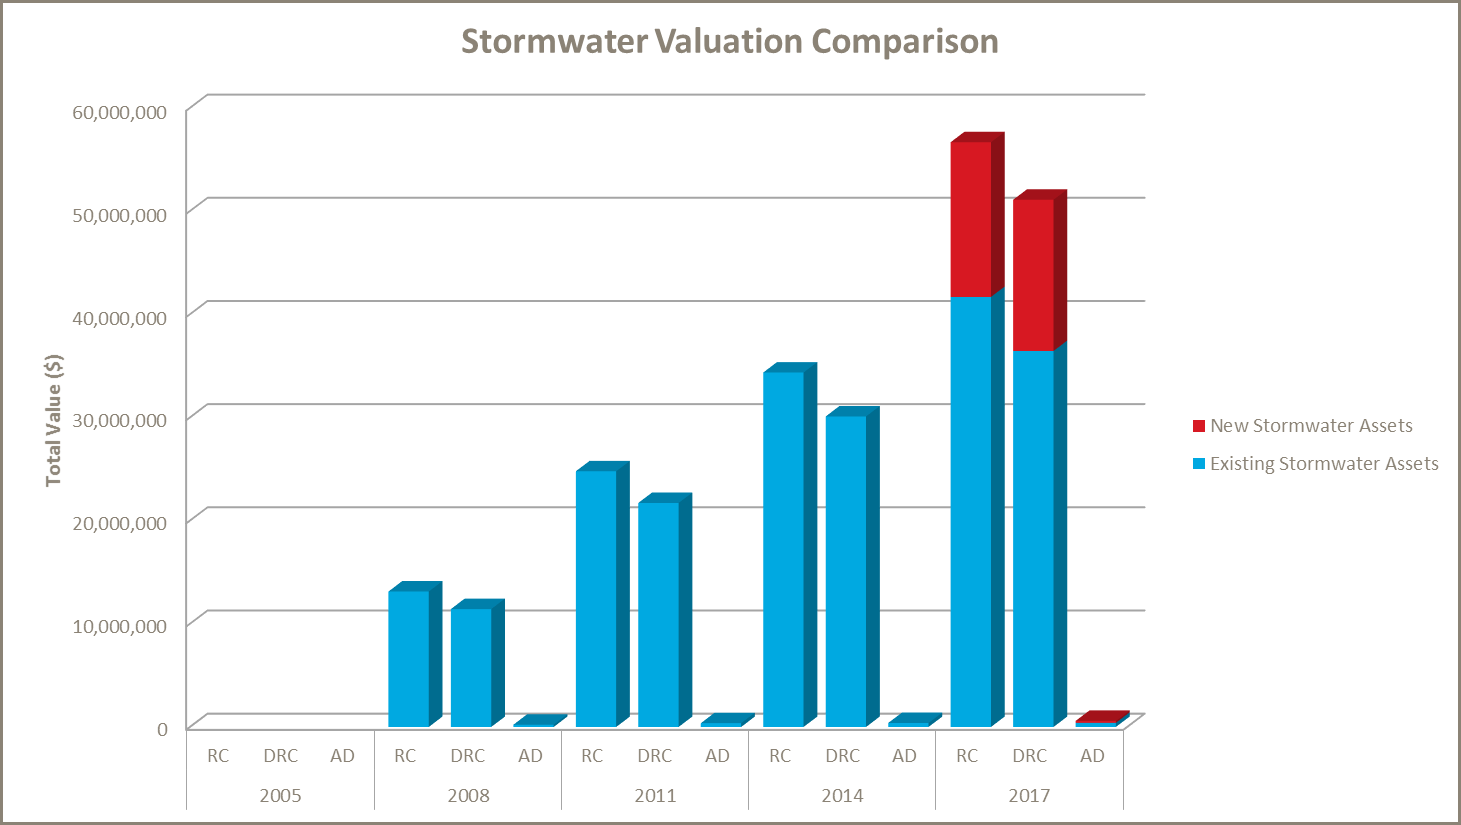
Figure 7‑23 Stormwater Asset Valuation Summary 2019
Overall the stormwater assets have increased in depreciated replacement value by 20% and annual depreciation by -16%.
7.5.4 Land Drainage
The land drainage assets include the open channels, pipes, structures and a pump station. The replacement cost, depreciated replacement cost and annual depreciation of the land drainage assets are summarised in Figure 7‑24 below.
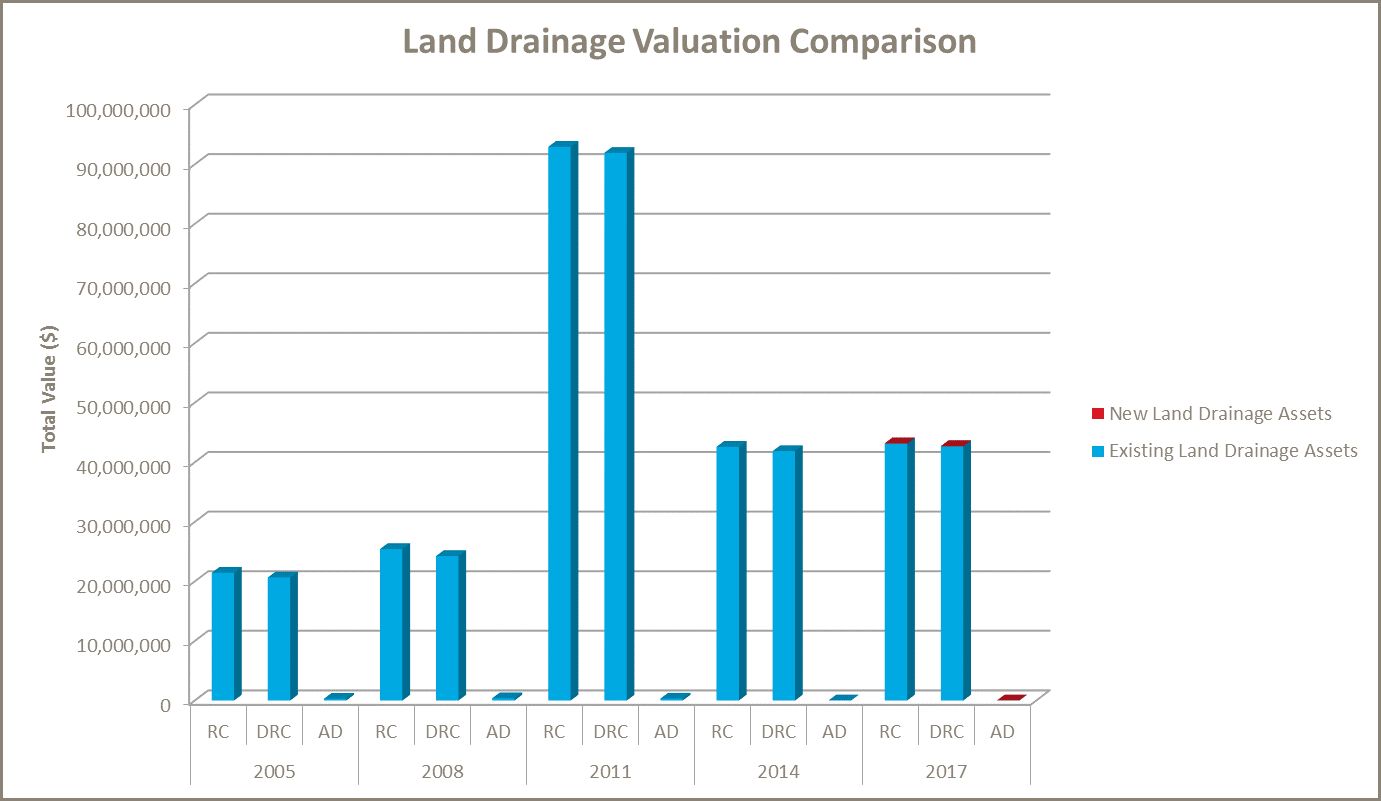
Figure 7‑24 Land Drainage Asset Valuation Summary 2019
Overall the land drainage assets have increased in depreciated replacement value by 3% and decreased in annual depreciation by -87%.
7.5.5 Water Races
The water race assets include culverts, channels, divides, gates, nodes, inlets/outlets, structures, tunnels, syphons, aqueducts and instruments. The replacement cost, depreciated replacement cost and annual depreciation of the water race assets are summarised in Figure 7‑25 below.
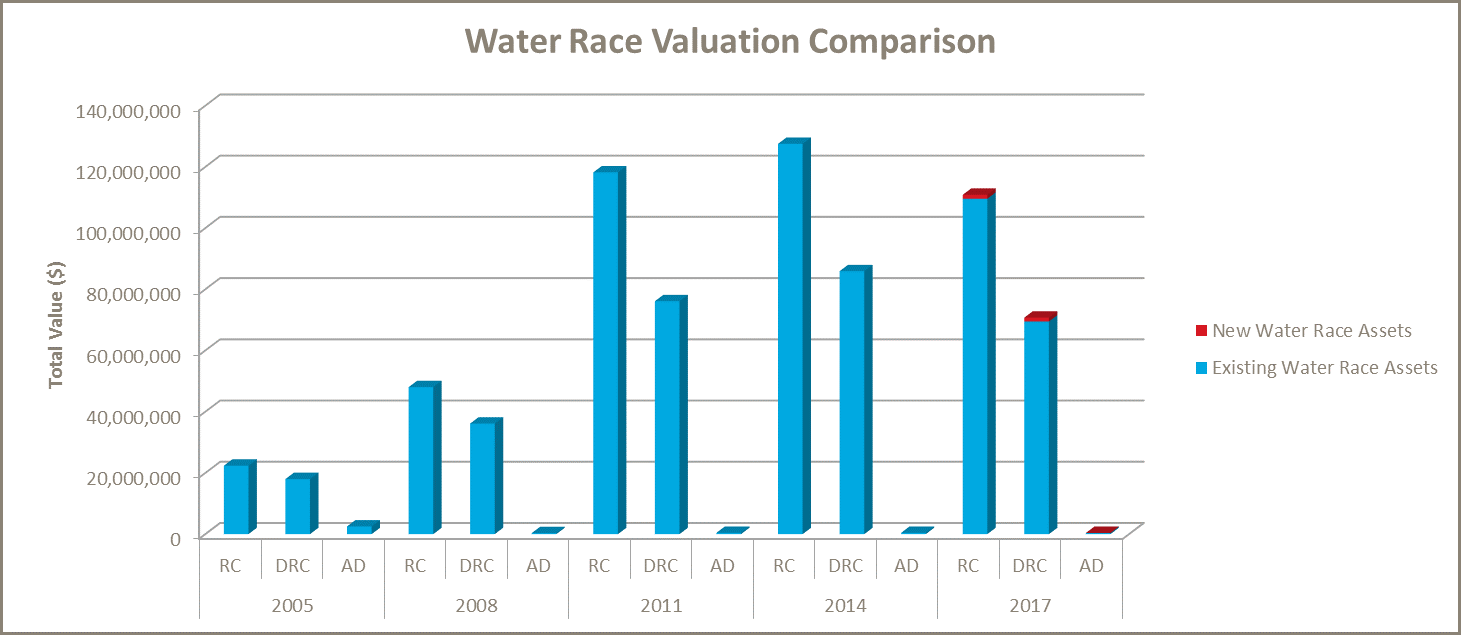
Figure 7‑25 Water Race Valuation Summary 2019
Overall the water race assets have decreased in depreciated replacement value by 2% and in annual depreciation by 4%.
7.5.6 Non-Depreciated Assets
The table below summarises the asset components which have not been depreciated, as outlined in NZIAVDG.
Table 7‑ Non-Depreciated Asset Summary
Channel-Drain
| Channel – Lateral
| Channel-Drain
|
| Stop bank | Channel - Main | Channel-Swale
|
| Channel - Local | Management Device - Basin
|
| Structure - Pond
|
|
7.5.7 Base Useful Lives
The Base Useful Lives for each asset type as published in the NZIAVDG Manual were used as guidelines for the lives of the assets in this valuation. The lives used in this valuation were determined as follows:
- Using the base useful life in NZIAVDG and knowledge of Council's assets and their performance, a set of “Lives" for the various asset types was determined.
- There are particular assets that are older than the applicable life but are still in use. For these assets a minimum remaining life is applied. The minimum remaining life for pipelines and civil assets is 3 years beyond the asset's actual life and for mechanical and electrical assets is 2 years beyond the asset's actual life. This is the life used for the valuation of this particular asset.
- Generally lives were taken from the mid-range of the typical lives indicated in the Valuation Manual where no better knowledge is available.
The tables presenting an overview of the standard asset lives used by Councils for the 5Waters facilities and network assets can be found in the valuation report titled “5Waters Valuation Report – September 2014".
7.5.8 Data Confidence
A significant effort has been made to improve data confidence. The confidence level for base data used for the valuation has been assessed as detailed in the tables below. This is based on the Water New Zealand guidelines for Infrastructure Asset Grading Standards, shown in Table 7‑5.
Table 7‑5 Data Confidence Gradings
A
|
Highly Reliable Data based on sound records, documented property and recognised as the best method of assessment
| 5-10%
|
B
|
Reliable
Large portion of data based on sound records documented properly but has minor shortcomings such as old data, some missing documentation and reliance placed on unconfirmed reports and extrapolations.
| 10-15%
|
C
|
Uncertain Significant data incomplete, unsupported or extrapolated from a limited sample. | 15-25%
|
D
|
Very Uncertain Data based on unconfirmed verbal reports, cursory inspection and judgement of an experienced person. | 25-40%
|
The data confidence is rated by asset class in Table 7‑6 below. Based on the quality of the information provided, the valuation has an overall confidence rating of B (i.e. 10 - 15%) for the 2019 values.
Table 7‑6 Data Confidence By Asset Class
Land Drainage
| Linear
| A
| B
| B
| B
| A
| B
|
Plant & Equipment
| A
| C
| B
| B
| B
| B
|
Consents
| A
| A
| B
| B
| A
| B
|
Sewer
| Linear
| A
| A
| B
| B
| A
| B
|
Plant & Equipment
| A
| B
| B
| B
| B
| B
|
Consents
| A
| A
| B
| B
| A
| B
|
Stormwater
| Linear
| A
| B
| B
| B
| B
| B
|
Plant & Equipment
| A
| B
| B
| B
| B
| B
|
Consents
| A
| A
| B
| B
| A
| B
|
Water Races
| Linear
| A
| B
| B
| B
| A
| B
|
Plant & Equipment
| A
| C
| B
| B
| B
| B
|
Consents
| A | A
| B
| B
| A
| B
|
Water Supply
| Linear
| A | A
| B
| B
| A
| B
|
Plant & Equipment
| A | B
| B
| B
| B
| B
|
Consents
| A
| A
| B
| B
| A
| B
|
7.6 Complying with Environmental Management Requirements
There are mandatory environmental standards set by Environment Canterbury which the Council adheres to. This legislation is outlined in detail in Section 2: Strategies, Objectives and Legislation. Achieving good environmental practise within the Council's asset management processes requires robust resource consents compliance and monitoring procedures.
7.6.1 Resource Consents, Compliance and Monitoring
It is important that Council manages its share of the District's natural water resources responsibly. Resource consents are held for the various activities relating to the 5Waters activities such as abstraction and disposal. These consents have conditions to ensure the resources are managed sustainably.
7.6.1.1 Planning for Consent Expiry
Figure 7‑26 identifies water resource consents which are due to expire in the future. Two consents expire in the three year LTP period. From 2025, a significant number of consents will expire, as shown in Figure 7‑26 below. While this is a matter for future plans to recognise and track, an assessment has been included in the Risk Management analysis (Section 9.2).
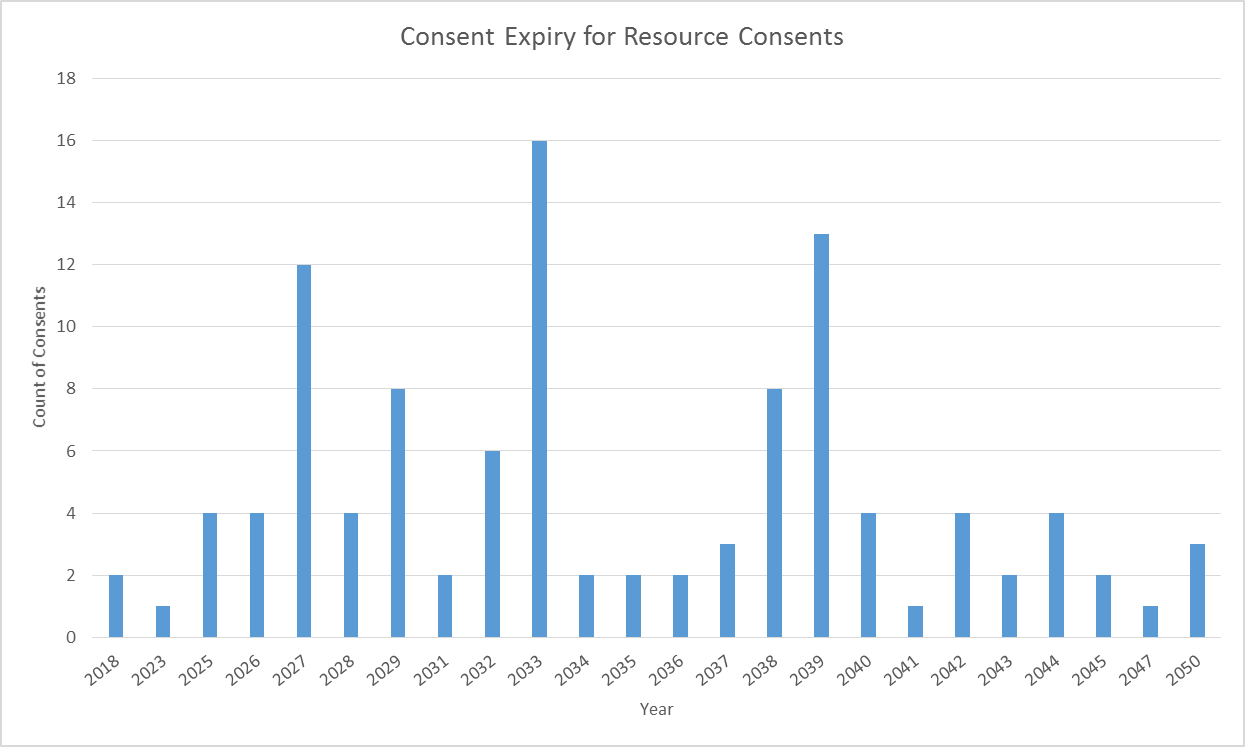
Figure 7‑26 Consent Expiry Dates for 5Waters Resource Consents
The consents currently held will, for the majority of schemes, allow long term security of water resource requirements. ECan has the power to vary consent conditions on an annual basis, but to date has given no such indication.
7.6.1.2 Consent Reporting
Consent reporting within the Council for 5Waters is the responsibility of the Water Services Service Delivery group. Information for wastewater consenting is prepared on a monthly basis for monthly environmental reporting to Environment Canterbury. Reporting on water supplies and water race resource consents is reported to Environment Canterbury through the AMS system. The data is pulled into the AMS System from the SCADA system. In 2018 with the further development of the resource consents database in AMS this will enable more structured reporting of resource consents (Refer to Section 0 and 0).
7.7 Operations and Maintenance Plan
The maintenance strategies for Council are based around the development and implementation of practices that minimise the risks of asset failure and ensure that failed assets are restored with minimal disruption to levels of service and compliance. There are three categories of maintenance:
- Reactive Maintenance - corrective work carried out in response to customer queries, stakeholder demands, and reported problems and defects with the supply / treatment systems and their associated networks.
- Scheduled Maintenance - includes the routine inspection and/or regular maintenance of selected assets.
- Instructed Maintenance – additional maintenance, capital works and replacement (renewal) of assets.
Council has a legal obligation to protect its customers, its infrastructure and the welfare of its employees and service providers. In order to minimise the risk of failing to deliver its levels of service or achieve legal compliance, the on-going operation and maintenance of the 5Waters services requires planning, skills, and resources as well as adequate funding.
7.7.1 Management Strategies and Practices
The well-developed operational practices used by Council and its maintenance contractors are targeted at ensuring continuous asset performance and optimising the cost of service delivery. Poor operational practices have both immediate and long term impact on maintenance costs (physical and material resources), health and well-being.
The management strategies that are used are detailed below along with their effectiveness within the 5Waters.
Table 7‑8 Operation and Maintenance Strategies
Maintenance
|
Scheduled Maintenance
| Scheduled maintenance includes the routine inspection and/or regular maintenance of selected assets. | Scheduled maintenance is required to ensure continued and effective operation of critical Council assets. Examples of these tasks are pump inspections, calibration of UVT and turbidity meters and facility checks (timing of which is subject to the criticality of the asset). | Intermediate
|
| Performance outcomes and indicators | Measurement of actual performance against level of service indicators | Measurement of actual performance against KPI in maintenance contract that are linked to LoS | Intermediate |
| 24/7 Operation | Operation of the infrastructure 24 hours a day, seven days a week | The Council maintenance contract requires operation of the infrastructure 24 hours a day, seven days a week | Comprehensive
|
| Scheduled checks | Routine checks of facilities and network based on the assets criticality | The Council maintenance contract defines the period between scheduled checks subject to the criticality of that asset or facility. | Comprehensive |
| Reactive Maintenance | Reactive work is defined as corrective work carried out in response to customer queries, stakeholder demands, and reported problems and defects with the supply / treatment systems and their associated networks. | There are two types of tasks, SDC initiated work and Contractor initiated. Both are raised within Asset Management Information System (AMIS). Generally SDC initiated task include responding to asset failures and external customer complaints with the objective of identifying problems and restoring service in accordance with the required Contract response times and by the methods provided in the Contract. Contractor initiated works are a means to raise observations in the field, either through reactive or scheduled work, for further attention. If the cost of work is under $500 or if the work is urgent and presents an imminent threat to health and safety or environmental impact, then works can proceed without approval. For all other tasks approval from SDC is required prior to undertaking the work. | Core |
| Redesign and Modification | Redesign may be necessary if an asset or system does not meet its operational objective. Similarly, modifications may be necessary to improve the operating characteristics | Redesign and modifications are undertaken in a methodical manner. Alternative options with both short and long term needs are assessed, and decisions made on those drivers. | Comprehensive |
Operations
|
| Physical Works Monitoring | Contractors audits are carried out on a subset of completed works | Service delivery audits work (a representative sample) carried out by contractor to verify compliance with standards and guidelines, these are still appropriate and fair payment has been made. | Intermediate |
| Health and Safety Checks | | Checks undertaken randomly to ensure all work completed by Council and Contractor staff complies with regulations | Intermediate |
| Operation of Utilities | Networks and facilities are operated on defined parameters and standards set out Standard operating procedures | Water Supply utilities will be operated inline with Standard Operating Procedures (SOP's). Quality systems manuals will be developed or updated for high criticality assets and services | Intermediate |
| Leak Detection | To proactively detect and repair leaks within the water supply | Well considered water demand reduction strategies | Core |
| Infiltration management | Minimise infiltration into wastewater will extent the time for service capacity to be exceeded and minimise operational costs | | Core |
| Pressure and Flow Monitoring | Pressure and Flow Monitoring carried out in a defined and planned manner | Pressure and flow monitoring is carried out by Council staff to measure compliance with Levels of Service, to calibrate network models and to plan the development of new infrastructure | Intermediate |
| Energy Efficiency | Proactive energy management | Energy savings and management is carried out in a logical and planned manner for the facilities in a period in history where energy costs and availability are of high priority | Core |
| Service Interruptions | Service Interruptions within LoS requirements | All shutdowns or interruptions to service managed by the Maintenance Contractor to protect the quality of the water, the asset, and the service to the customer with the use of Standard Operating procedures and monitored by Key Performance Indicators | Comprehensive |
| Flow meter calibrations | Facilities flow meters are managed through the Installation, Calibrations and Maintenance process | Council Flow Meter Standard Operating Procedure encompasses water, wastewater and water race main flow meters, usually located at pump stations, treatment plants or other facilities. It does not involve individual property meters. The flow meter procedure details: - Importance of Flow Data
- Reasons for Measuring Flow and the accuracy requirements
- Methodology for meter accuracy compliance (calibration)
- Installation compliance to manufacturers requirements
- Output testing from meters
- Reporting requirements by Service delivery
| Intermediate |
| Area Water meters | Use of area water meters to gain greater understanding of water usage within specific areas of a community | There a number of zone meters within the communities of: - Rolleston, Lincoln
- Prebbleton and Kirwee
- Malvern Hills and Selwyn Rural
The data obtained via data loggers is used for estimating leakage rates
| Intermediate |
| Incident management | Council manages the escalation of minor to major incidents | Council has a structured approach in escalation of minor to major incidents: - Minor incidents are managed by the contractor
- Medium issues are managed by the contractor in conjunction with Service delivery
- Major issues are managed by the contractor in conjunction with service delivery and asset management staff
Involvement is also gauged against the potential consequences or asset criticality. Standard Operating Procedures have been written and are used to assist in incident management i.e. wastewater overflows, water quality transgressions
| Comprehensive |
| System Control and Monitoring | Appropriate level of surveillance for networks and facilities based on criticality | The councils SCADA system provides surveillance of a significant range of facilities and networks and provides: - Alarms when equipment fails or when operating parameters are exceeded
- increase the knowledge of the asset operation therefore enabling efficiencies to be introduced
- All essential data retained for trending etc
| Comprehensive |
Customer Service
|
| Complaints process | Customer Service requests and complaints are integrated for all services and 24 hour complaints process to enable the achievement of LoS and maintenance contract requirements | All complaints and enquiries for matters relating to the 5Waters can be directed to Service Delivery centre/help desks –by telephone r eomail
| Intermediate |
| Complaints monitoring | Compliance with the appropriate response and timing | Monitoring all tasks on a continuous basis via AMS to show noncompliance and trending | Core |
7.7.2 Informing and Education of Users
In the past, informing and educating users of their responsibilities has been carried out by the scheme committees. The focus has been on the details of scheme operation “an operator's requirement" but should be redirected.
With a continued high growth rate, a move to improve public health and relatively high property turnover, and a central externally hosted customer call centre the need for frontline ratepayer education is required. The emphasis will be on advising:
- Broader level scheme purpose, policies / Bylaw and contact point arrangements; and
- Demand management and water conservations approaches and target.
7.7.3 Operations and Maintenance Plans Standards, Procedures and Manuals
Council has undertaken development of Operation and Maintenance summary (O&M summary) for each scheme and/or facility. The O&M summary provides an overview of the key factors affecting performance of a system or facility, operational triggers, maintenance requirements and specific control philosophy. In addition the Council have undertaken a review and update of the scheme process drawings.
To maintain the appropriate level of service the operations and maintenance manuals should thoroughly cover the following:
- Full integration with Levels of Service, Activity Management Plans and Maintenance Contracts
- Contain the major elements of Risk Plans (including WSPs), Demand requirements, Renewals, Standards & Policies, Health and Safety, Environmental and Operational Plans
- Be updated on an on-going basis (minimum of every three years) with input from a representative group of customers
- Fully accessible to both Council officers and maintenance contractors (electronic controlled copies)
Council has undertaken development of Operations Manuals in 2015. Further work is required to integrate the AcMP, operations manual and AMS data to update these documents. A comprehensive Water Race Management Plan is fully operational and reviewed on an annual basis. This manual is an intricate part of the maintenance contract.
7.7.4 Inspection & Maintenance Programme
The Operation and Maintenance (O&M) of Council's water, wastewater and stormwater systems is controlled and undertaken in accordance with the Utilities Operation & Maintenance Contract, C1241. The works undertaken under the contract are scheduled, recorded and audited by using Councils AMS system. A high degree of confidence exists that the works are carried out to the appropriate standard and at the appropriate intervals.
The Council O&M management approach and life cycle strategies are detailed in 5.0 Levels of Service and 7.0 Lifecycle Management.
7.7.5 Operations and Maintenance Service Delivery
Council, at its meeting of 22 June 2016, approved acceptance of “C1241 Water Services Network Management Contract" from Sicon Ltd for a five-year period 01 July 2016 to 30 June 2021.
The intent of the Contract is to form a close working relationship between the Contractor and the Selwyn District Council to provide water services and achieve or exceed the expectations of the customers.
The key objective for all of the services (water, wastewater, stormwater and water races) is to provide our customers with the level of service they expect whilst complying with relevant standards and legislative requirements, protecting public health and safety, ensuring minimal impact on the environment and maintaining an acceptable financial cost. In addition to ensuring effective delivery of today's service, we also need to be planning to meet future service requirements and securing our ability to deliver appropriate services to future generations.
7.8 Renewal Replacement Plan
Renewal is defined as an activity which renews, restores, rehabilitates or replaces an existing asset to extend its economic life or service potential. Renewal does not increase the design capacity of the asset. This is an important difference. In a growth district such as Selwyn, assets are sometimes 'failing' due to reaching their performance e.g. pipes too small to carry any more water rather than due to 'old age' e.g. corrosion.
Council has placed considerable additional focus on identifying the remaining useful life of a component. These key activities and advances that have fed into determining renewals are summarised as follows:
- Significant improvement in quality of core asset data available for renewals planning;
- Introduction of AMS platform for data storage, management, reporting and interrogation, with improved GIS interfacing;
- Commencement of maintenance data capture in AMS to build history and allow for future enhancement of renewals planning;
- Development of hydraulic models for the major urban water and wastewater schemes that have allowed hydraulic performance to be evaluated and included in future renewals planning; and
- Additional analysis of AC condition assessment reports completed over last 10 years to provide a clearer picture of pipe deterioration rates, condition and renewal requirements.
This section describes the processes that Council use to identify and optimise renewals.
7.8.1 Renewal Strategy
The renewal profile is generated by the AMS system for 120 years for all assets (currently In-Service and For-Future-Service) within the valuation period that are owned by the Council. Those assets that are due to expire or have expired but are still being utilised are given an extended life of 5 years. The renewal profile is based on an assets expiry date and valuation.
There are two key factors that have not been incorporated within the renewal profile at this stage are:
- Criticality; and
- Condition assessment.
A criticality model was developed by the Council in 2014. Criticality should drive the renewal decision making process. Criticality or the consequence of failure is a practical assessment of the economic, social, cultural and environmental drivers related to asset components. Section 7.4 details the process that Council applied for assessing criticality. Critical assets will be identified earlier for renewal, prompting specific investigation and confirmation of renewal requirement. The majority of 5Waters asset components have been allocated criticality levels – High, Medium-High, Medium, Medium-Low and Low.
A condition assessment model has been developed by Council in 2017. Condition assessments should also drive the renewal decision making process. Section 7.3 details the process that Council applied for assessing condition. Failing assets will be identified earlier for renewal, prompting specific investigation and confirmation of the renewal requirement. All 5Waters pipes have been allocated a condition rating.
The renewals profile will be refined to incorporate consideration of criticality in decision making and utilise asset maintenance history, condition and performance knowledge for key asset classes (e.g. AC pipes).
In 2017 spatial mapping was used to develop a renewals map in GIS which has multiple layers. This map:
- Colours the asset due for renewal in five year bands;
- Colours the assets depend on their criticality category; and
- Colours the number of pipe faults in bands.
Spatial mapping has also been used to develop a 30 year project map for 5Waters and Roading projects. This map shows where future capital works are for 5 Waters and where the roading upgrades will take place. In terms of renewals this map is helpful because it can be used to determine whether any renewals are able to be moved forward in line with these works.
The renewal process used is shown below in Figure 7‑27.
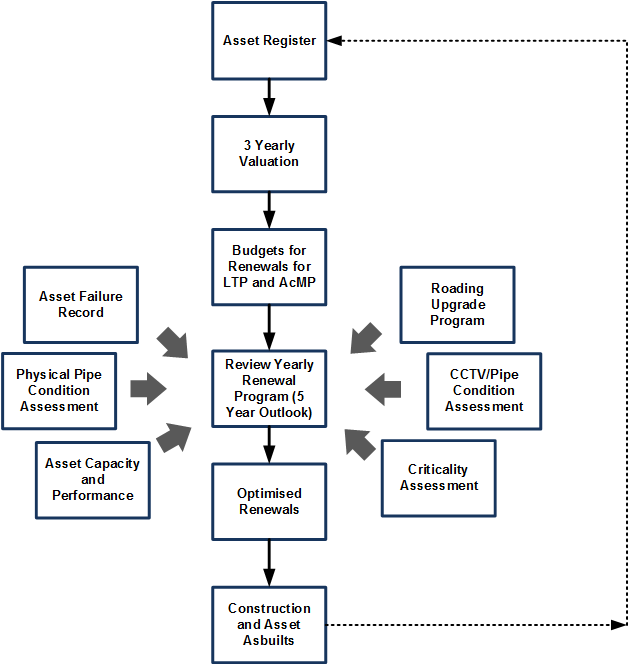
Figure 7‑27 Renewal Process Diagram
7.8.1.1 Water Races
The vast majority of the water race systems are open channels. Because these are proactively maintained the extent of renewals is low compared to the extent and age of the schemes. In fact, Council consider that because of obsolescence the asset disposal of water races as a whole is more likely to occur than the failure of individual components. However, where renewals are required typically these have been assessed on a year by year basis. Prior to 2010 water race renewals have been often deferred due to uncertainties such as the proposed closure of particular schemes and the likelihood of water take constraints being imposed through resource consents and significantly affecting the on-going operation of the existing assets.
The ability to assess renewals has historically been restricted due to a lack of asset register information about the water races. This is being resolved via additional data being obtained on critical assets.
The renewal of water race tunnels and other significant structures are not funded. The remaining useful life of these assets will be reviewed.
7.8.1.2 Land Drainage
The majority of the Land Drainage scheme assets (by volume) are open channels. Historically land drainage renewal requirements have been assessed on a year by year basis or as assets fail. Consideration of renewals is normally carried out by the individual Land Drainage Committee in consultation with Council prior to the Annual Plan process.
7.8.2 Renewal Forecast
The renewals forecasts have been completed for a 120 year horizon. Renewals are funded across a 30 year period and these have been included in the renewal sections for each scheme (Volume 2,3,4,5 and 6). A summary of renewals for each 5water activity is shown in the following graphs.
Figure 7‑28 Renewal Profile for Water Supply 2018/19 – 2047/48
Figure 7‑29 Renewal Profile for Wastewater 2018/19 – 2047/48
Figure 7‑30 Renewal Profile for Stormwater 2018/19 – 2047/48
Figure 7‑31 Renewal Profile for Land Drainage 2018/19 – 2047/48
Figure 7‑32 Renewal Profile for Water Races 2018/19 – 2047/48
7.8.3 Deferred renewals
In some cases a decision is made to defer a required renewal because of:
- Asset life has exceeded the estimated life (remaining asset life is then revised);
- The cost is considered beyond the community's ability to fund and an alternative option is available;
- A proposed capital upgrade waiting in the wings; and
- A proposed disposal of that asset.
When renewal work is deferred there is an impact on the system's ability to achieve the required level of service standards e.g. ability to achieve reduces and this can cause increases in operating and maintenance risks and costs. A decision to defer is therefore made carefully in consultation with the community.
An example of a deferred renewal is the Kowhai Tunnel in the Malvern Water Race Scheme. The renewal of the tunnel is not shown in the renewal profile (Figure 7‑32)*. A project of $500,000 for remedial works to the tunnel has been completed which enabled the renewal of the tunnel itself to be pushed out a number of years.
*The renewal of the tunnel has been excluded in all tables and figures within this AcMP unless noted otherwise.
7.9 Asset Acquisition and Development Plan
Asset creation means the provision of or improvement to an asset where the outlay can reasonably be expected to provide benefits beyond the year of outlay. The main reason for creating an asset is to satisfy or improve the level of service, provide for new demand or to provide a commercial return.
While the creation of assets through subdivision development is paid by the developer, works with associated the creation of Council assets is funded via loans or rates and is subject to the LTP and Annual Plan process.
The 30 year capital works programme is detailed in Section 11.0, inline with growth projections which are detailed in Section 6.0.
7.9.1 Councils Holding Capacity (Policy T103)
Councils holding capacity is the dollar value or number of connections between what capacity is required to service the current population and what is being 'held' to service the future population. The Council, in making this decision to have holding capacity in a scheme, has to fund this cost until property owners, who create growth, repay it. Such a decision involves the Council now owning an asset in infrastructure as opposed to having money in the bank. Although this decision is effectively swapping one asset 'cash' for another asset 'infrastructure', cash earns interest.
7.9.2 New or vested assets
The Council receives assets that are vested in it, but there has been no direct exchange of funds. In the case of infrastructural assets, the value of exchange is deemed to be at the current valuation at the time of issue of the 224 Certificate. For all donated and subsidised assets, the initial value recorded is the current valuation value at the date of acquisition.
7.10 Asset Disposal Plan
All pipeline renewals have a corresponding disposal either through the pipes being removed and disposed of at the landfill, or being left in the ground if the infrastructure is renewed using 'no-dig' techniques. Similarly, replacement of components at treatment plants and pumping stations usually involves disposal of those items being renewed /upgraded.
Disposals Strategy
In all cases asset disposal processes must comply with Council's legal obligations under the Local Government Act 2002, which covers:
- Public notification procedures required prior to sale;
- Restrictions on the minimum value recovered; and
- Use of revenue received from asset disposal.
When considering disposal options all relevant costs of disposal must be considered including:
- Evaluation of options;
- Consultation/advertising;
- Obtaining resource consents;
- Professional service, including engineering, planning and legal survey;
- Demolition/making safe;
- Site clearing, decontamination and beautification; and
- Buried assets remain in the ground unless economic to remove or they pose a potential hazard.
The use of revenue arising from the sale of any assets shall be decided by Council at the time of its consideration of disposal.
7.11 Lifecycle Funding - Renewals
It is critical that equity of funding for renewals between current and future (intergenerational) users occurs. While it is possible that some original scheme members will stay for 20 or more years having contributed to both the original capital costs and 20 years renewals, this will only account for the lower cost, high wear and tear items renewals. Pipes, reservoirs, wells and the like have comparatively higher costs and would be renewal funded intergenerationally e.g. 50-100 years away.
Council accepted in 2009 that predicted 30 year forward renewal costs would be funded for each activity via rates. This has the advantage of allowing for actual renewals costs moving several years sooner or later than predicted with the total 30 year cost to be funded in annual 1/30th contributions.
Annual amounts are held in an interest-bearing special fund. Funds are held against each activity account, and rated at a level to recover all renewals works identified.
The closer a scheme gets to large infrastructure renewals the more it should focus on confirming the remaining useful life. Criticality (renewal strategy) assessment is the cornerstone of this programme. The renewal value charged is reviewed on a 3 yearly basis at the time of 5Waters asset revaluation.
To calculate the 2021-31 annual contribution Council has calculated the average of the renewals programme without inflation, and then added inflation to this amount each year. This gives a rising renewal amount each year and will fund the forecast 30 year renewal programme over 30 years. The three yearly reviews will mean that the renewals funding will tend to increase over time as some of the higher cost longer life assets constructed in the past 20 years start to fall within the 30 year period.
Further details regarding renewals are provided in Section 11.0.
7.12 Improvement Planning
Throughout this section a number of specific actions to improve the way in which the Council identifies and manages lifecycle management associated with the 5Waters activity. These actions are summarised below in Table 7‑9.
Table 7‑9 AM Improvement Items – Lifecycle Management
7.2
| Use Water and Wastewater model outputs to create a spatial view of asset performance
| High
| 2018/19
|
| 7.2 | Improve the asset condition model by implementing a process to include new CCTV information | High | 2019/20 |
| 7.3 | Extend the asset condition model to incorporate all asset types | Medium | 2020/21 |
| 7.4 | Improve the asset criticality model by refining the criticality bands and making it automatically update within the AMS system. | High | 2020/21 |
| 7.4 | Further refine and improve the Asset Valuation module by making some of processes more automated | High | 2020/21 |
| 7.6.1 | Resource consent information and reporting to be provided through AMS (recognised more appropriately as an improvement item in Section 10) | High | 2018/19 |
| 7.8 | Improve the renewal model to include criticality and condition modelling of assets, and address the legacy of renewals. | High | 2018/19 |
View citations
<<
5-Waters Volume 1


