<<
5-Waters Volume 2 - Water Supplies
23 Springston Water Supply
23.1 Scheme Summary
| Estimated Population Served | 549
|
Scheme Coverage (1 Jan 2021)
| Full Charges | 188
|
| Half Charges | 0
|
| >1 Charges | 1
|
System Components
| Bores/Intakes (No.) | 1 Bore
|
| Treatment/Disinfection | 1
|
Reservoirs (No.)
| 3
|
| Pump Stations (No.) | 1
|
| Piped (m) | 7,071
|
| History | Original scheme installation date | 1969 |
Value ($)
| Replacement Cost | $1,229,603
|
| Depreciated Replacement Cost | $693,130
|
| Financial | Operator cost (scheduled and reactive maintenance) per connection
| $325.11/connection
|
Demand (m3) (1 Jan – 31 Dec 2020)
| Average daily | 162
|
| Peak daily | 457
|
| Minimum daily | -
|
| Average daily per connection | 0.81
|
| Type of Supply |
| High pressure and unrestricted |
Target Pressure & Flow at boundary
| Pressure | >350kPa
|
| Flow | >15L/min |
| Sustainability | Well Security | Secure |
23.2 Key Issues
The following key issues are associated with the Springston water supply. A list of district wide issues are located in 5Waters Activity Management Plan: Volume 1.
Table 23-1 Springston Scheme Issues
Catchment management
| To encompass a holistic view of the drinking water supply, improved liaison with ECan and study of ground water quality within the water supply protection zones are being investigated.
|
Bore pump failure
| As there is no supply redundancy for this network, a preventive maintenance programme for submersible pumps will be developed and implemented.
|
Emergency chlorination
| To allow on-demand chlorination as a result of a treatment or storage transgression or contamination event, provision for emergency chlorination is currently being planned for the scheme.
|
23.3 Overview & History
The Springston Water Supply provides untreated groundwater to the Springston community located approximately 5kms west of Lincoln. Properties within the township originally obtained their domestic water from shallow bores until contamination of the groundwater presumably by septic tanks necessitated installation of a community water supply in 1969. The Springston scheme was designed as an unrestricted supply complying with the NZ Fire Fighting Code of Practice.
In 2005 the pump station was upgraded in order to supply three new subdivisions, and the water tower was removed.
A new deep (>100m) bore was brought into service in 2008 to address water quality issues. The old well, also at Mather Place has been decommissioned.
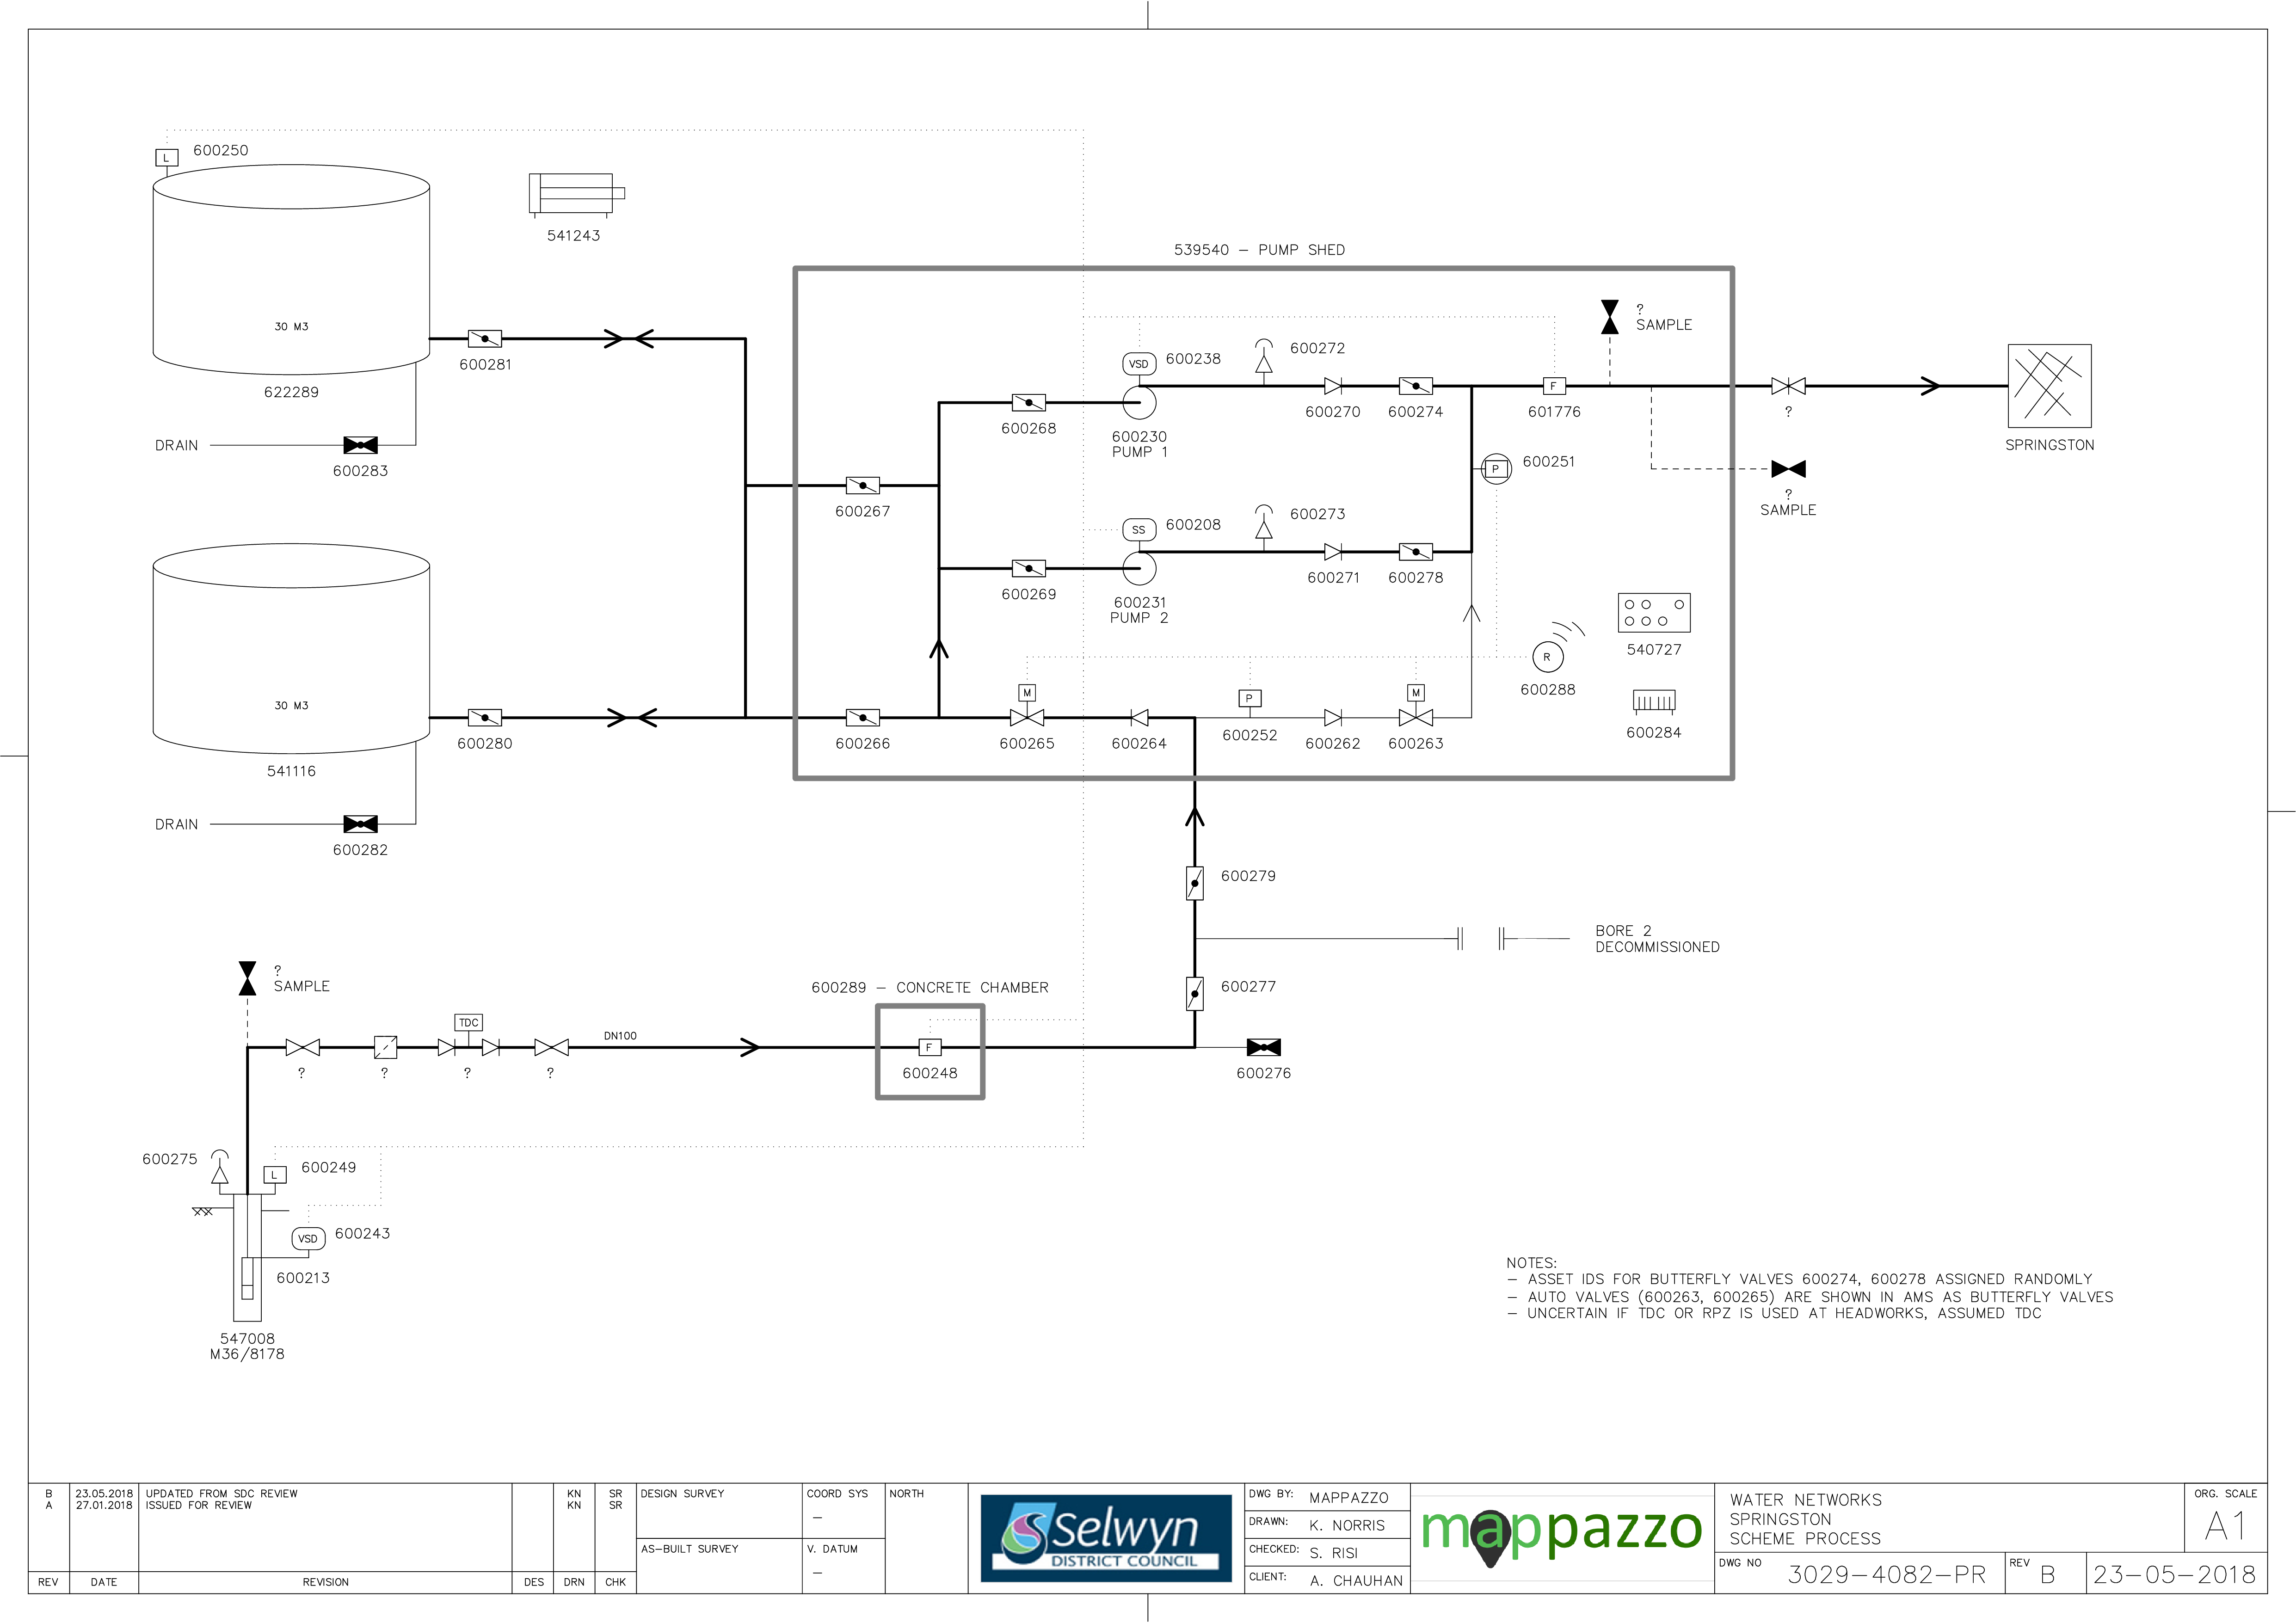
Figure 23‑2 Scheme Schematic
23.4 System Capacity
There is adequate supply capacity to meet current and projected demands for this community.
Table 23‑2 Capacity Summary
| Abstraction Capacity | 16.7 | 1443 | - | One bore pump |
| Consented Take | 15 | 900 | 135,000 * | CRC010895.1 |
| Peak Demand | 17.3 ** | 843 ** | 78,300 | |
* inferred value, **Jan 2015
23.5 Resource Consents
The Springston water supply has a number of resource consents.
Table 23‑3 Resource Consents
CRC010895.1
| To take and use groundwater. | Ellesmere Junction Road, SPRINGSTON | 4-Dec-08 | 31-Jan-35 | 15 | 900 |
23.6 Water Quality
The Springston water supply is a secure source and is currently sampled twice weekly at the treatment plant and weekly in the reticulation zone.
The following details E. coli transgressions for the period 2012 to 2020.
Treatment
There have been no E. coli treatment transgressions during this period.
Zone
There have been two E. coli transgressions during this period, these occurred in March 2015 and June 2016.
Chemical Analysis
The following is a summary of the raw water chemical analysis carried out at the Springston Water Supply.
Table 23‑4 Springston Water Raw Water Chemical Analysis Summary
| Total Lead (g/m3) | 0.01 (Maximum Acceptable Value)
| <0.00010
| <0.00011
| 0.00068
| <0.00011
| <0.00011 | <0.00011
| <0.00011
| ✓
|
| pH (pH units) | 7-8.5 (Guideline Value)
| 7.8
| 7.8
| 7.7 | 7.9 | 7.8 | 7.7
| 7.8
| ✓
|
| Total Hardness (g/m3 as CaCO3) | <200 (Guideline Value)
| 45
| 52
| 51
| 50
| 48.9
| 49.5
| 48.7
| ✓
|
| Total Calcium (g/m3) | n/v | 15
| 17.5
| 17
| 16.6
| 16.37 | 16.72
| 16.22
| ✓ |
| Total Iron (g/m3) | <0.2 (Guideline Value)
| <0.02
| <0.021
| <0.021
| <0.021 | <0.021 | <0.021
| <0.021
| ✓ |
| Total Sodium (g/m3) | <200 (Guideline Value)
| 8
| 8.9
| 8.9
| 9.3
| 8.68
| 8.62
| 9.00
| ✓ |
| Nitrate - Nitrogen (g/m3) | 11.3 (Maximum Acceptable Value)
| 1.3
| 1.46
| 1.51
| 1.61
| 1.72
| 1.71
| 1.80
| ✓
|
23.7 Scheme Assets
A summary of material and diameter for pipes in Springston is shown below in Figure 23‑3 and Figure 23‑4.
Figure 23‑3 Pipe Material – Springston
Figure 23‑4 Pipe Diameter – Springston
23.8 Operational Management
The water supply is operated and maintained under two maintenance contracts as follows:
- Contract 1241: Water Services Contract. Contract is with SICON who undertakes investigations, conditions inspections, proactive and reactive maintenance and minor asset renewals; and
- Contract 1202: Parks and Reserves Contract. Contract is with SICON who undertakes the maintenance of land scape features related to water services e.g. mowing, gardens etc.
Water quality sampling is completed under an agreement with Food and Health Ltd as required.
23.9 Photos of Main Assets
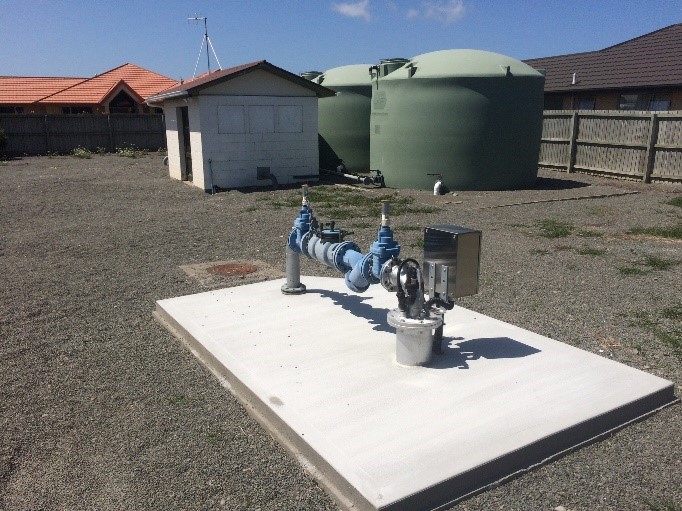
Photo 1: Bore headworks and reservoirs
|
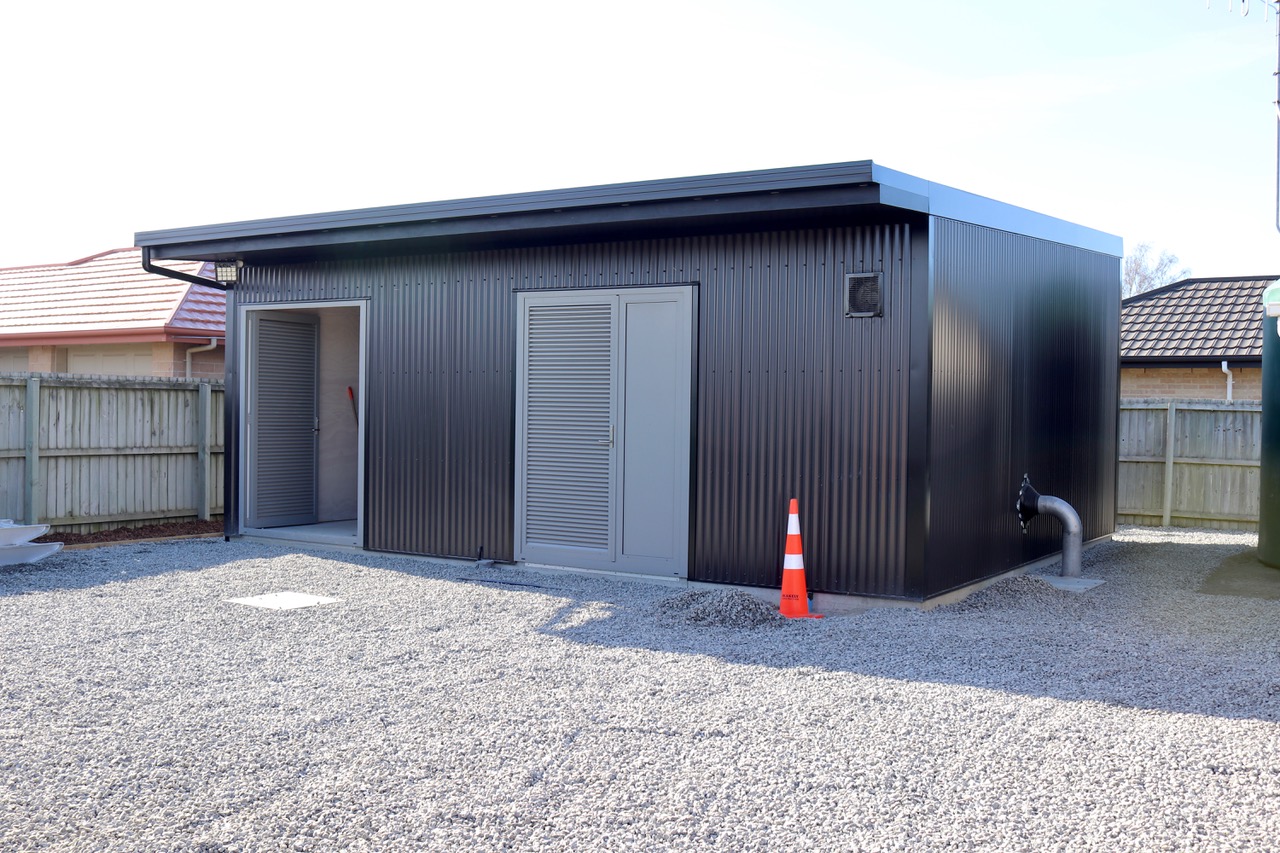 Photo 2: Pump Shed
|
23.10 Risk Assessment
A risk assessment has been undertaken for the Springston scheme. The key output from the risk assessment is the identification of any extreme and high risks which need to be mitigated. In order to mitigate these risks they have been included and budgeted for in the projects within this LTP. Table 23‑5 details the risk priority rating, Table 23‑6 outlines the risks and the list of key projects is found in Table 23‑11.
Table 23‑5 Risk Priority Rating
| > 50 | Extreme | Awareness of the event to be reported to Council. Urgent action to eliminate / mitigate / manage the risk. Document risk and action in the AMP. |
| 35-50 | Very High | Risk to be eliminated / mitigated / managed through normal business planning processes with responsibility assigned. |
| 14-35 | High | Manage risk using routine procedures. |
| 3.5-14 | Moderate | Monitor the risk. |
< 3.5
| Low | Awareness of the event to be reported to Council. Immediate action required to eliminate / mitigate / manage the risk. Document risk and action in the AMP. |
Table 23‑6 Risks – Springston
| Noisy pump shed | Look at means to reduce noise volumes | 2014 | 4 | 4 | 4 |
| Electrical failure due to lightning or network spikes | Install surge diverters | 2014
| 10 | 10 | 10 |
| Failure to meet NES water meter standards | NES Water Meter Compliance | 2014 | 20 | 6 | 6 |
| Inability to collect income from non-metered properties | Install property water meters | 2014 | 27 | 0.6 | 0.6 |
| Non-compliance with the DWSNZ | DWSNZ - Age Testing | 2014 | 10 | 0.7 | 0.7 |
| Non-compliance with the DWSNZ | DWSNZ - Bore-head security | 2014 | 10 | 10 | 10 |
| Non-consented activities | Renewal of consents | 2014 | 27 | 27 | 6 |
| Scheme efficienty / redundancy | Join Springfield to Lincoln or Rolleston | 2017 | | 2 | 0.7 |
The list of district wide risks can be found in 5Waters Activity Management Plan: Volume 1.
23.11 Asset Valuation Details
The total replacement value of assets within the Springston water scheme is $1,229,603 with further details in Table 23‑7 below.
Table 23‑7 Replacement Value, Springston
|
Plant and Equipment | $351,816
|
Water Reticulation
| Hydrant | $30,447
|
| Lateral | $90,289
|
| Pipe | $571,850
|
| Supply Point | $150,000
|
| Valve | $35,199
|
23.12 Renewals
The renewal profile has been taken from the 2019 5 Waters Valuation. A graph showing the renewals for this scheme are shown by Figure 23‑5 below. The majority of renewals are due now.
Figure 23‑5 Springston Water Renewal Profile
23.13 Critical Assets
The criticality model for Springston has been updated for the 2021 AcMP. The methodology of the criticality model can be found in 5Waters Activity Management Plan: Volume 1 and it provides details of how the criticality has been calculated for the reticulation assets. Table 23‑8 and Figure 23‑6 below shows the calculated criticality for all of the assets within this scheme that have a recorded known length.
Table 23‑8 Length of Assets per Criticality Level
5
| Low | 4,207
|
4
| Medium-Low | 1,654
|
3
| Medium | 1,231
|
2
| Medium-High | 154
|
1
| High | 0 |
23.14 Asset Condition
The asset condition model was run for Springston in 2021. The methodology of the model can be found in 5Waters Activity Management Plan: Volume 1 which provides details of how the model has been calculated for the pipe reticulation assets. Figure 23‑7 below shows the level of asset condition for these assets within this scheme that have a recorded known condition.
Table 23‑9 provides a description of the condition rating used within the condition model.
Table 23‑9 Asset Condition Grading
| 1.0 | Excellent |
| 2.0 | Good |
| 3.0 | Moderate |
| 4.0 | Poor |
| 5.0+ | Fail |
The number of pipe faults is also measured through the asset management system. Figure 23‑8 shows the known historic pipe failures within this scheme.
23.15 Funding Program
The 10 year budgets are shown by Table 23-10. Budgets are split into expenditure, renewals, projects and capital projects. Expenditure and renewals have been reported on a district-wide basis in Volume 1.
All figures are ($) not adjusted for CPI “inflation". They are calculated on historical data, and population growth where relevant.
Table 23-10 Budget Summary
| 2021/2022 | -
| $20,000
|
2022/2023
| -
| -
|
| 2023/2024 | -
| -
|
| 2024/2025 | -
| $400,000
|
| 2025/2026 | -
| -
|
| 2026/2027 | -
| -
|
| 2027/2028 | -
| - |
2028/2029
| -
| -
|
2029/2030
| -
| -
|
2031/2032
| -
| -
|
| Total | -
| $420,000
|
An explanation of the categories within the budgets are as follows below:
-
Expenditure consists of operation and maintenance costs;
-
Renewals are replacement of assets which are nearing or exceeded their useful life;
-
Projects are investigations, decisions and planning activities which exclude capital works; and
-
Capital projects are activities involving physical works.
Table 23-11 Key Projects
Capital Projects
| -
| Connect to Lincoln/Rolleston/second source
| -
| -
| -
| $400,000
| TBC
|
Capital Projects
| -
| Additional pressure sensors to be added into the network
| $20,000
| -
| -
| -
| 100% LoS
|
* Where LoS refers to Level of Service and G refers to Growth
The list of district wide projects can be found in 5Waters Activity Management Plan: Volume 1.
Discussion on Projects
Projects have been determined based on their:
- Relevance to the scheme
- Requirement to be completed under legislation
- Ability to bring the scheme up to or maintain the Level of Service required under council's Asset Management Policy.
Many projects are jointly funded by more than one scheme and activity. Each scheme pays a pro-rata share only, equivalent to the number of connections.
Discussion on Capital and Projects
Where relevant, Capital (Levels of Service) and Capital (Growth) projects have been included in the scheme financial details.
Levels of Service Projects and growth splits have been provided to ensure the costs of population driven works are clear.
<<
5-Waters Volume 2 - Water Supplies


