Estimated Population Served
| 601
|
Scheme Coverage (1 Jan 2021)
| Full Charges
| 176
|
Half Charges
| 0
|
>1 Charges
| 31
|
System Components
| Bores/Intakes (No.) | 1 Intake
|
| Treatment/Disinfection | Filtration, UV and Chlorination |
| Reservoirs (No.) | 2
|
Pump Stations (No.)
| 1
|
| Piped (m) | 37,184
|
| History | Original scheme installation date | 1985
|
Value ($)
| Replacement Cost | $4,139,463
|
| Depreciated Replacement Cost | $2,838,475
|
| Financial | Operator cost (scheduled and reactive maintenance) per connection
| $496.10/connection
|
Demand (m3) (1 Jan – 31 Dec 2020)
| Average daily
| 457.8
|
| Peak daily | 769.6
|
| Minimum daily | -
|
| Average daily per connection | 2.0
|
| Type of Supply | | High pressure with restricted and unrestricted
|
Target Pressure & Flow at boundary
| Pressure | >310kPa (150kPa restricted) |
| Flow | >20L/min (±10% maric restricted) |
| Sustainability | Well Security | Unsecure
|
22.2 Key Issues
The following key issues are associated with the Springfield water supply. A list of district wide issues are located in 5Waters Activity Management Plan: Volume 1.
Table 22‑1 Springfield Scheme Issues
Springfield requires infrastructure upgrades which
includes treatment plant upgrades. | Council will develop a long term water supply strategy for Springfield and surrounding towns to guide further capital/renewals expenditure on the existing infrastructure. The renewal strategy and treatment plant upgrades will be addressed through the Water Safety Plan. |
| The Springfield well is subject to high turbidity during periods of flood in the Kowai River. | 1 micron filtration is not sufficient at all times and therefore further treatment or an alternative water source is required.
|
Catchment management
| To encompass a holistic view of the drinking water supply improved liaison with ECan and study of ground water quality within the water supply protection zones are being investigated.
|
Pressure zoning
| Pressure zoning will be considered in including additional pressure monitoring in the reticulation network. This is proposed to be part of the developing Target Pressure Plan and Network Management Strategy.
|
Backflow: Due to a moderate number of medium risk commercial connections the scheme is potentially vulnerable to potential backflow issues.
| There is currently a district wide backflow prevention project underway.
|
22.3 Overview & History
The Springfield Water Supply provides chlorinated surface water to the Springfield Township and surrounding areas. The surface water is sourced from a shallow well and gallery located in the Kowai River flood plain adjacent to the Springfield reservoir. The scheme is a high pressure restricted & unrestricted supply.
In the 1980s the Council proposed a water supply that would serve the township and completely replace an old NZ Railway water scheme.
Drilling of two deep wells was carried out adjacent to the township (on Pocock Road) but insufficient water was available and a shallow well and gallery intake was installed adjacent to the Kowai River. This scheme was installed in 1987/88 as an unrestricted supply with full “Fire Fighting" capacity. In 1999 the scheme was extended into the rural area to serve properties with domestic water only, the supply now consists of the following zones:
- Springfield Township – on demand pressure supply
- Kowai Bush extension – fully metered pressure supply
- Annat Extension – restricted to 2m3/day – consumer must supply own tank & pressure system
CPW shared water use agreement
The Council's Long Term Plan 2015-2025 identifies one of the major projects to be the Council's commitment to 'work with Central Plains Water to develop a concept for converting the Kowai River sourced water race network (part of the Malvern Water Race Scheme) into a combined water race and irrigation network. This concept will then be used for further consultation with the community.
The Council entered into agreement with CPW on 16th December 2016. The philosophy of the Agreement is to achieve a mutually beneficial cost neutral position. While the Scheme will benefit from a potential 200l/s of reliable water for irrigation, the added value the Scheme will provide to the community includes providing a robust and secure long term piped water supply to both the Sheffield and Springfield drinking water treatment stations. Which, from a water quality perspective enables the Council to avoid use of shallow groundwater during periods of high turbidity in adjoining rivers, or as required for capacity augmentation; and providing the necessary water quantity to support future township expansion. In addition, a piped stock water supply to shareholders and non-shareholders will ensure this historical network is upgraded to a high quality, efficient utility.
Treatment Plant Upgrade
Prior to the commissioning of the treatment plant upgrade in July/August 2017, the Springfield water supply was chlorinated. The treatment upgrade provided in addition to chlorine, 1 micron (0.001mm) filtration followed by a UV treatment system.
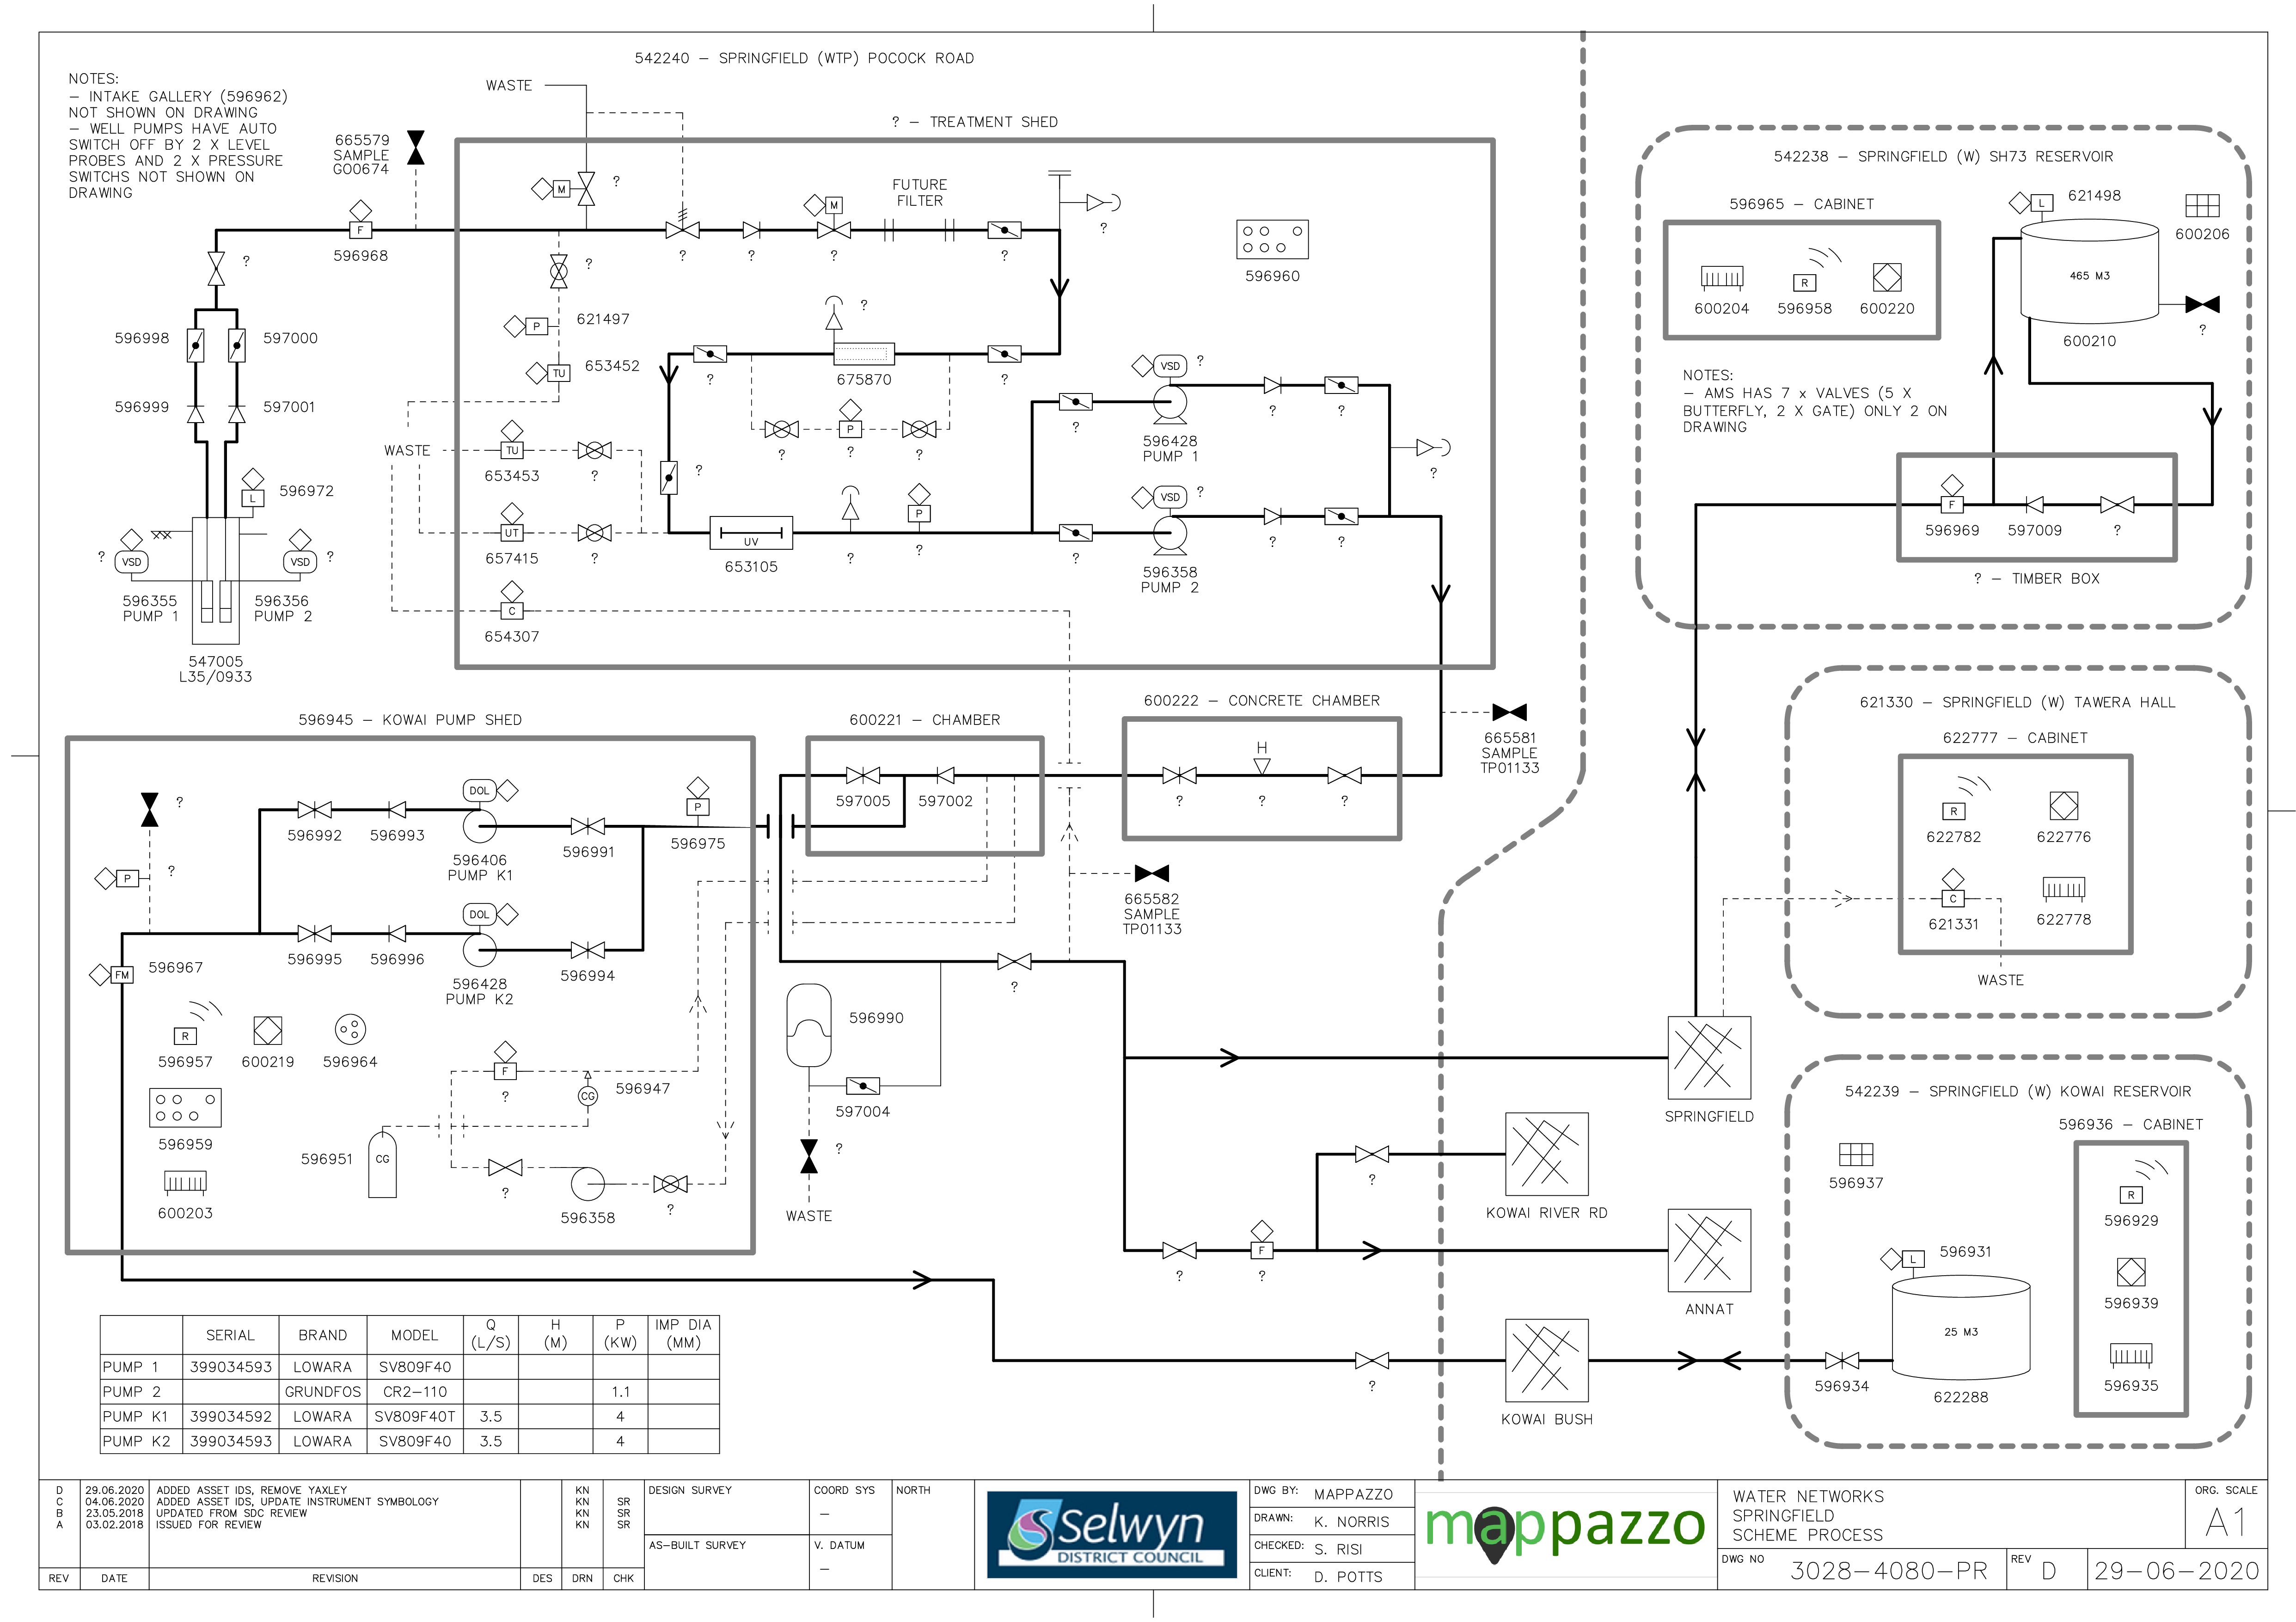
Figure 22‑2 Scheme Schematic
22.4 System Capacity
There is some opportunity for residential development in Springfield in terms of zoned land availability. The Springfield supply also delivers a restricted supply to a small proportion (<10%) of properties. On-demand (town) connections typically use less water but generate a higher peak flow rate, while restricted (rural) connections require more water but this is trickle-fed at a low flow rate. The restricted connections are not metered separately so this capacity assessment considers the supply as a whole.
Table 22‑2 Capacity Summary
| Consented Take | 10.5 | 907 | 136,0501 | CRC9901058 in progress |
| Peak Demand – current | 18.14
| 9165
7552 | 118,0003 |
|
| Peak Demand - 2046 | - | 990 | 163,000 | Daily volume adequate until about 2036 |
| Abstraction capacity | 10.4 | 900 | 143,930 | 1 bore pump (and alternate) |
1 inferred volume based on 150 x daily volume (ECan), 2 Jan 2015, 3 Jan –Dec 2013 adjusted to address overstated volume (actual was 142,660 m3), (Note July 2012-June 2013 volume = 121,080 m3 actual, or 112,870 m3 adjusted), 4 Jan 2015, 5 Jan 2009
There is 360 m3 of elevated reservoir storage. Additional volume can be delivered from storage at times of high demand.
Peak summer demands are high (but not extreme) relative to average winter demand (3x greater), suggesting some scope for demand management. However, average day demand over the winter months at 1,300 L/connection is higher than would be expected, suggesting high leakage from the network which requires investigation. Reducing losses will create additional capacity available for growth.
The water supply has sufficient capacity to meet current demands but capital upgrades will be required if projected growth is to be accommodated.
22.5 Resource Consents
The Springfield water supply has a number of resource consents.
Table 22‑3 Resource Consents
CRC991058
| To take surface water, at or about map reference L35:243-643 for community water supply. | Springfield Township, SPRINGFIELD | 28-Aug-98 | 28-Aug-35 | 10.5 | 907 |
CRC155932
| to divert, take and use water | Upper & Lower Kowai River, etc | 28-Aug-15 | 5-Nov-28 | 10 | 864 |
22.6 Water Quality
The Springfield water supply is a non-secure source and is currently sampled twice weekly at the source, treatment plant and weekly in the reticulation.
The following details E. coli transgressions for the period 2012 to 2020.
Source
There have been 31 incidences of E. coli identified in source water during this period, highlighting the importance of water treatment for this scheme.
Figure 22‑3 E.coli Trangressions - Source
Treatment
There have been no E. coli treatment transgressions during this period.
Zone
There has been one E. coli Zone transgression during this period which occurred in April 2017.
Chemical Analysis
The following is a summary of the raw water chemical analysis carried out at the Springfield Water Supply.
Table 22‑4 Springfield Water Supply Raw Water Chemical Analysis Summary
| Total Lead (g/m3) | 0.01 (Maximum Acceptable Value)
| <0.0001
| 0.0024
| 0.00039
| 0.0021
| 0.00016
| 0.000146
| 0.000121
| <0.00011
| ✓ |
| pH (pH units) | 7-8.5 (Guideline Value)
| 7.4
| 7.3
| 7
| 7.5
| 7.3
| 7.5
| 7.5
| 7.4
| ✓
|
| Total Hardness (g/m3 as CaCO3) | <200 (Guideline Value)
| 34
| 43
| 43
| 45
| 40.1
| 45.1
| 46.8
| 39.4
| ✓
|
| Total Calcium (g/m3) | n/v | 9.6
| 11.9
| 11.9
| 12.1
| 11.27
| 12.68
| 13.01
| 10.81
| ✓ |
| Total Iron (g/m3) | <0.2 (Guideline Value)
| <0.02
| 0.023
| 0.026
| 0.041
| 0.030 | <0.021
| 0.027
| <0.021
| ✓ |
| Total Sodium (g/m3) | <200 (Guideline Value)
| 4.1
| 4.5
| 4.8
| 4.7
| 4.38 | 5.02
| 5.29
| 4.39
| ✓
|
| Nitrate - Nitrogen (g/m3) | 11.3 (Maximum Acceptable Value)
| 0.61
| 1.32
| 0.98
| 0.64
| 0.571
| 1.54
| 1.48
| 0.763
| ✓
|
22.7 Scheme Assets
A summary of material and diameter for pipes in Springfield is shown below in Figure 22‑4 and Figure 22‑5.
Figure 22‑4 Pipe Material – Springfield
Figure 22‑5 Pipe Diameter – Springfield
22.8 Operational Management
The water supply is operated and maintained under two maintenance contracts as follows:
- Contract 1241: Water Services Contract. Contract is with SICON who undertakes investigations, conditions inspections, proactive and reactive maintenance and minor asset renewals; and
- Contract 1202: Parks and Reserves Contract. Contract is with SICON who undertakes the maintenance of land scape features related to water services e.g. mowing, gardens etc.
Water quality sampling is completed under an agreement with Food and Health Ltd as required.
22.9 Photos of Main Assets
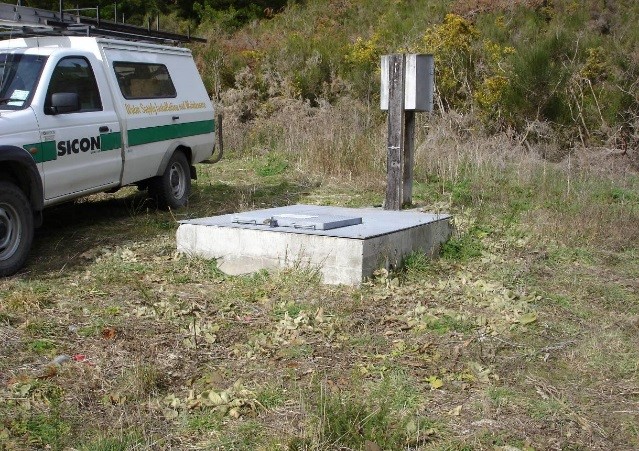
Photo 1: Intake
| 
Photo 2: Treatment Plant
|
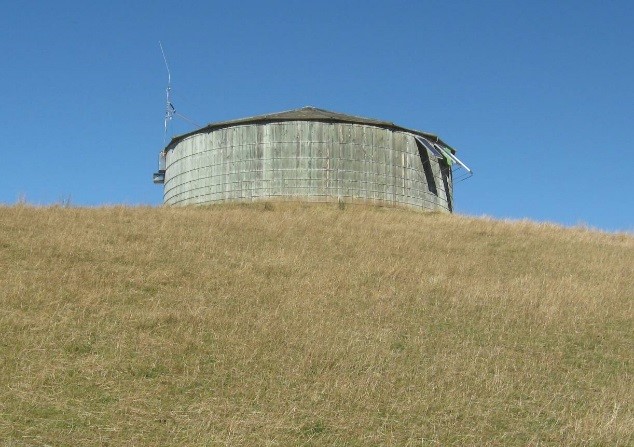
Photo 3: Main Reservoir
|
|
22.10 Risk Assessment
A risk assessment has been undertaken for the Springfield scheme. The key output from the risk assessment is the identification of any extreme and high risks which need to be mitigated. In order to mitigate these risks they have been included and budgeted for in the projects within this LTP. Table 22‑5 details the risk priority rating, Table 22‑6 outlines the risks and the list of key projects is found in Table 22‑11.
Table 22‑5 Risk Priority Rating
> 50
| Extreme | Awareness of the event to be reported to Council. Urgent action to eliminate / mitigate / manage the risk. Document risk and action in the AMP. |
| 35-50 | Very High | Risk to be eliminated / mitigated / managed through normal business planning processes with responsibility assigned. |
| 14-35 | High | Manage risk using routine procedures. |
| 3.5-14 | Moderate | Monitor the risk. |
| < 3.5 | Low | Awareness of the event to be reported to Council. Immediate action required to eliminate / mitigate / manage the risk. Document risk and action in the AMP. |
Table 22‑6 Risks – Springfield
| Access issues (currently located private property) | Gravel track | 2014 | 9 | 9 | 9 |
| Inadequate treatment | Install filtration | 2014 | 45 | 45 | 45 |
| Inadequate treatment | Install UV Treatment | 2014 | 45 | 45 | 45 |
| Inadequate treatment | Design new treatment system UV and Filtration | 2014 | 45 | 45 | 45
|
| Poor tank maintenance leads to tank failure | Maintenance - re tighten covers/liners | 2014 | 10 | 10 | 10 |
| Electrical failure due to lightning or network spikes | Install surge diverters | 2014 | 10 | 3.5 | 3.5 |
| Failure to meet NES water meter standards | NES Water Meter Compliance | 2014 | 20 | 6 | 6 |
| Inability to collect income from non-metered properties | Install property water meters | 2014 | 27 | 0.6 | 0.6 |
The list of district wide risks can be found in 5Waters Activity Management Plan: Volume 1.
22.11 Asset Valuation Details
The total replacement value of assets within the Springfield water scheme is $4,139,463 with further details in Table 22‑7 below.
Table 22‑7 Replacement Value, Springfield
| Plant and Equipment | $767,513
|
Water Reticulation
| Hydrant | $27,719
|
| Lateral | $153,545
|
| Pipe | $2,965,089
|
| Supply Point | $183,593
|
| Valve | $42,002
|
22.12 Renewals
The renewal profile has been taken from the 2019 5Waters Valuation. There is a backlog of assets due for renewal now.
Figure 22‑6 Springfield Water Renewal Profile
22.13 Critical Assets
The criticality model for Springfield has been updated for the 2021 AcMP. The methodology of the criticality model can be found in 5Waters Activity Management Plan: Volume 1 and it provides details of how the criticality has been calculated for the reticulation assets. Table 22‑8 and Figure 22‑7 below shows the calculated criticality for all of the assets within this scheme that have a recorded known length.
Table 22‑8 Length of Assets per Criticality Level
5
| Low | 22,807
|
4
| Medium-Low | 9,411
|
3
| Medium | 2,284
|
2
| Medium-High | 3,340
|
1
| High | 0
|
22.14 Asset Condition
The asset condition model was run for Springfield in 2021. The methodology of the model can be found in 5Waters Activity Management Plan: Volume 1 which provides details of how the model has been calculated for the pipe reticulation assets. Figure 22‑8 below shows the level of asset condition for these assets within this scheme that have a recorded known condition.
Table 22‑9 provides a description of the condition rating used within the condition model.
Table 22‑9 Asset Condition Grading
| 1.0 | Excellent |
| 2.0 | Good |
| 3.0 | Moderate |
| 4.0 | Poor |
| 5.0+ | Fail |
The number of pipe faults is also measured through the asset management system. Figure 22‑9 shows the known historic pipe failures within this scheme.
22.15 Funding Program
The 10 year budgets are shown by Table 22-10. Budgets are split into expenditure, renewals, projects and capital projects. Expenditure and renewals have been reported on a district-wide basis in Volume 1.
All figures are ($) not adjusted for CPI “inflation". They are calculated on historical data, and population growth where relevant.
Table 22-10 Budget Summary
| 2021/2022 | $15,500
| $190,000
|
2022/2023
| -
| $1,550,000
|
| 2023/2024 | -
| $50,000
|
| 2024/2025 | -
| -
|
| 2025/2026 | -
| -
|
| 2026/2027 | -
| -
|
| 2027/2028 | -
| -
|
2028/2029
| -
| -
|
2029/2030
| -
| -
|
2031/2032
| -
| -
|
| Total | $15,500
| $1,790,000
|
An explanation of the categories within the budgets are as follows below:
-
Expenditure consists of operation and maintenance costs;
-
Renewals are replacement of assets which are nearing or exceeded their useful life;
-
Projects are investigations, decisions and planning activities which exclude capital works; and
-
Capital projects are activities involving physical works.
Table 22-11 Key Projects
Capital Projects
| -
| Generator at Pocock Road WTP
| $50,000
| -
| -
| -
| 100% LoS
|
Capital Projects
| -
| Track upgrade & access rights at Pocock Road WTP
| $10,000
| -
| -
| -
| 100% LoS
|
Capital Projects
| -
| Automatic chlorination dosing at Pocock Road WTP
| $25,000
| -
| -
| -
| 100% LoS
|
Capital Projects
| -
| Additional pressure sensors added to network + additional 2 monitoring sites
| $20,000
| $50,000
| -
| -
| 100% LoS
|
Capital Projects
| -
| Chlorine analyser at Kowai Reservoir site
| $20,000
| -
| -
| -
| 100% LoS
|
Capital Projects
| -
| WTP upgrades
| $50,000
| $1,500,000
| -
| -
| 100% LoS
|
Capital Projects
| -
| Improve gallery or add second source
| -
| -
| $50,000
| -
| TBC
|
* Where LoS refers to Level of Service and G refers to Growth
The list of district wide projects can be found in 5Waters Activity Management Plan: Volume 1.
Discussion on Projects
Projects have been determined based on their:
- Relevance to the scheme
- Requirement to be completed under legislation
- Ability to bring the scheme up to or maintain the Level of Service required under council's Asset Management Policy.
Many projects are jointly funded by more than one scheme and activity. Each scheme pays a pro-rata share only, equivalent to the number of connections.
Discussion on Capital and Projects
Where relevant, Capital (Levels of Service) and Capital (Growth) projects have been included in the scheme financial details.
Levels of Service Projects and growth splits have been provided to ensure the costs of population driven works are clear.


