<<
5-Waters Volume 2 - Water Supplies
24 Tai Tapu / Otahuna Water Supply
24.1 Scheme Summary
Estimated Population Served
| 615
|
Scheme Coverage (1 Jan 2021)
| Full Charges
| 212
|
| Half Charges | 0
|
>1 Charges
| 58 (restricted)
|
System Components
| Bores/Intakes (No.) | 1 |
| Treatment/Disinfection | 1
|
| Reservoirs (No.) | 6
|
| Pump Stations (No.) | 1
|
| Piped (m) | 22,785
|
| History | Original scheme installation date | 1972 |
Value ($)
| Replacement Cost | $3,006,685
|
| Depreciated Replacement Cost | $1,944,750
|
Financial
| Operator cost (scheduled and reactive maintenance) per connection
| $375.73/connection
|
Demand (m3) (1 Jan – 31 Dec 2020)
| Average daily
| 403.9
|
| Peak daily | 2,118
|
| Minimum daily | -
|
| Average daily per connection | 1.31
|
| Type of Supply | | High pressure with restricted and unrestricted
|
Target Pressure & Flow at boundary
| Pressure | >310kPa |
| Flow | >20L/min |
| Sustainability | Well Security | Secure
|
24.2 Key Issues
The following key issues are associated with the Tai Tapu water supply. A list of district wide issues are located in 5Waters Activity Management Plan: Volume 1.
Table 24‑1 Tai Tapu Scheme Issues
| Review and confirm pumping capacity and plan for future growth | Growing community may put pressure on supply and investigate demand management measures
|
Catchment management
| To encompass a holistic view of the drinking water supply, improved liaison with ECan and study of ground water quality within the water supply protection zones are being investigated.
|
Bore pump failure
| There is no supply redundancy for this network, therefore a preventive maintenance programme for submersible pumps will be developed and implemented.
|
24.3 Overview & History
The Tai Tapu Water Supply provides untreated groundwater to the Tai Tapu township and the nearby Otahuna Valley area (restricted supply, 3m3/property). The community water supply was installed in 1972 to overcome health concerns in relation to septic tank effluent and high groundwater levels leading to contamination shallow domestic wells. Attempts at drilling deep bores adjacent to the Scout Den were unsuccessful with no water found. An attempt near Ryans bridge on Lincoln Tai Tapu Road was unsuccessful with a very high sand content. The third attempt at Perymans Road was successful and is in use today. Water is sourced from a single bore and supplied directly to the town, and to the Otahuna Valley supply zone via a booster pump station.
Following the September 2010 and February 2011 earthquake liquefaction occurred throughout the township. Water services along the Halswell River, in the area of Ryans Road failed due to lateral spread of material. No other acute failures were recorded, this section of main has been relaid. The Department of Building and Housing have classified this well as being Foundation Technical Category 2 (TC2). This recognises minor to moderate land damage has occurred. It requires increases in vertical infrastructure strength including foundation design. Careful review of horizontal infrastructure i.e. pipes installation is recommended.
![]()
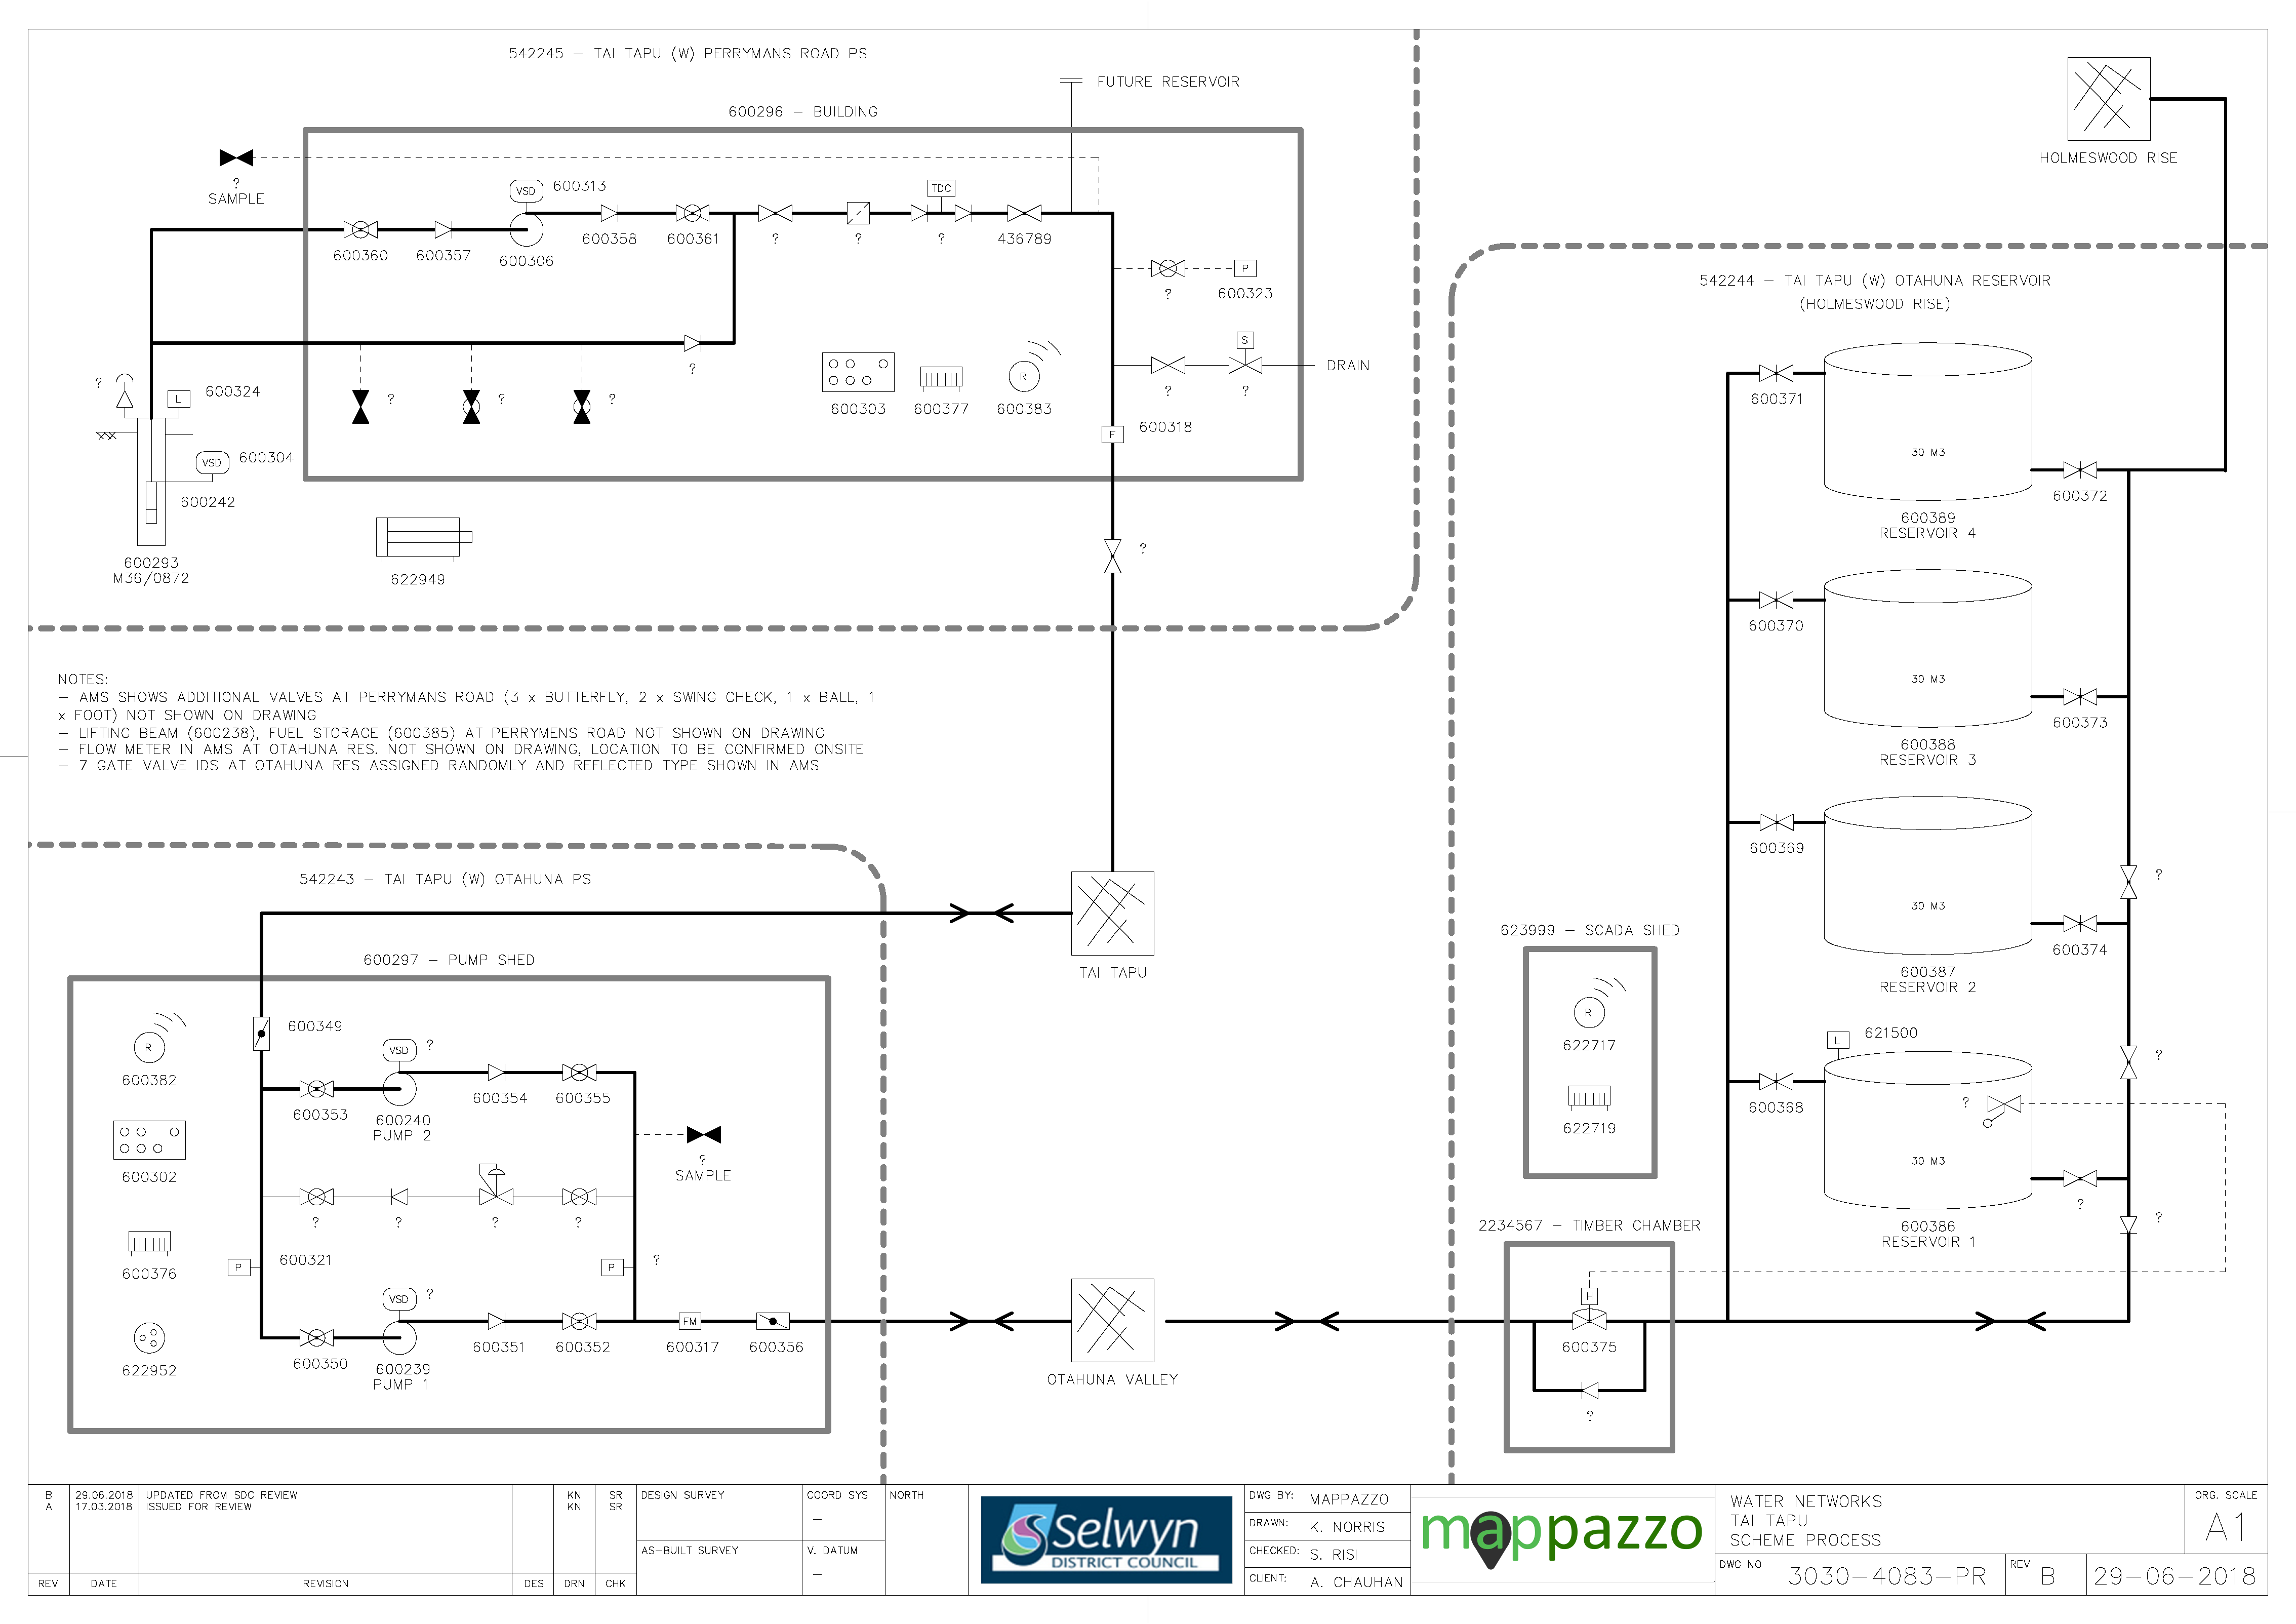
Figure 24‑2 Scheme Schematic
24.4 System Capacity
There is some potential for residential growth in Tai Tapu in terms of zoned land availability and modest growth is anticipated in this area (10% over 30 years). The Tai Tapu supply also delivers a restricted supply to properties in the Otahuna valley. On-demand (town) connections typically use less water but generate a higher peak flow rate, while restricted (rural) connections require more water but this is trickle fed at a low flow rate. This capacity assessment considers the supply as a whole and also the restricted supply (Otahuna) zone which is metered separately.
Table 24‑2 Capacity Summary
Consented Take
| 25
| 6599m3/7days Ave = 937 m3/day Max = 1080 m3/day
1 | 140,550
2 | CRC134786 |
| Peak Demand - current | - | 4739m3 /7 days
3 772 m3/day 4 | 120,550
5 |
|
| Peak Demand - 2046 | - | 5190 m3/7 days 850 m3/day | 132,000
|
|
Abstraction capacity
| 25
|
|
| 1 bore pump (and alternate) |
1 estimated maximum on any single day such that weekly limit will not be exceeded, 2 inferred volume based on 150 x daily volume (ECan), 3 25-31 Jan 2013, 4 14 Jan 2013, 5 Jan –Dec 2013 (note July 2012-June 2013 volume = 105,470 m3)
The water take consent limits the maximum rate of take to 25 L/s. This is matched by the installed pump capacity. There is no reservoir storage so the maximum flow rate that can be supplied to the community is 25 L/s.
Providing that instantaneous demand can be managed within the capacity of the installed pump there is potential to accommodate additional connections on this supply. Demand management approaches could be used to smooth the daily demand profile and reduce the instantaneous peak demand.
Increasing the instantaneous flow capacity could be potentially achieved by installing a larger pump, subject to any physical constraints, source limitations and consenting issues. Alternatively, above ground storage and pumping could be provided to augment supply at peak times.
Peak day demands are moderately high relative to average winter day demands (x3) but not so extreme as other towns that have been examined (Dunsandel, Kirwee, x8). This may reflect differing climatic conditions and soil types. Demand management may be less effective in Tai Tapu where demands are less extreme.
Overall the supply capacity is sufficient to meet current and projected future demands.
Otahuna Rural Restricted Zone
A booster pumping system is used to transfer water from Tai Tapu to the Otahuna valley restricted supply scheme. There are no consent limitations specific to the Otahuna scheme. All connections are restricted, ie an agreed volume (typically 3 m3) is supplied at a steady flow rate over 24 hours. The capacity of this scheme is thus only constrained by the booster pump capacity.
Table 24‑3 Capacity Summary - Otahuna
| Allocated Volume | 1.3 | 108 | 39,420 | 36 connections, 3m3/con/day |
| Peak Demand | 2.4 | 210 (195%) | 29,500 (75%) | |
Booster pump capacity
| 2.7 | 233 | - | Lowara SV81475 |
It is evident that peak demands are well in excess of the total allocated volume for these restricted connections, which was exceeded on about 20% of the days during 2013. The peak day demand exceeds the booster pump capacity, suggesting drawdown of the storage volume provided (120m3).
Additional Otahuna connections could be supported providing that all consumers operate within their daily allocation.
24.5 Resource Consents
The Tai Tapu/Otahuna water supply has a number of resource consents. Table 24‑4 shows the water take permitted by the resource consents for this scheme.
Table 24‑4 Resource Consents
CRC134786
| To take and use groundwater. | Perymans Road, TAI TAPU | 27-Mar-13 | 31-Jan-35 | 25 | 937
(6559 per 7 days) |
24.6 Water Quality
The Tai Tapu water supply is a secure source and is currently sampled twice weekly at the treatment plant and weekly in the reticulation zone.
The following details E. coli transgressions for the period 2012 to 2020.
Treatment
There have been no E. coli source transgressions during this period.
Zone
There has been one E. coli treatment transgression during this period which occurred in March 2015.
Chemical Analysis
The following is a summary of the raw water chemical analysis carried out at the Tai Tapu Water Supply.
Table 24‑5 Tai Tapu Water Supply Raw Water Chemical Analysis Summary
| Total Lead (g/m3) | 0.01 (Maximum Acceptable Value)
| 0.00015
| 0.00014
| 0.00021
| 0.0029
| 0.000194 | 0.000282
| <0.00011
| 0.000196
| ✓
|
| pH (pH units) | 7-8.5 (Guideline Value)
| 7.7
| 7.6
| 7.7
| 7.9
| 7.8 | 7.7
| 7.8
| 7.9
| ✓
|
| Total Hardness (g/m3 as CaCO3) | <200 (Guideline Value)
| 48
| 55 | 54
| 55
| 51.3
| 52.9
| 52.1
| 50.9
| ✓ |
| Total Calcium (g/m3) | n/v | 15
| 17.5
| 16.9
| 17
| 16.16 | 16.75
| 16.33
| 16.18
| ✓ |
| Total Iron (g/m3) | <0.2 (Guideline Value)
| <0.02
| <0.021
| <0.021
| 0.43
| < 0.021 | <0.021
| <0.021
| <0.021
| ✓
|
| Total Sodium (g/m3) | <200 (Guideline Value)
| 9
| 9.9
| 9.6
| 10.2
| 9.43
| 9.50
| 9.36
| 9.20
| ✓
|
| Nitrate - Nitrogen (g/m3) | 11.3 (Maximum Acceptable Value)
| 0.23
| 0.24 | 0.23
| 0.24
| 0.26
| 0.264
| 0.247
| 0.259
| ✓
|
24.7 Scheme Assets
A summary of material and diameter for pipes in Tai Tapu/Otahuna is shown below in Figure 24‑3 and Figure 24‑4.
Figure 24‑3 Pipe Material – Tai Tapu/Otahuna
![]()
Figure 24‑4 Pipe Diameter – Tai Tapu/Otahuna
24.8 Operational Management
The water supply is operated and maintained under two maintenance contracts as follows:
- Contract 1241: Water Services Contract. Contract is with SICON who undertakes investigations, conditions inspections, proactive and reactive maintenance and minor asset renewals; and
- Contract 1202: Parks and Reserves Contract. Contract is with SICON who undertakes the maintenance of land scape features related to water services e.g. mowing, gardens etc.
Water quality sampling is completed under an agreement with Food and Health Ltd as required.
24.9 Photos of Main Assets
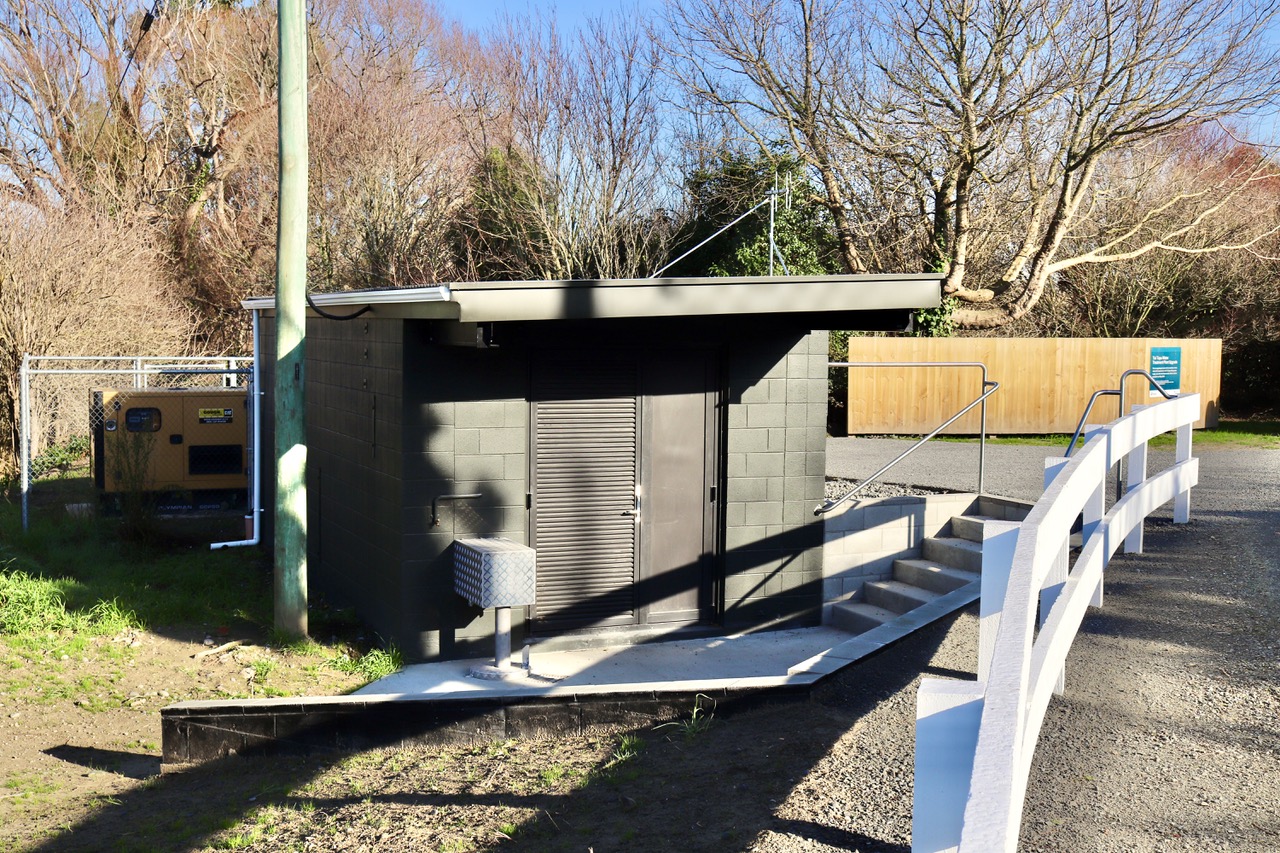
Photo 1: Perymans Road pump shed
|

Photo 2: Otahuna Valley pump shed
|
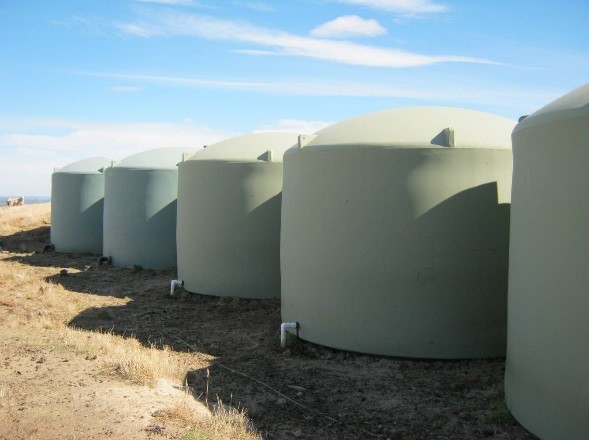
Photo 3: Otahuna Valley reservoirs
(fifth reservoir on right is privately owned and is not part of the scheme's storage)
|
24.10 Risk Assessment
A risk assessment has been undertaken for the Tai Tapu/Otahuna scheme. The key output from the risk assessment is the identification of any extreme and high risks which need to be mitigated. In order to mitigate these risks they have been included and budgeted for in the projects within this LTP. Table 24‑6 outlines the risk priority rating, Table 24‑7 outlines the risks and the list of key projects is found in Table 24‑12.
Table 24‑6 Risk Priority Rating
> 50
| Extreme | Awareness of the event to be reported to Council. Urgent action to eliminate / mitigate / manage the risk. Document risk and action in the AMP. |
| 35-50 | Very High | Risk to be eliminated / mitigated / managed through normal business planning processes with responsibility assigned. |
| 14-35 | High | Manage risk using routine procedures. |
| 3.5-14 | Moderate | Monitor the risk. |
| < 3.5 | Low | Awareness of the event to be reported to Council. Immediate action required to eliminate / mitigate / manage the risk. Document risk and action in the AMP. |
Table 24‑7 Risks – Tai Tapu/Otahuna
| Electrical failure due to lightning or network spikes | Install surge diverters | 2014 | 10 | 10 | 10 |
| Failure to meet NES water meter standards | NES Water Meter Compliance | 2014
| 20 | 6 | 6
|
| Inability to collect income from non-metered properties | Install property water meters | 2014 | 27 | 27 | 2.1
|
| Non-compliance with the DWSNZ | DWSNZ - Age Testing | 2014 | 10 | 0.7 | 0.7 |
| Non-compliance with the DWSNZ | DWSNZ - Bore-head security | 2014 | 10 | 10 | 10 |
| Non-consented activities | Renewal of consents | 2014 | 27 | 27 | 6 |
| Scheme efficiently / redundancy | Join Tai Tapu to Lincoln | 2017 | | 20 | 3.5 |
The list of district wide risks can be found in 5Waters Activity Management Plan: Volume 1.
24.11 Asset Valuation Details
The total replacement value of assets within the Tai Tapu/Otahuna water scheme is $3,006,685 with further details in Table 24‑8 below.
Table 24‑8 Replacement Value, Tai Tapu/Otahuna
Plant and Equipment
| $467,821
|
Water Reticulation
| Hydrant | $84,968
|
| Lateral | $81,342
|
| Pipe | $2,025,167
|
| Supply Point | $245,071
|
| Valve | $102,316
|
![]()
24.12 Renewals
The renewal profile has been taken from the 2019 5 Waters Valuation. A graph showing the renewals for this scheme are shown by Figure 24‑5 below.
Figure 24‑5 Tai Tapu/Otahuna Water Renewal Profile
24.13 Critical Assets
The criticality model for Tai Tapu/Otahuna has been updated for the 2021 AcMP. The methodology of the criticality model can be found in 5Waters Activity Management Plan: Volume 1 and it provides details of how the criticality has been calculated for the reticulation assets. Table 24-9 and Figure 24‑6 below show the calculated criticality for all of the assets within this scheme that have a recorded known length.
Table 24‑9 Length of Assets per Criticality Level
5
| Low
| 7,309
|
4
| Medium-Low
| 10,171
|
3
| Medium
| 1,896
|
2
| Medium-High
| 2,898
|
1
| High | 47
|
24.14 Asset Condition
The asset condition model was run for Tai Tapu/Otahuna in 2021. The methodology of the model can be found in 5Waters Activity Management Plan: Volume 1 which provides details of how the model has been calculated for the pipe reticulation assets. Figure 24‑7 below shows the level of asset condition for these assets within this scheme that have a recorded known condition.
Table 24‑10 provides a description of the condition rating used within the condition model.
Table 24‑10 Asset Condition Grading
| 1.0 | Excellent |
| 2.0 | Good
|
| 3.0 | Moderate |
| 4.0 | Poor |
| 5.0+ | Fail |
The number of pipe faults is also measured through the asset management system. Figure 24‑8 shows the known historic pipe failures within this scheme.
24.15 Funding Program
The 10 year budgets are shown by Table 24-11. Budgets are split into expenditure, renewals, projects and capital projects. Expenditure and renewals have been reported on a district-wide basis in Volume 1.
All figures are ($) not adjusted for CPI “inflation". They are calculated on historical data, and population growth where relevant.
Table 24-11 Budget Summary
| 2021/2022 | $10,000
| $50,000
|
2022/2023
| -
| -
|
| 2023/2024 | -
| -
|
| 2024/2025 | -
| -
|
| 2025/2026 | -
| $900,000
|
| 2026/2027 | -
| -
|
| 2027/2028 | -
| - |
2028/2029
| -
| -
|
2029/2030
| -
| -
|
2031/2032
| -
| -
|
| Total | $10,000
| $950,000
|
An explanation of the categories within the budgets are as follows below:
-
Expenditure consists of operation and maintenance costs;
-
Renewals are replacement of assets which are nearing or exceeded their useful life;
-
Projects are investigations, decisions and planning activities which exclude capital works; and
-
Capital projects are activities involving physical works.
Table 24-12 Key Projects
Capital Projects
| -
| Connection to Lincoln
| -
| -
| -
| $500,000
| TBC
|
Capital Projects
| -
| Reservoir at/near WTP site, chlorine and UV maintenance
| -
| -
| -
| $400,000
| TBC
|
Capital Projects
| -
| Additional pump shed Otahuna
| $50,000
| -
| -
| -
| 100% LoS
|
* Where LoS refers to Level of Service and G refers to Growth
The list of district wide projects can be found in 5Waters Activity Management Plan: Volume 1.
Discussion on Projects
Projects have been determined based on their:
- Relevance to the scheme
- Requirement to be completed under legislation
- Ability to bring the scheme up to or maintain the Level of Service required under council's Asset Management Policy.
Many projects are jointly funded by more than one scheme and activity. Each scheme pays a pro-rata share only, equivalent to the number of connections.
Discussion on Capital and Projects
Where relevant, Capital (Levels of Service) and Capital (Growth) projects have been included in the scheme financial details.
Levels of Service Projects and growth splits have been provided to ensure the costs of population driven works are clear.
<<
5-Waters Volume 2 - Water Supplies


