​​​​​​​​​​​​​<< ​​5-Waters Volume 2 - Water Supplies
​​​​​​​​​​​​​​​​​​<< ​​Sheffield Waddington Water Supply​​​
Springfield Water Supply​​ >>​​​

​​21​   Southbridge Water Supply


21.1       Scheme Summary


Description​ Quantity
Estimated Population Served ​1,027

Scheme Coverage

(1 Jan 2021)

Full Charges346
Half Charges0
>1 Charges8
System Components
Bores/Intakes (No.)2
Treatment/Disinfection2
Reservoirs (No.)2
Pump Stations (No.)1
Piped (m)17,726
HistoryOriginal scheme installation date1983
Value ($) ​
Replacement Cost$2,589,558
Depreciated Replacement Cost$1,305,427
Financial
Operator cost (scheduled and reactive maintenance) per connection​
$200.61

Demand (m3)

(1 Jan – 31 Dec 2020)

Average daily345
Peak daily1,157
Minimum daily-
Average daily per connection0.91
Type of Supply High pressure and unrestricted
Target Pressure & F​low at boundary ​
Pressure>310kPa
Flow>20L/min
SustainabilityWell SecurityUnsecure


21.2       Key Issues

The following key issues are associated with the Southbridge water supply.  A list of district wide issues are located in 5Waters Activity Management Plan: Volume 1.

Table 21‑1 Southbridge Scheme Issues

What's the Problem​ What we plan to do
Lack of capacity within this scheme to allow for growth within the township.Install new bore and or increase capacity of existing bore.
Areas of low pressure have been anecdotally identified by customers.  Given the scheme was installed to meet drinking water needs (not fire flow) this may be satisfactory. However, work will be undertaken to confirm issues, if any and propose physical works to address any level of service gap.

​Catchment management

​To encompass a holistic view of the drinking water supply improved liaison with ECan and study of ground water quality within the water supply protection zones are being investigated.

​Headworks

Implement improvements to headworks at Taiaroa Place WTP.

​Water treatment

​No treatment currently in place at Taiaroa Place WTP; design and install UV disinfection with provision for filtration.

​Backflow: Due to the number of industrial, commercial and irrigation sites in Southbridge the scheme is becoming more vulnerable to potential backflow issues. 

​There is currently a district wide backflow prevention project underway.

​Emergency chlorination

To allow on-demand chlorination as a result of a treatment or storage transgression or contamination event provision for emergency chlorination is currently being planned for the scheme.


21.3       Overview & History

The Southbridge Water Supply provides untreated groundwater to the Southbridge community from two independent well sources.

These were installed to meet a Medical Officer of Health requirement to protect health previously resulting from failing septic tanks effluent rising with shallow bore water.

The Southbridge Water Supply was constructed in 1975 to provide untreated groundwater to the Southbridge community from two independent bore sources. Until 1983, most properties in the township were on individual bores, with the exception being the subdivision at Taiaroa Place having a communal bore. At this time a reticulated supply was constructed and supplied by the Taiaroa Place well. However to cope with the additional demand, the High Street bore was required immediately.

In areas where the reticulation is constructed of 50mm diameter polythene pipes, property owners experience low pressures during peak periods.  To overcome this, a reticulation upgrade programme was completed in 2009.

The Southbridge scheme was designed as a domestic supply and will not comply with the NZ Fire Fighting Code of Practice in most areas.

In 2018 a new bore, UV treatment and reservoir storage was developed on Council owned land located at St John Street, Southbridge.​

​​​
​​ Figure 21-1
SOUTHBRIDGE Water - Scheme map

Open larger map: 'Water Scheme'

Southbridge - Scheme Schematic.png

Figure 21‑2 Scheme Schematic


21.4       System Capacity

In response to the accelerated growth within the Selwyn District hydraulic models have been used to plan future water infrastructure for a number of the water supplies. Hydraulic models have been built and calibrated to international best practice to carry out the '30-year Water Infrastructure Master Planning'. 

The master planning provides an assessment of the sizing and timing of new infrastructure for new water sources (wells) and pipelines to service growth.  Part of the master planning requires a water balance to be developed to forecast growth, using historical peak demand per household.  The water balance forecasts the peak instantaneous flow per year versus the water resources available to determine the staging of new wells.  The well staging assumes that one well is redundant for each water supply, to take into consideration maintenance of wells, planning/timing of new wells and security of supply i.e. to maintain average/peak demand.   

Figure 21‑3 shows the projected growth in water demand for Southbridge in accordance with the latest house projections.

The master planning exercise has identified that two new wells will be required (in 2020/21 and 2024/25), to cater for growth and to allow the less productive High Street well to be decomissioned.

V3 Southbridge - Water Balance Assessment.PNG
​Figure 21‑3 Southbridge Water Demand


Table 21‑2 Water Source Current Capacity

Sites Available​ Well Capacity (L/s)
High Street115
(to be decomissioned)
Taiaroa Place19


Table 21‑3 Water Source Future Capacity

New Site ID​ Well/Site Location Planning Year Yield (L/s)
SOU1WellSt John Street2020/21
40
SOU2WellHigh Street - Decommission2020/21
-15
SOU3
WellSt John Street (TBC)2024/25
40


Southbridge - Master Plan.png

Figure 21‑4 Southbridge Master Plan


21.5       Resource Consents

The Southbridge water supply has a number of resource consents. 

Table 21‑4 Resource Consents

Consent

Description Location Date Issued Expiry DateBores

Consented Max Instantaneous Flow (L/s) Consented Max  Volume 

CRC181080


To take and use groundwater
19 John Street, SOUTHBRIDGE
23-Jan-18
31-Jan-35
​L36/0421
M36/0698
BY22/0057
18
25
55
19,051 m3 per 7 days


21.6       Water Quality

The Southbridge water supply is non-secure with two wells (High Street and Taiaroa Place) which are sampled twice weekly. The reticulation is sampled weekly.

The following details E. coli transgressions for the period 2012 to 2020.

Treatment

There have been two E. coli transgressions during this period, in July 2013 and September 2019.

Reticulation Zone​

There has been no E. coli treatment transgressions during this period.

​Chemical Analysis

The following is a summary of the raw water chemical analysis carried out at the Southbridge Water Supply. 

Table 21‑5 Raw Water Chemical Analysis Summary: Taiaroa Street Well

Parameter​ Standards
​2008
​2011
​2013
201520172018
​2019
Status
Total Lead (g/m3)
0.01 (Maximum Acceptable Value)
​0.00013
​0.00016
​0.00024
<0.00011
<0.00011​0.000578
​<0.00011

pH (pH units)7-8.5 (Guideline Value)
​7.4
​7.3
​7.3
7.7
7.6
​7.6
​7.7

Total Hardness (g/m3 as CaCO3)<200 (Guideline Value)
​55
​71
​74
75
70.1
​76.7
​82.6

Total Calcium (g/m3)n/v​19
​24
​24
25
23.42
​25.8
​27.6

Total Iron  (g/m3)<0.2 (Guideline Value)
​0.02
​0.057
​<0.021
0.152
<0.021​<0.021
​<0.021

Total Sodium (g/m3)<200 (Guideline Value)​
​6.6
​7.9
​8.2
8.8
7.73
​8.27
​8.87

Nitrate - Nitrogen (g/m3)11.3 (Maximum Acceptable Value)
​2.9
​3.7
​4
3.8
3.53
​3.88
​4.28


Table 21‑6 Raw Water Chemical Analysis Summary: St John Street Well
​​Parameter
​Standards
​2019
​​Status
​Total Lead (g/m3)
​0.01 (Maximum Acceptable Value)
​<0.00011
​✓
​pH (pH units)
​7-8.5 (Guideline Value)
​7.8
​✓
​Total Hardness (g/m3 as CaCO3)
​<200 (Guideline Value)
​51.7
​✓
​Total Calcium (g/m3)
​n/v
​17.92
​✓
​Total Iron  (g/m3)
​<0.2 (Guideline Value)
​0.074
​✓
​Total Sodium (g/m3)
​<200 (Guideline Value)​
​6.72
​✓
​Nitrate - Nitrogen (g/m3)
​11.3 (Maximum Acceptable Value)
​2.49
✓​​

​​

21.7       Scheme Assets

A summary of material and diameter for pipes in Southbridge is shown below.

Figure 21‑5 Pipe Material – Southbridge


​Figure 21‑6  Pipe Diameter – Southbridge


21.8       Operational Management

The water supply is operated and maintained under two maintenance contracts as follows:

  • Contract 1241: Water Services Contract.  Contract is with SICON who undertakes investigations, conditions inspections, proactive and reactive maintenance and minor asset renewals; and
  • Contract 1202: Parks and Reserves Contract.  Contract is with SICON who undertakes the maintenance of land scape features related to water services e.g. mowing, gardens etc.

Water quality sampling is completed under an agreement with Food and Health Ltd as required.


21.9       Photos of Main Assets


Southbridge - Photo 1 Taiaroa Street Control Building.jpg
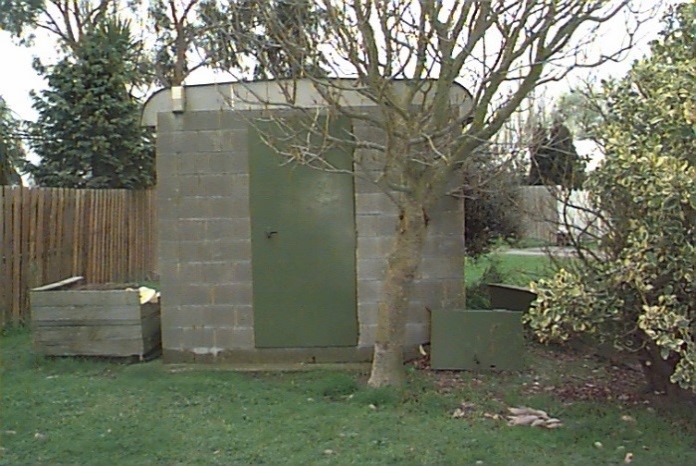
Photo 1: Taiaroa Street Control Building
Southbridge - Photo 2 High Street Well head (below covers).jpg
​Photo 2: High Street Well head (below covers)
V2 Southbridge - Photo 3 St Johns St Treatment Plant and Bore.jpeg
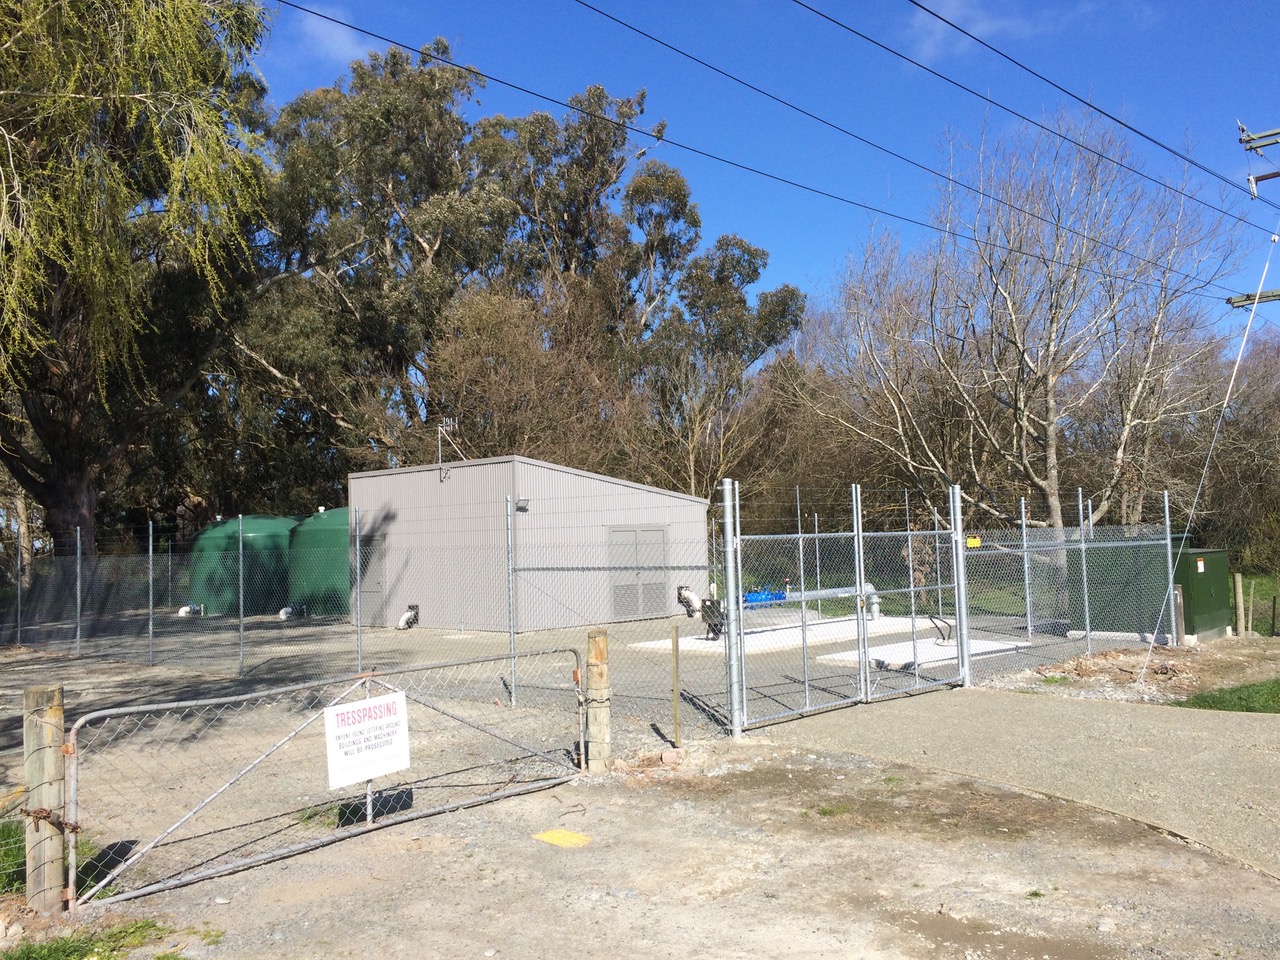
Photo 3: St Johns St Treatment Plant and Bore


21.10       Risk Assessment

A risk assessment has been undertaken for the Southbridge scheme. The key output from the risk assessment is the identification of any extreme and high risks which need to be mitigated. In order to mitigate these risks they have been included and budgeted for in the projects within this LTP. Table 21‑7 outlines the risk priority rating, Table 21‑8 outlines the risks and the list of key projects is found in Table 21‑13.

Table 21‑7 Risk Priority Rating

Risk Score​ Level of Risk Risk Response
>50Extreme

Awareness of the event to be reported to Council.

Urgent action to eliminate / mitigate / manage the risk.

Document risk and action in the AMP.

35-50Very HighRisk to be eliminated / mitigated / managed through normal business planning processes with responsibility assigned.
14-35HighManage risk using routine procedures.
3.5-14ModerateMonitor the risk.
<3.5Low

Awareness of the event to be reported to Council.

Immediate action required to eliminate / mitigate / manage the risk.

Document risk and action in the AMP.


Table 21‑8 Risks – Southbridge

Risk​​ Action/Project Year Identified 2014 Risk Rating 2017 Risk Rating Residual Risk Rating
Wells not run for extended periods of timeAuto well turnover2014202020
Electrical failure due to lightning or network spikesInstall surge diverters2014202020
Failure to meet NES water meter standardsNES Water Meter Compliance20142066
Inability to collect income from non-metered propertiesInstall property water meters201427272.1
Non-consented activitiesRenewal of consents201427276
Inadequate capacity into the futureCapacity upgrades2017
206


The list of district wide risks can be found in 5Waters Activity Management Plan: Volume 1.


21.11       Asset Valuation Details

The total replacement value of assets within the Southbridge water scheme is $2,589,558 with further details in Table 21‑9 below.

Table 21‑9 Replacement Value, Southbridge

Asset Class 1​​ Asset Class 2 Sum of Replacement Value
Plant and Equipment ​$385,615
Water Reticulation ​​ ​​ ​​ ​
Hydrant$93,234
Lateral$75,135
Pipe$1,554,645
Supply Point$400,841
Valve$80,088


21.12       Renewals

The renewal profile has been taken from the 2019 5 Waters Valuation. The majority of renewals occur in 2033/2034.

​Figure 21‑7 Southbridge Water Renewal Profile


21.13       Critical Assets

The criticality model for Southbridge has been updated for the 2021 AcMP. The methodology of the criticality model can be found in 5Waters Activity Management Plan: Volume 1 and it provides details of how the criticality has been calculated for the reticulation assets. Table 21‑10 and Figure 21-8 below show the calculated criticality for all of the assets within this scheme that have a recorded known length.

Table 21‑10 Length of Assets per Criticality Level

Criticality Bands​ Length (m)
5
Low9,584
4
Medium-Low4,566
3
Medium516
2
Medium-High818
1
High0​


​​​
​​ Figure 21-8
SOUTHBRIDGE Water - Criticality map

Open larger map: 'Water Criticality'

​​

​21.14       Asset Condition

The asset condition model was run for Southbridge in 2021. The methodology of the model can be found in 5Waters Activity Management Plan: Volume 1 which provides details of how the model has been calculated for the pipe reticulation assets. Figure 21‑9 below shows the level of asset condition for these assets within this scheme that have a recorded known condition.

​​​
​​ Figure 21-9
SOUTHBRIDGE Water - Condition map

Open larger map: 'Water Condition'

Table 21‑11 provides a description of the condition rating used within the condition model.

Table 21‑11 Asset Condition Grading

Condition Rating​ Grading
1.0
Excellent
2.0Good
3.0Moderate
4.0Poor
5.0+Fail


The number of pipe faults is also measured through the asset management system. Figure 21‑10 shows the known historic pipe failures within this scheme.

​​​
​​ Figure 21-10
SOUTHBRIDGE Water - Pipe Faults map

Open larger map: 'Water Pipe Faults'

​ ​

21.15       Funding Program

The 10 year budgets are shown by Table 21-12​. Bu​dgets are split into expenditure, renewals, projects and capital projects. Expenditure and renewals have been reported on a district-wide basis in Volume 1. 

All figures are ($) not adjusted for CPI “inflation".  They are calculated on historical data, and population growth where relevant.​

Table 21-12 Budget Summary

Years​ Projects Capital Projects
2021/2022 -
 $169,645
2022/2023
 $12,000
 -
2023/2024 -
 -
2024/2025 -
 -
2025/2026 -
 -
2026/2027 -
 $31,358
2027/2028 -
2028/2029
 -
 -
2029/2030
 -
 -
2031/2032
 -
 -
Total $12,000
 $201,003

An explanation of the categories within the budgets are as follows below:

  • Expenditure consists of operation and maintenance costs;
  • Renewals are replacement of assets which are nearing or exceeded their useful life;
  • Projects are investigations, decisions and planning activities which exclude capital works; and
  • Capital projects are activities involving physical works.

Table 21-13 Key Projects

Account Label GL Description​  Year 1($)  Year 2($)  Year 3($) Years 4 to 10 Funding Split *
​Capital Projects
​407790037
​Southbridge growth
​$129,645
​-
​-
​$31,358
​100% G
​Capital Projects​
-
Upgrading of storage and addition of 2 reservoirs
 $20,000

-
-
-
TBC

​Capital Projects
​-
​Additional pressure sensors added to network
​$20,000
​-
-
​-
​100% LoS

​Projects
-
Investigations: review of plastic tank lid design; investigate water loss; flush tanks
​$12,000
-
​-
​-
100% LoS

 * Where LoS refers to Level of Service and G refers to Growth

The list of district wide projects can be found in 5Waters Activity Management Plan: Volume 1.

Discussion on Projects

Projects​​​ have been determined based on their:

  • Relevance to the scheme
  • Requirement to be completed under legislation
  • Ability to bring the scheme up to or maintain the Level of Service required under council's Asset Management Policy. 

Many projects are jointly funded by more than one scheme and activity.  Each scheme pays a pro-rata share only, equivalent to the number of connections.

Discussion on Capital and Projects

Where relevant, Capital (Levels of Service) and Capital (Growth) projects have been included in the scheme financial details. 

Levels of Service Projects and growth s​plits have been provided to ensure the costs of population driven works are clear.​​​​​​​​

​​​<< ​​5-Waters Volume 2 - Water Supplies
​​​​​​​​​​​​​​​​​​<< ​​Sheffield Waddington Water Supply​​​
Springfield Water Supply​​ >>​​​