<<
5-Waters Volume 2 - Water Supplies
19 Rolleston Water Supply
19.1 Scheme Summary
Estimated Population Served
| 19,198
|
Scheme Coverage (1 Jan 2021)
| Full Charges | 6,541
|
| Half Charges | 0
|
| >1 Charges | 75 (6 restricted)
|
System Components
| Bores/Intakes (No.) | 9
|
| Treatment/Disinfection | 4 x WTPs |
| Reservoirs (No.) | 3 |
| Pump Stations (No.) | 3 |
| Piped (m) | 315,160 |
| History | Original scheme installation date | 1960s |
Value ($)
| Replacement Cost | $50,877,472
|
| Depreciated Replacement Cost | $41,634,670
|
Financial
| Operator cost (scheduled and reactive maintenance) per connection
| $77.69/connection
|
Demand (m3) (1 Jan – 31 Dec 2020)
| Average daily | 8,684
|
| Peak daily | 18,841
|
| Minimum daily | 186
|
| Average daily per connection | 1.3
|
| Type of Supply | | High pressure and unrestricted |
Target Pressure & Flow at boundary
| Pressure | >310KPa |
| Flow | >20 Lts/min |
| Sustainability | Well Security | Secure
|
19.2 Key Issues
The following key issues are associated with the Rolleston water supply. A list of district wide issues are located in 5Waters Activity Management Plan: Volume 1.
Table 19‑1 Rolleston Scheme Issues
| Due to the significant growth of Rolleston, new wells are required to meet demand. | Council will continue to review the water infrastructure plan on an annual basis while considering actual and predicted growth. Infrastructure will be provided as and when required in consideration of the urban/industrial split. Detailed network modelling supports the infrastructure plan. |
| Due to the significant growth demand management is required to ensure demand is within consented limits. | Council will continue to monitor demand and employ demand management initiatives to ensure peak water consumption does not limit future growth. Demand management initiatives may include but are not limited to development of water zones for pressure management and public education.
|
Catchment management
| Council are investigating groundwater quality within the water supply protection zones, and working with ECan on this matter
|
Pressure zoning will be required within Rolleston's reticulation network, because it is growing so large
| Council are planning to install more pressure monitoring devices within the reticulation network, and we are developing a Target Pressure Plan and Network Management Strategy
|
The water supply is becoming more vulnerable to contamination from backflow, because there are more commercial, industrial and irrigation sites in Rolleston
| Council are underway with a district-wide backflow prevention project
|
The scheme requires the ability to chlorinate if required in an emergency
| Council are planning for upgrades to the Rolleston water supply to allow on-demand chlorination, if there is an emergency or transgression/contamination event.
|
19.3 Overview & History
The Rolleston Water Supply Scheme is a high pressure unrestricted supply serving an estimated population of 19,198 as of 1st January 2021. Development of the water supply to Rolleston community has been progressive over time to accommodate population growth and business development.
Groundwater is provided from nine bores, with treatment provided at four treatment plants.
In 1961 the Canterbury Tractor Company installed a well to supply water to properties in the close vicinity. The Council purchased elements of the original supply in 1968 (excluding the original bore) and the current water scheme developed over several decades with the George St bore drilled in 1971 and the Moore St bore in 1988.
In 1996 the town water supply reticulation was extended to serve the Plan Change 10 scheme area (designed for 4,200 people). The extension included a total revamp of the low level pumping system with the inclusion of a deep well in Karangi Apple Orchard, decommissioning of the reservoir at George Street and increasing operating pressure to 35m (50psi). The new scheme came into operation in June 1997. Universal metering has been in place since 1997.
Further development has included a major pump station (now the main control centre) in Izone Drive (2003), a major reservoir (2003), a new well (Izone Drive, 2004) and a new trunk main (2005/2006).
The
Branthwaite Drive water supply was connected to the Rolleston supply in 2014.
The
Burnham water supply was connected to the Rolleston supply in July 2015. The Burnham system was installed by the Ministry of Defence as a result of a condition imposed by the then North Canterbury Catchment Board (now Environment Canterbury) on the water right issued for the disposal of treated sewage effluent from the Burnham Camp Oxidation Ponds.
The
Armack Drive water supply was connected to the Rolleston supply in July 2017. The water supply for the subdivision was commissioned in 1985. The scheme was designed as a high pressure, unrestricted supply with fire fighting capacity. Water meters were installed in 1993 to help reduce peak water consumption and operating costs. Water usage prior to 1993 was extremely high (40,000m³/year) but with water meters installed this reduced to between 10,000 and 20,000 m3/year.
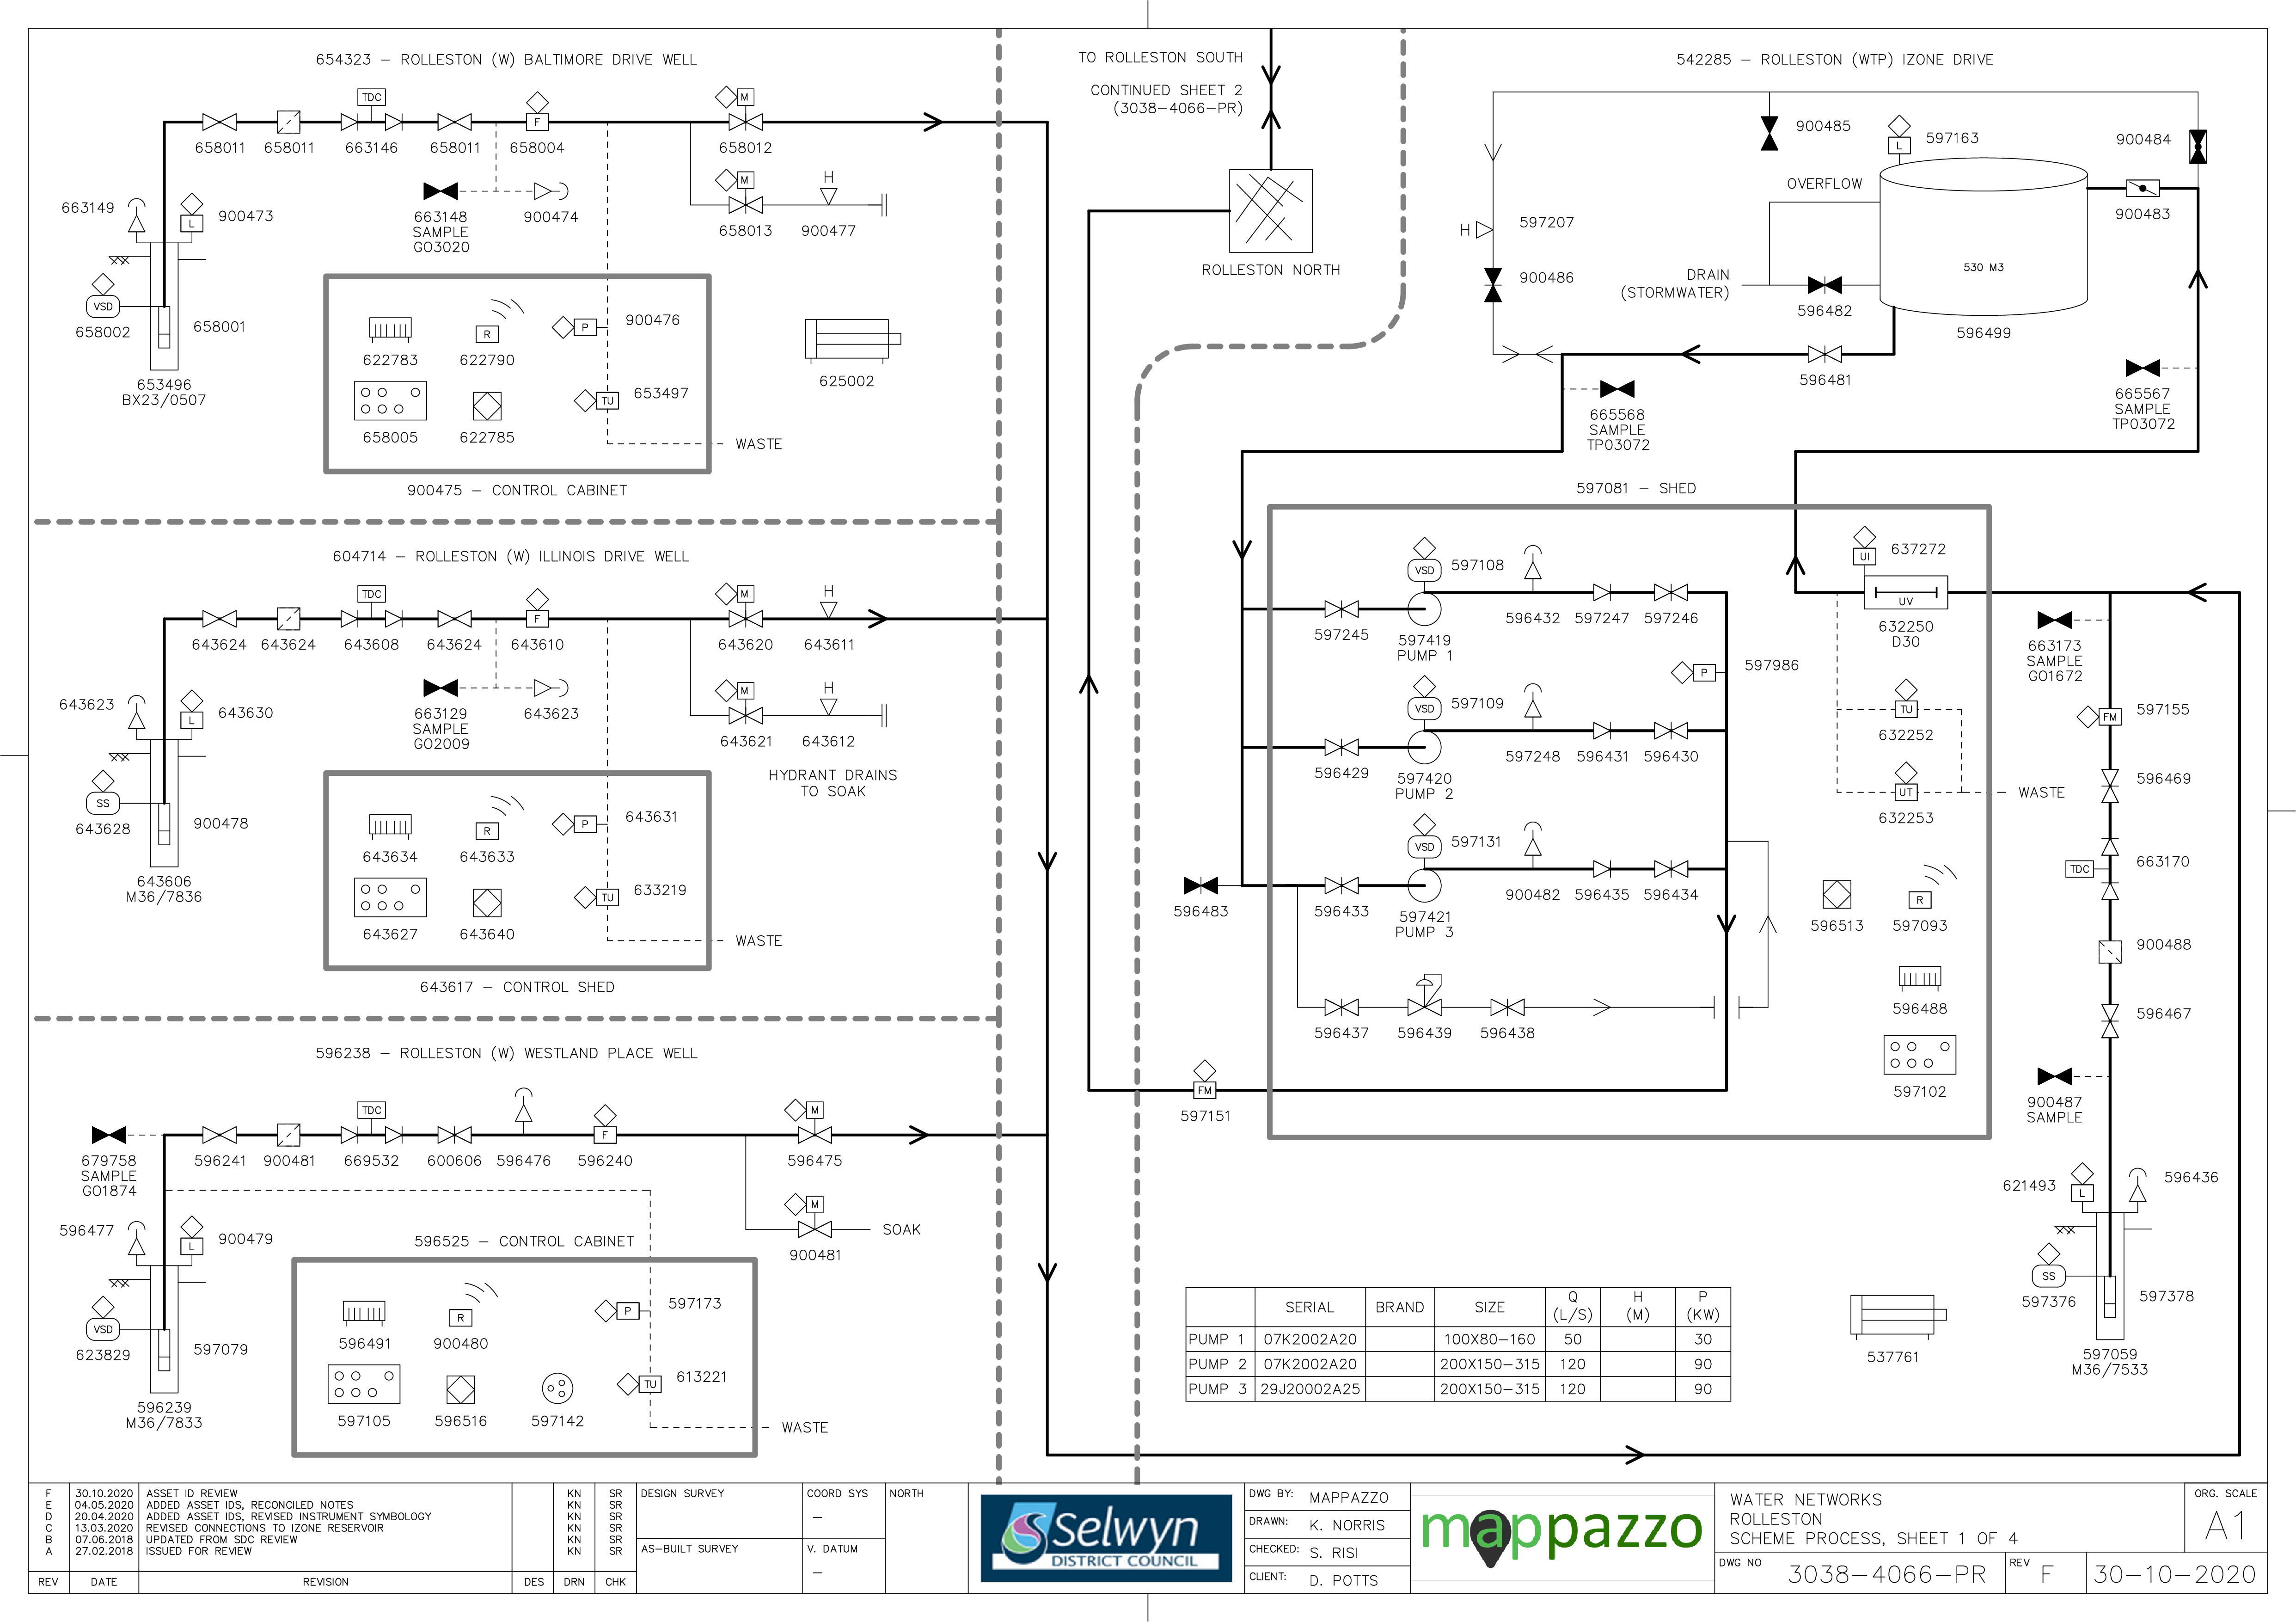
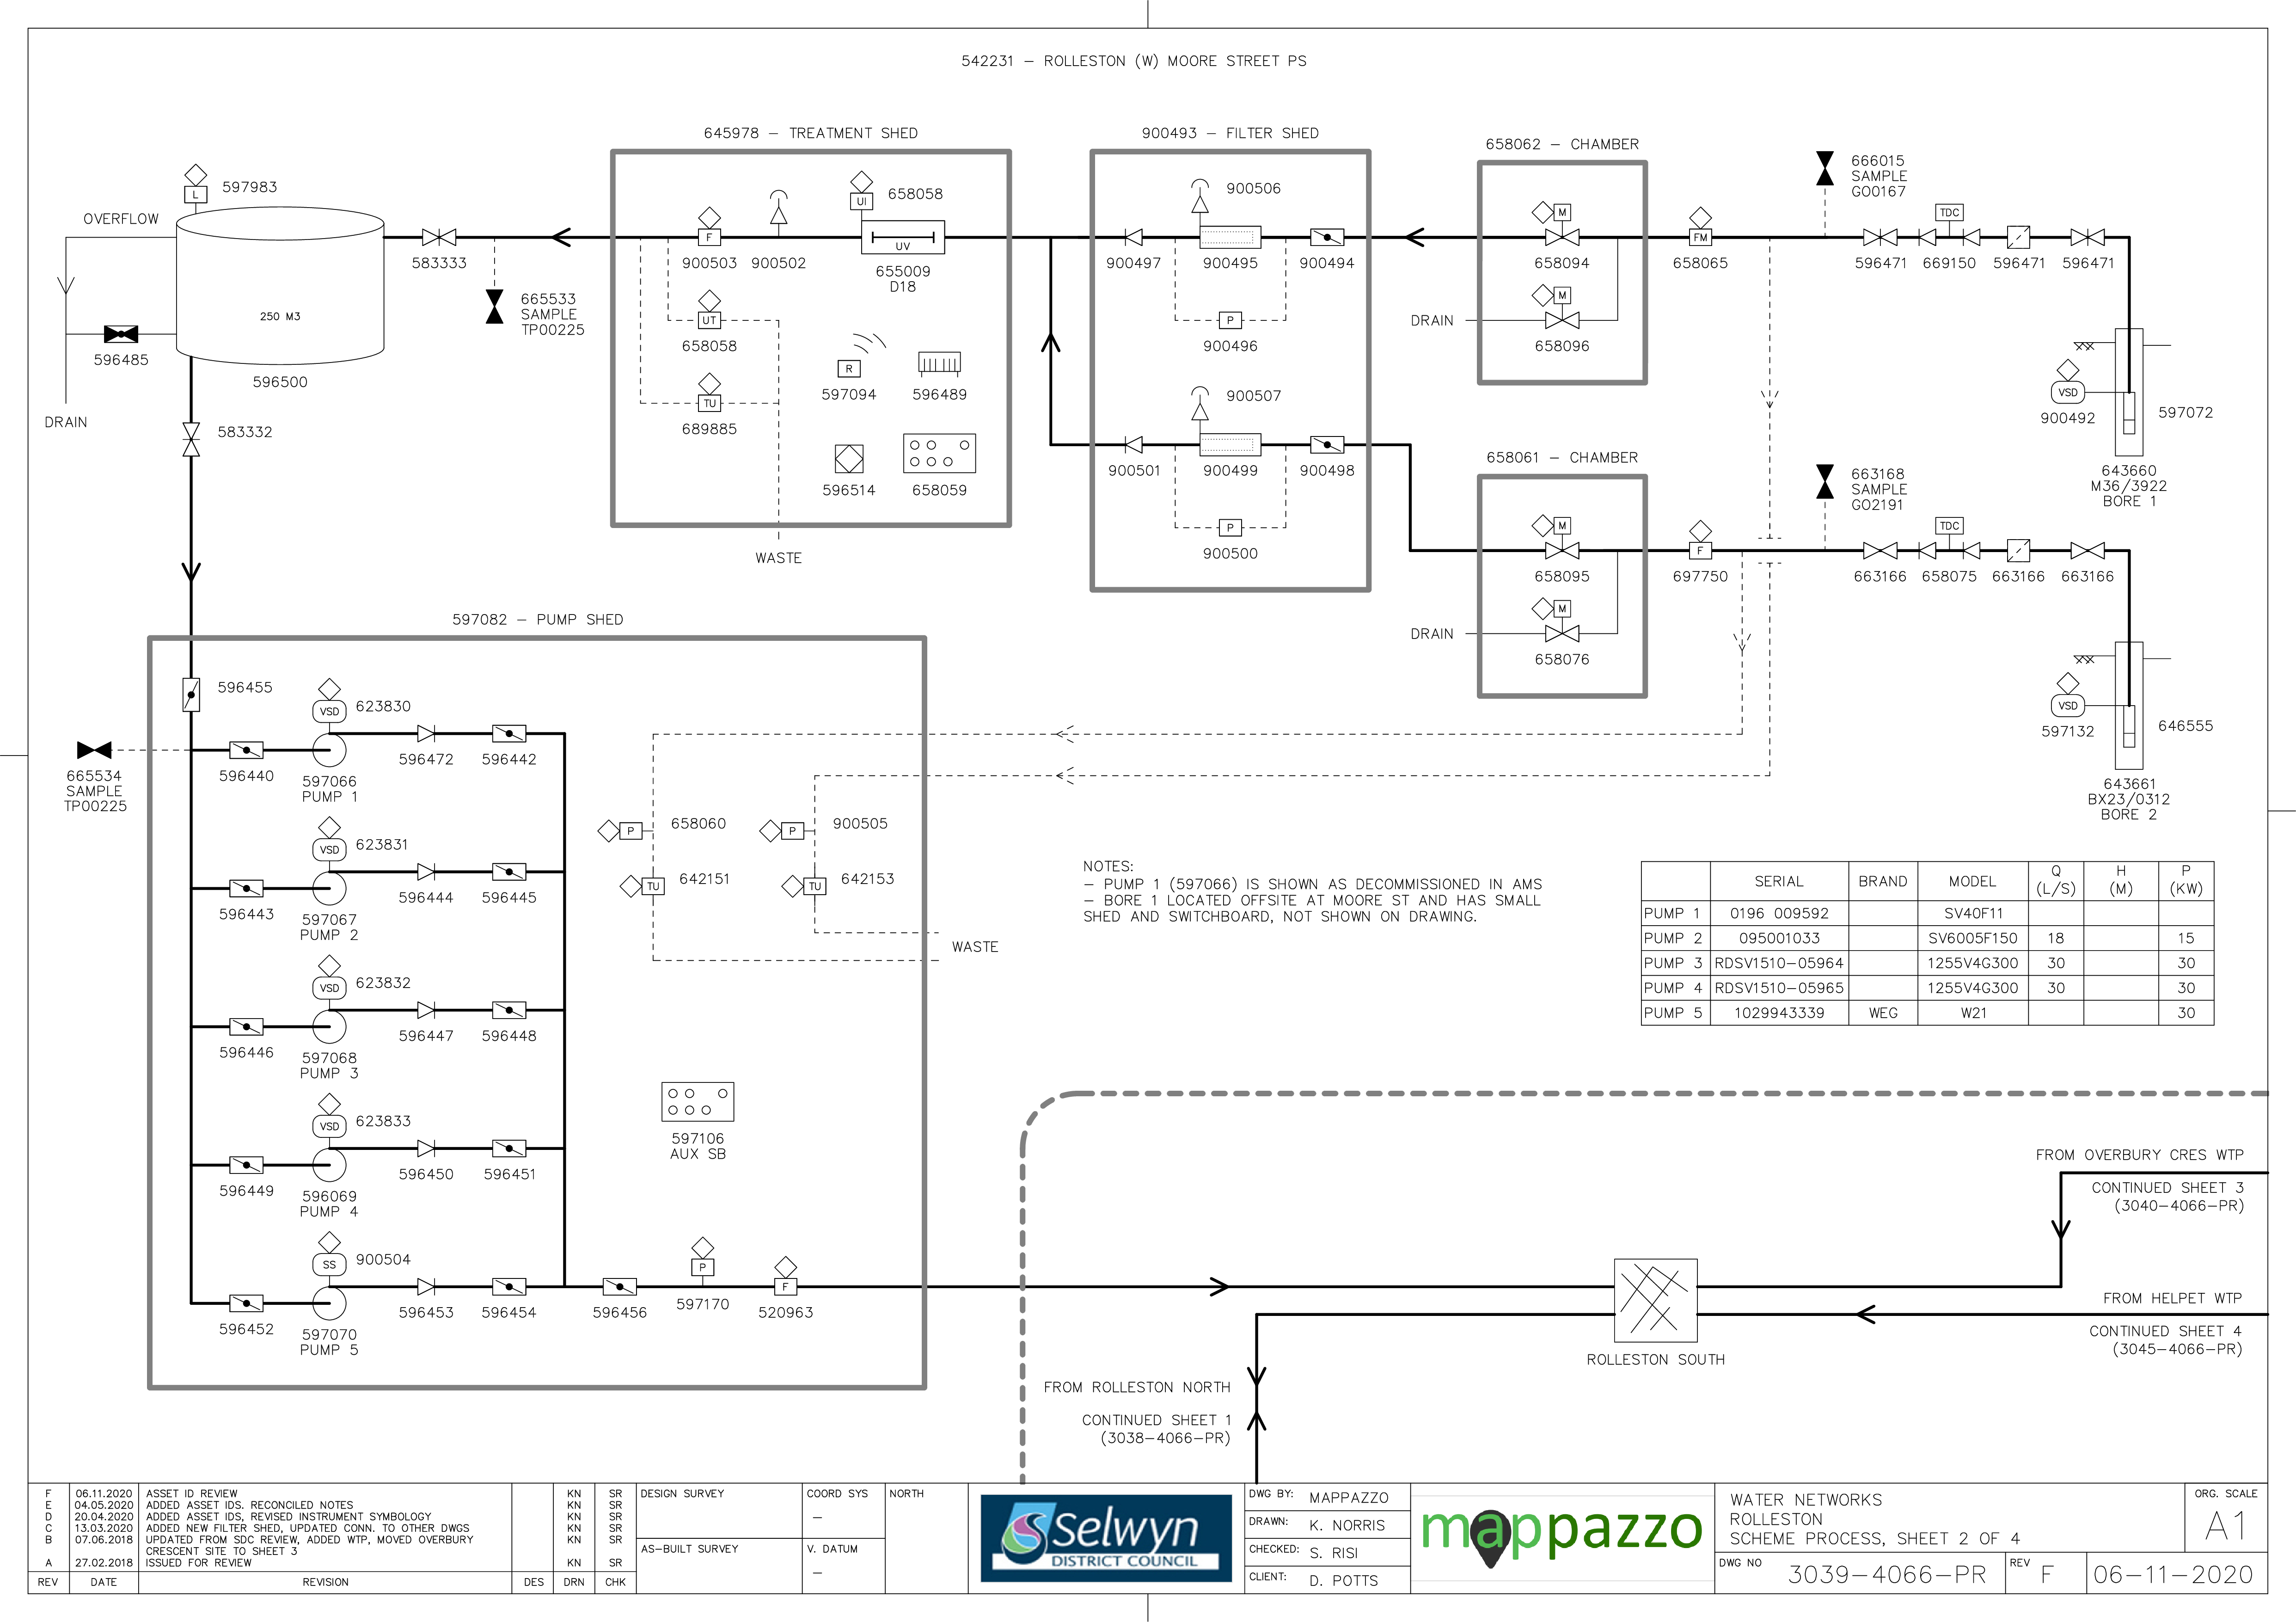
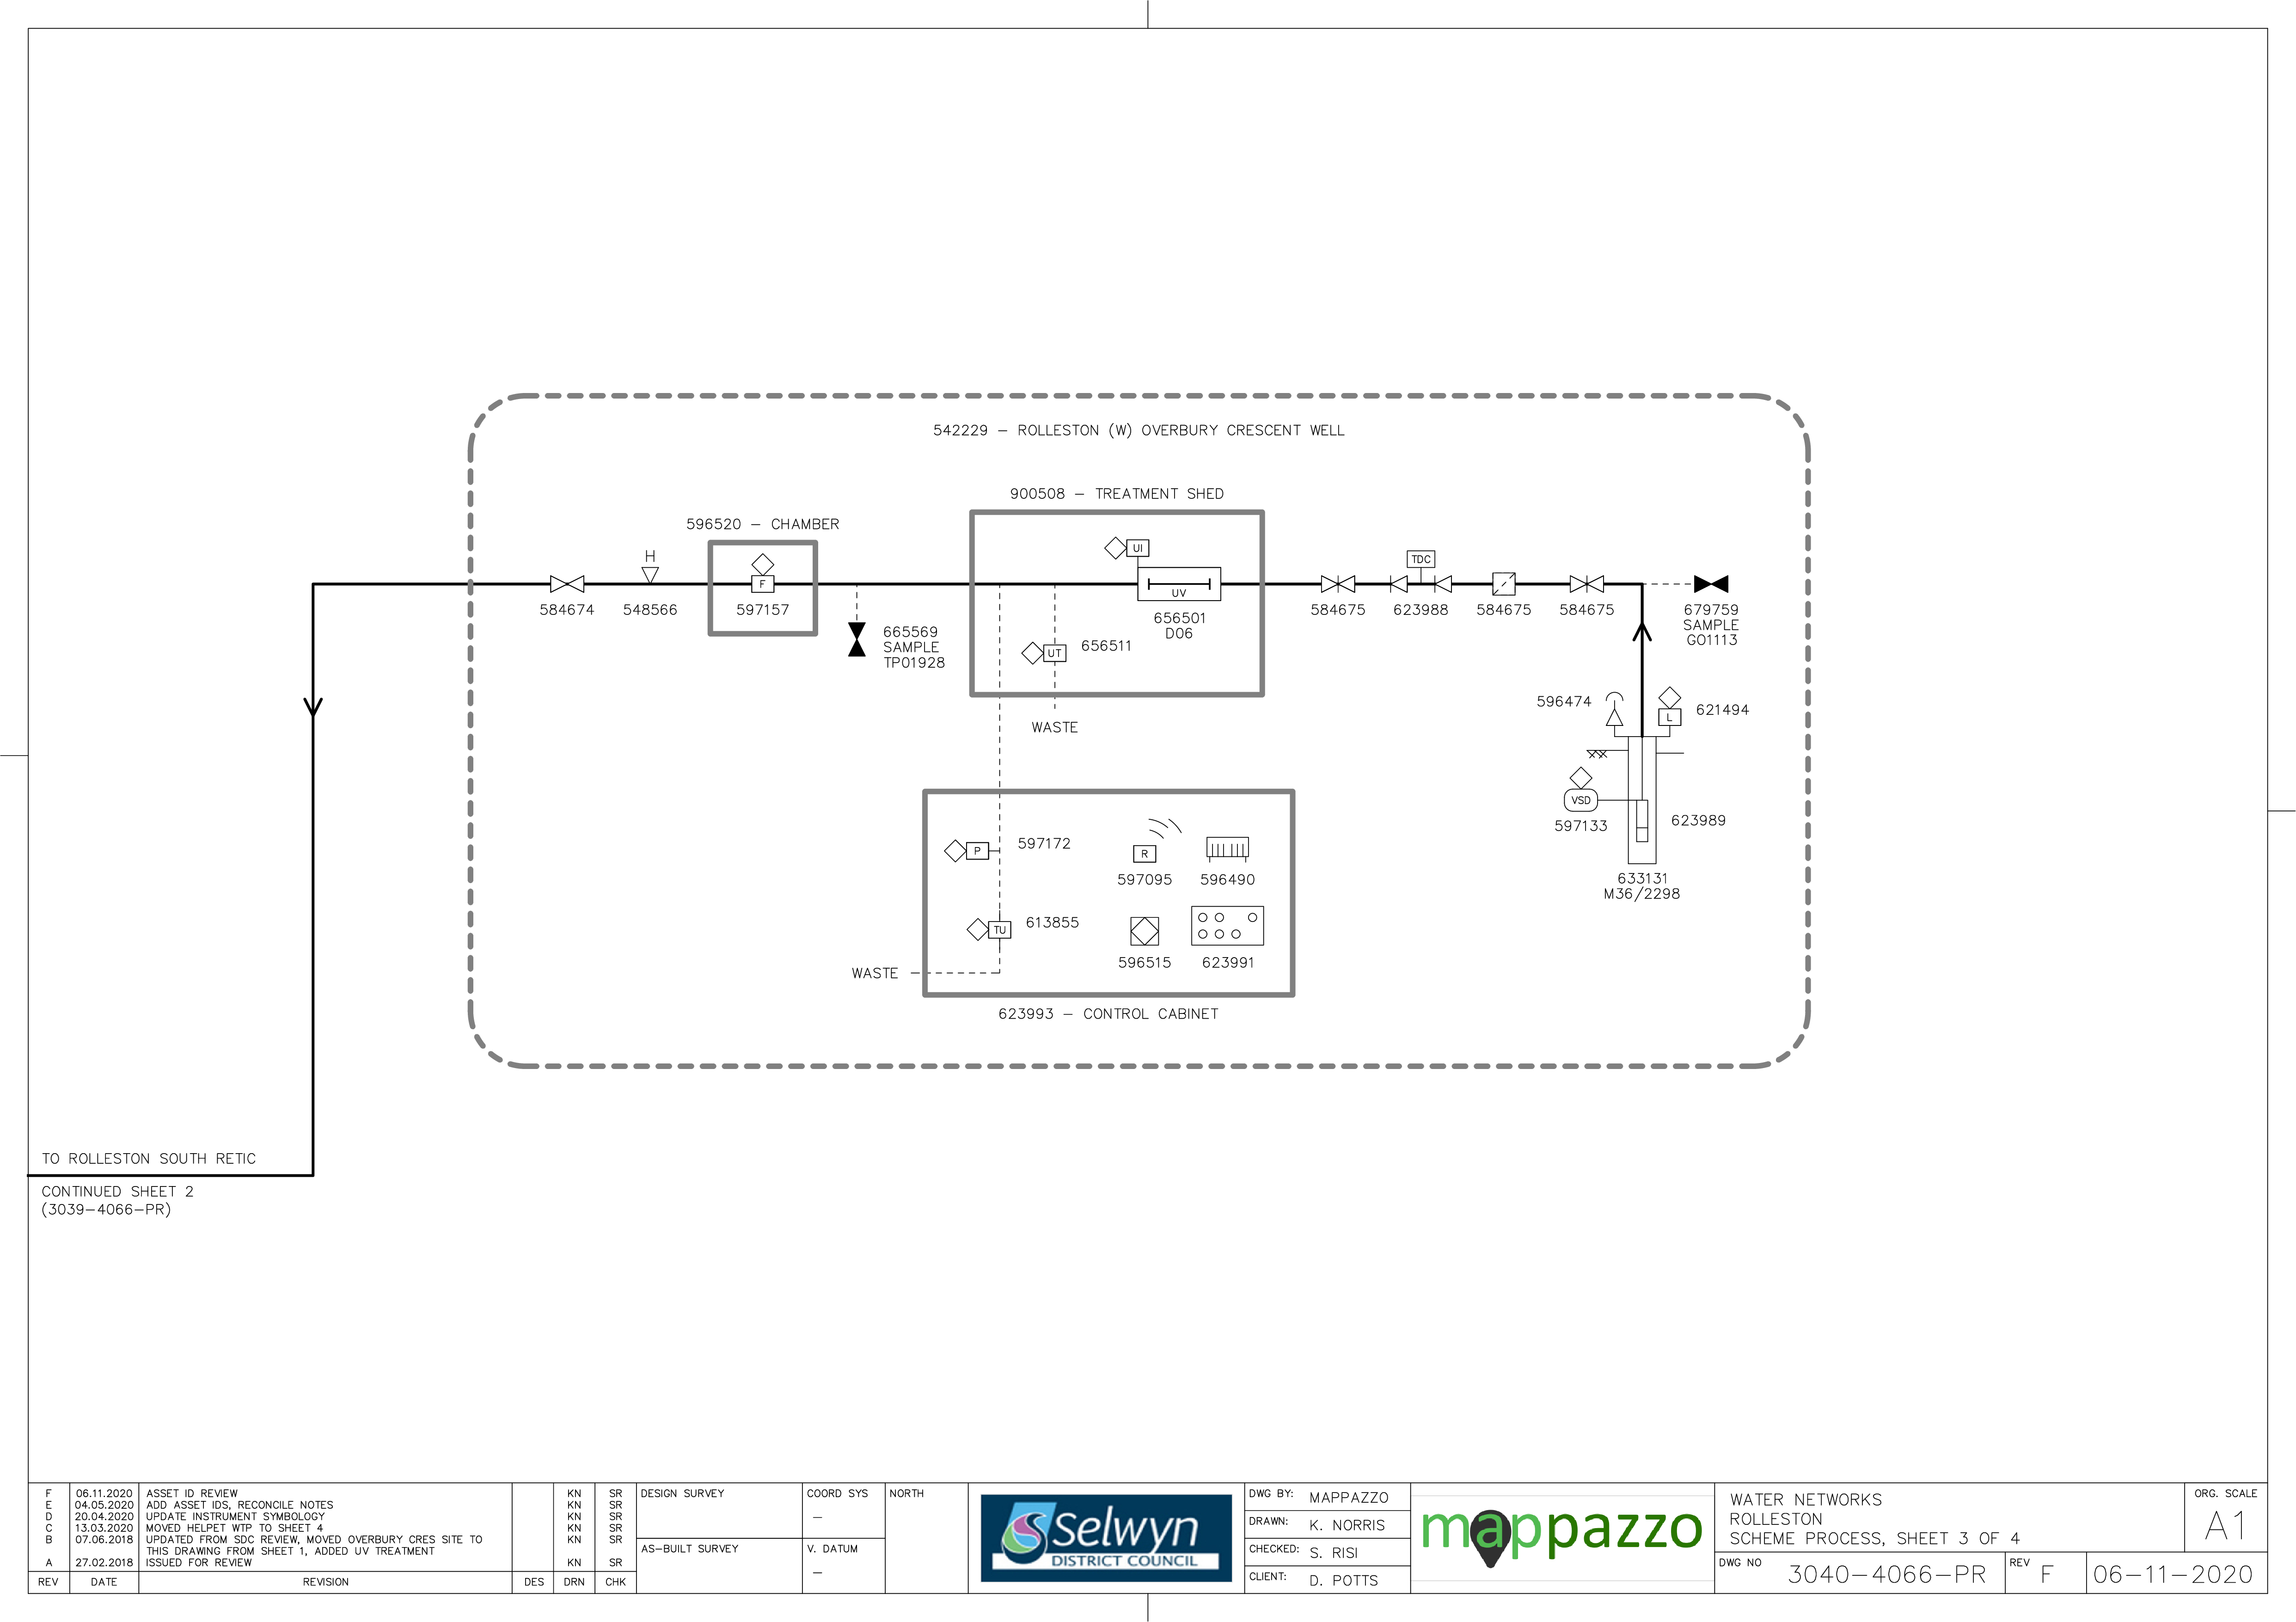
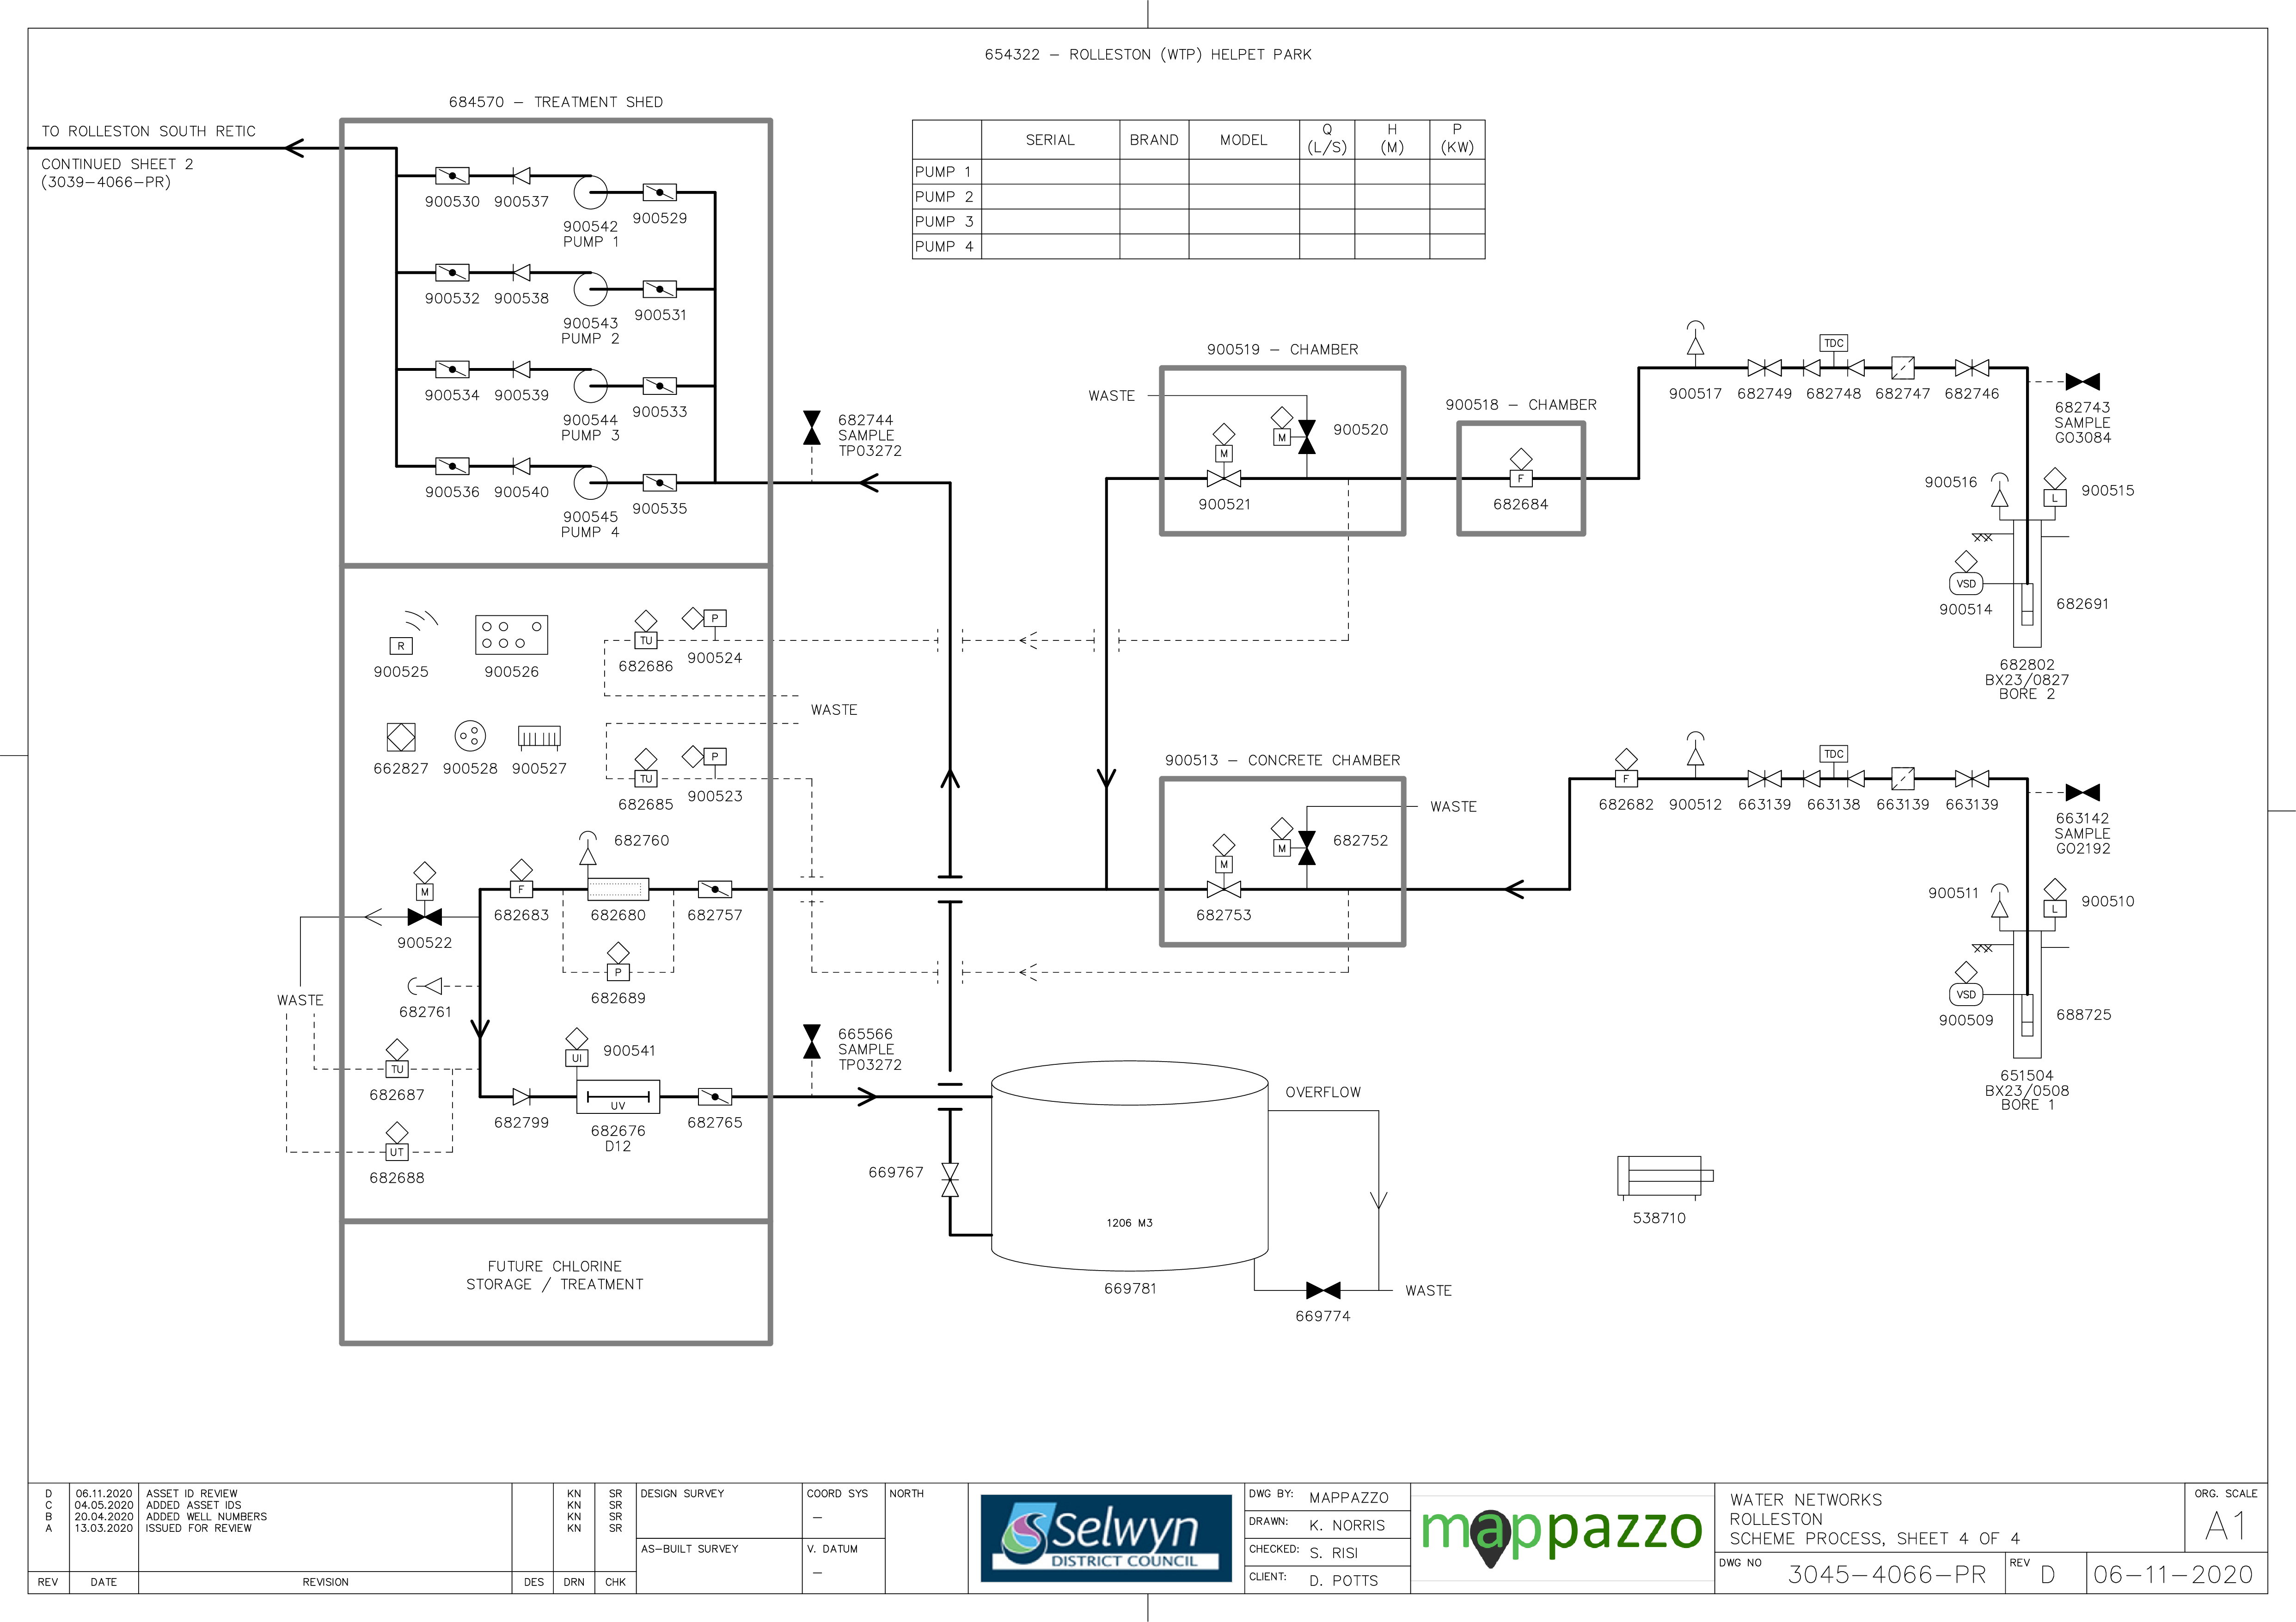
Figure 19‑2 Scheme Schematics x4
19.4 System Capacity
Rolleston is currently experiencing rapid growth with a high number of sub-divisions recently established and a number of new developments set to start within the next 5 years. Figure 19‑3 shows the projected growth in water demand for Rolleston based on the latest housing projections. Table 19-3 shows the projected new wells and reservoirs that will be required to sustain the projected population growth.
The use of existing and additional reservoir storage in Rolleston in the future, depending on the capacity may reduce the total number of wells required and/or defer the timing of new wells. Reservoirs can drop 20% over two hours to buffer peak flows from the well yields. Reservoir flow is calculated as average flow for 20% of the reservoir over 2 hours. This assumes that the surface pump capacity is enough to supply the peak flow. Additional wells are required from 2041. It is proposed the required yield is provided through 4 wells with 45L/s yield each.
The Izone reservoir site designed for 130 years @ 100kPA for fire fighting.
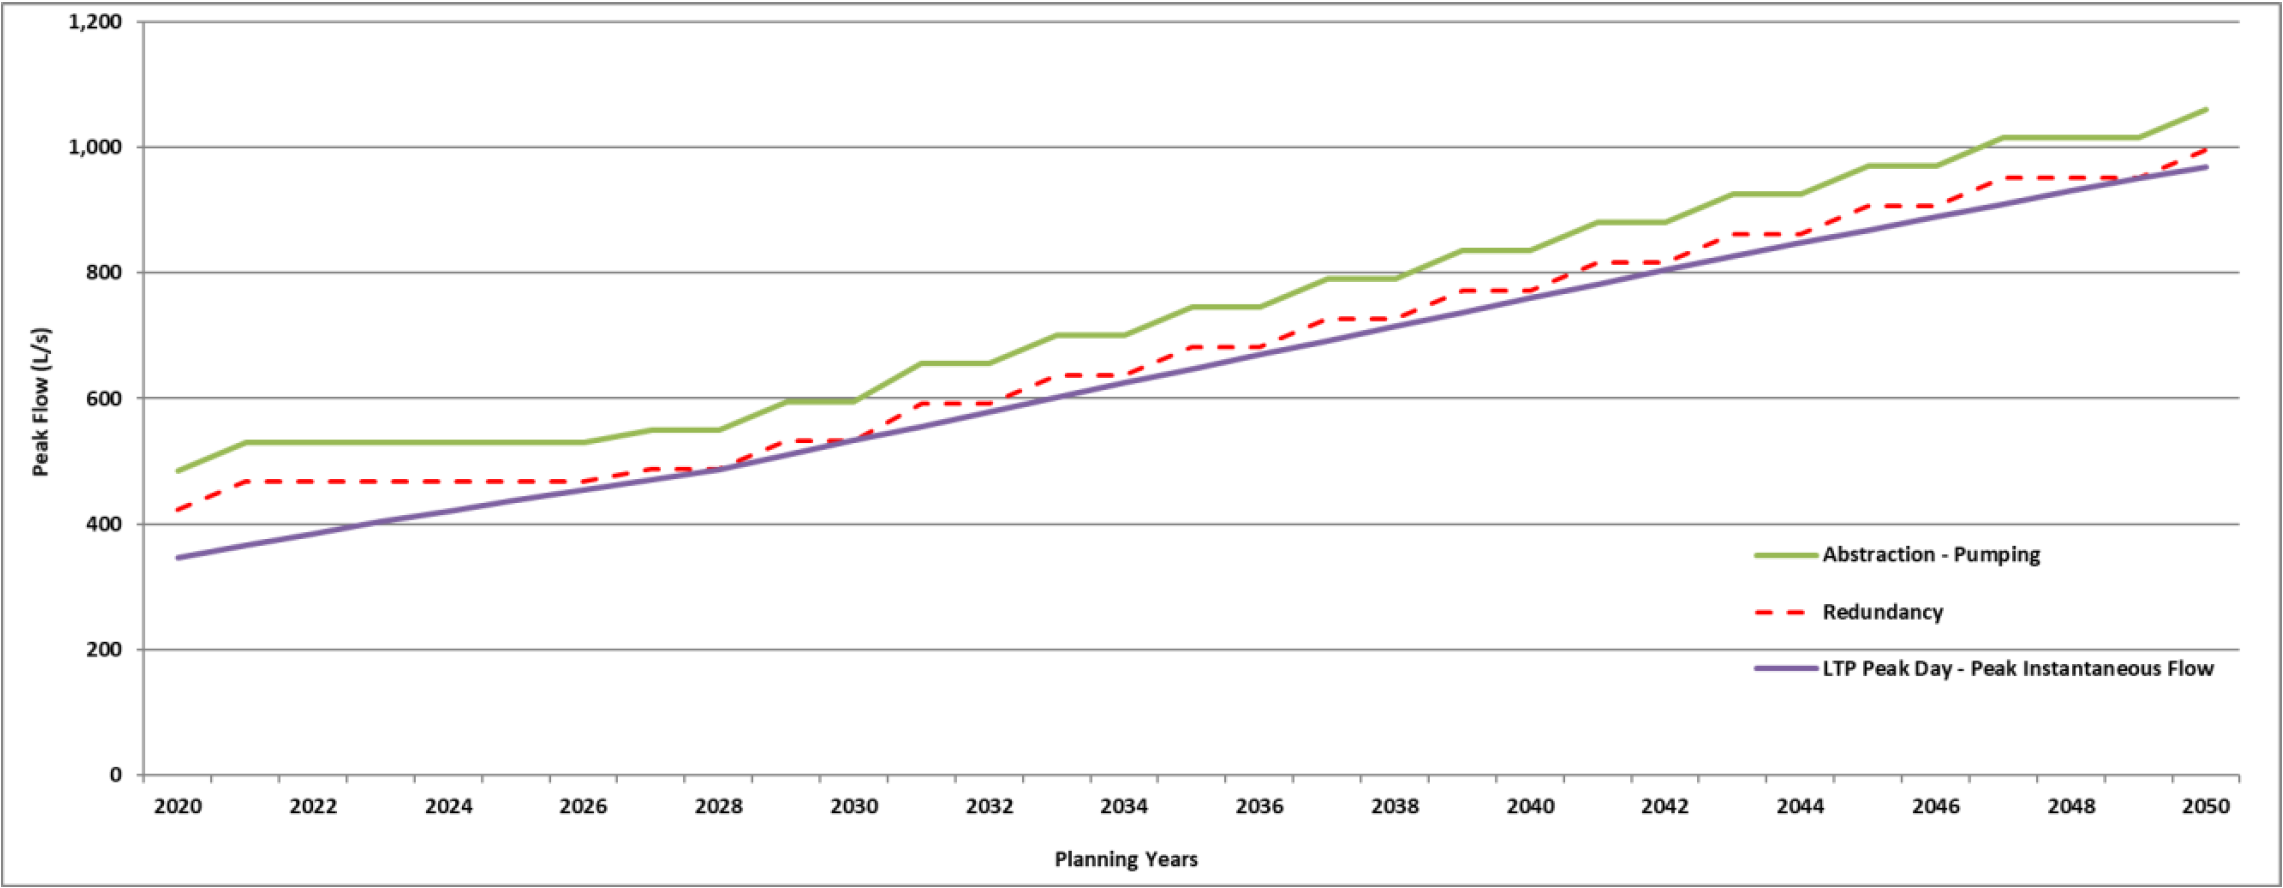
Figure 19‑3 Rolleston Water Demand
Table 19‑2 Existing Water Source Capacity
Izone
| 1 | 63
|
| 2 | 55 (throttled)
|
| 3 | 60
|
4
| 60
|
Res (500 m3)
| 13.9
|
| Moore St | 1
| 55
|
2
| 50
|
Res (250 m3)
| 6.9
|
| Overbury Crescent | 1
| 42
|
Helpet
| 1
| 60 |
2
| 40
|
Table 19‑3 Future Water Source Capacity
Roll1
| Dalwood 1 new well
| 2020/21
| 45
|
Roll 1.1
| Dalwood Res 1 (200 m3)
| 2020/21
| 5.6
|
Roll 6
| Helpet Park Res 1 (1200 m3)
| 2020/21
| 33.33
|
Roll 1.2
| Moore St Res (500 m3)
| 2020/21
| 13.9
|
Roll 4
| McLenaghan Road 1
| 2027/28
| 20
|
Roll 4.1
| McLenaghan Road Res (500 m3)
| 2027/28
| 13.9
|
Roll 6
| Helpet Park 3
| 2028/29
| 45
|
Roll 7
| Detroit 1 new well
| 2030/31
| 60
|
Roll 7.1
| Detroit Res
| 2030/31
| 13.9
|
Roll 9
| Helpet Park 4
| 2033/34
| 45
|
Roll 9.1
| Helpet Park Reservoir 2
| 2033/34
| 33.3
|
Roll 10
| Dalwood 2 new well
| 2036/37
| 45
|
Roll 11
| Levi Road 1
| 2038/39
| 45
|
Roll 12
| Levi Road 2
| 2039/40
| 45
|
Roll 11.1
| Levi Road Reservoir
| 2039/40
| 27.8
|
Additional
| TBC
| 2042/43
| 45
|
Additional
| TBC
| 2044/45
| 45
|
Additional
| TBC
| 2046/47
| 45
|
Additional
| TBC
| 2048/49
| 45
|
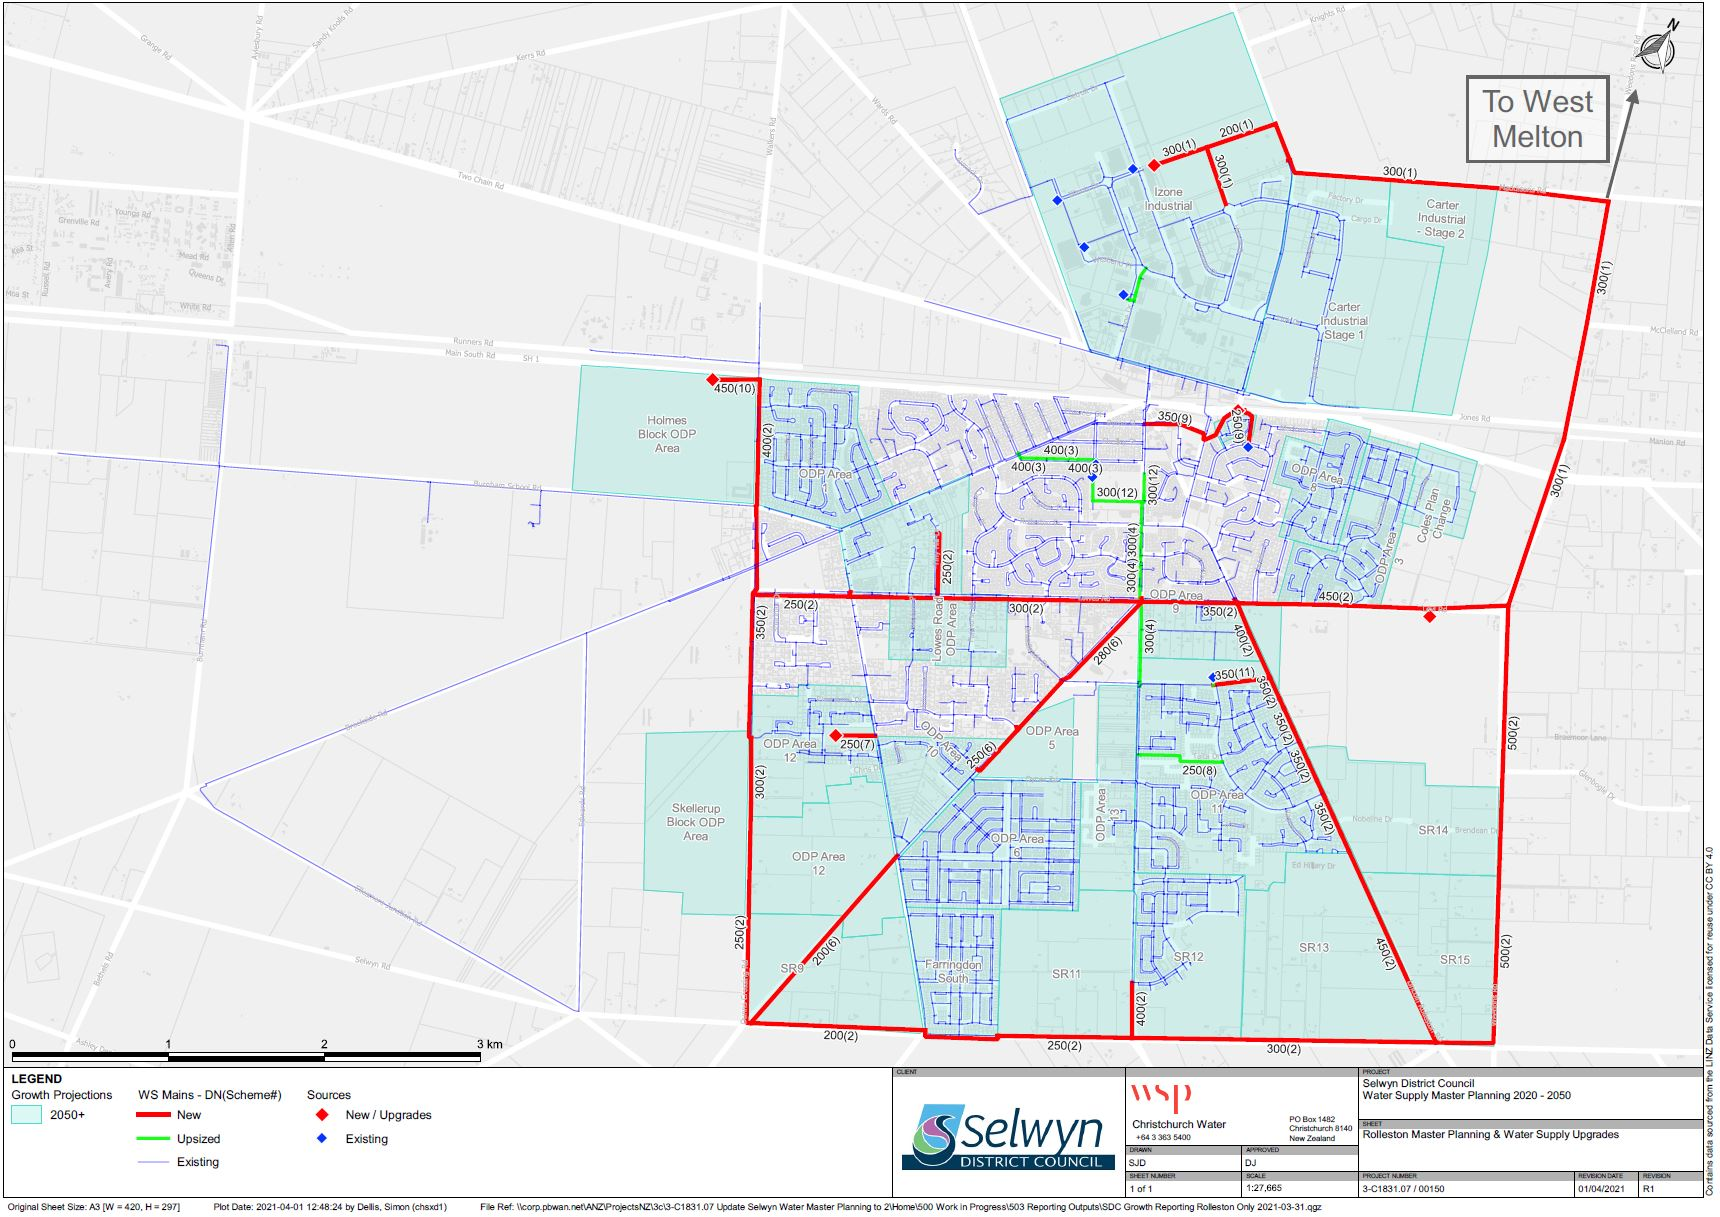
Figure 19‑4 Rolleston Master Plan
19.5 Resource Consents
The Rolleston water supply has a number of resource consents. Table 19‑4 shows the water take permitted by the resource consents for this scheme.
Table 19‑4 Resource Consents
CRC962217
| To take groundwater at or about map reference M36:5981-3441 for public water supply. | Moore Street, ROLLESTON | 2-Sep-96
| 28-Aug-31 | M36/3922
| 55.6
| 4,800 m3/day
|
CRC193859
| To take and use groundwater
| Bracken Common, Rolleston
| 19-Jul-19
| 19-Jan-29
| M36/2298
BX23/0508
BX23/0827
| 52.8
70
70
| Combined volume <739,500m3
between 1 July - 30 June
|
CRC160628
| To take and use groundwater. | George Street and Moore St, ROLLESTON | 26-Aug-02 | 31-Jan-35 | M36/0026
BX23/0312
| 19
100
| Combined volume of 246,240 m3 between 1 July - 30 June
|
CRC175045
| To replace bore. | Izone Drive, ROLLESTON
| 13-Apr-17 | 2-Aug-40 | M36/7533
M36/7833
M36/7834
M36/7835
BX23/0507
| 75
75
75
75
75
(Max combined take of 300L/s)
| 4,445,700 m3 between 1 July - 30 June
|
19.6 Water Quality
The Rolleston water supply has nine wells. Five are currently deemed to be secure (Illinois Drive, Izone Drive, Westland Place, Baltimore Drive, Moore Street No. 1), one has provisional security (Moore Street No. 2), two are deemed non-secure (Overbury Crescent, Helpet No. 1) and one has not yet been assigned a security status (Helpet No. 2). The wells are sampled daily and the reticulation zone is sampled 23 times each month.
The following details E. coli transgressions for the period 2012 to 2020. E. coli was identified in source water (prior to treatment) three times during this period.
Treatment
There have been eleven E. coli treatment transgressions during this period.
Figure 19‑5 E. coli Transgressions - Treatment
Zone
There have been four E. coli transgressions during this period.
Figure
19‑6 E. coli Transgressions - Zone
Chemical Analysis
The following is a summary of the raw water chemical analysis carried out at the Rolleston Water Supply.
Table 19‑5 Raw Water Chemical Analysis Summary: Izone Drive Well
Total Lead (g/m3)
| 0.01 (Maximum
Acceptable Value)
| 0.0001
| 0.00011
| 0.0012
| 0.00011
| 0.00011
| 0.000215
| 0.00011
| ✓
|
pH (pH units)
| 7 - 8.5 (Guideline Value)
| 7.8
| 7.8
| 7.6
| 7.9
| 7.8
| 7.7
| 7.8
| ✓
|
Total Hardness (g/m3 as CaCO3)
| <200 (Guideline Value)
| 38
| 48
| 49
| 50
| 47.3
| 47.9
| 49
| ✓
|
Total Calcium (g/m3)
| None
| 13
| 16.4
| 16.6
| 17
| 16.1
| 16.22
| 16.68
| ✓
|
Total Iron (g/m3)
| <0.2 (Guideline Value)
| 0.02
| 0.021
| 0.021
| 0.021
| 0.021
| 0.021
| 0.021
| ✓
|
Total Sodium (g/m3)
| <200 (Guideline Value)
| 7.1
| 8.2
| 8.4
| 8.4
| 8.25
| 8.04
| 8.19
| ✓
|
Nitrate - Nitrogen (g/m3)
| 11.3 (Maximum
Acceptable Value)
| 2.2
| 2.3
| 2.4
| 2.6
| 2.66
| 2.62
| 2.68
| ✓
|
Table 19‑6 Raw Water Chemical Analysis Summary: Illinois Drive Well
Total Lead (g/m3)
| 0.01 (Maximum Acceptable Value)
| 0.001111
| 0.000253
| 0.000659
| ✓
|
pH (pH units)
| 7 - 8.5 (Guideline Value)
| 7.4
| 7.6
| 7.6
| ✓
|
Total Hardness (g/m3 as CaCO3)
| <200 (Guideline Value)
| 71.5
| 71.3
| 79.2
| ✓
|
Total Calcium (g/m3)
| None
| 21.29
| 20.56
| 23.44
| ✓
|
Total Iron (g/m3)
| <0.2 (Guideline Value)
| 0.594
| 0.141
| 0.19
| X |
Total Sodium (g/m3)
| <200 (Guideline Value)
| 14.24
| 13.92
| 15.14
| ✓
|
Nitrate - Nitrogen (g/m3)
| 11.3 (Maximum Acceptable Value)
| 10.00
| 8.32
| 6.98
| ✓
|
Table 19‑7 Raw Water Chemical Analysis Summary: Baltimore Drive Well
Total Lead (g/m3)
| 0.01 (Maximum Acceptable Value)
| 0.000576
| 0.00011
| ✓
|
pH (pH units)
| 7 - 8.5 (Guideline Value)
| 7.7
| 7.8
| ✓
|
Total Hardness (g/m3 as CaCO3)
| <200 (Guideline Value)
| 49.5
| 50.6
| ✓
|
Total Calcium (g/m3)
| None
| 17.16
| 17.54
| ✓ |
Total Iron (g/m3)
| <0.2 (Guideline Value)
| 0.046
| 0.047
| ✓
|
Total Sodium (g/m3)
| <200 (Guideline Value)
| 9.01
| 9.03
| ✓
|
Nitrate - Nitrogen (g/m3)
| 11.3 (Maximum Acceptable Value)
| 3.53
| 3.81
| ✓
|
Table 19‑8 Raw Water Chemical Analysis Summary: Westland Place Well
Total Lead (g/m3)
| 0.01 (Maximum Acceptable Value)
| 0.00024
| 0.00013
| 0.00036
| 0.00011
| 0.00011
| ✓
|
pH (pH units)
| 7 - 8.5 (Guideline Value)
| 7.8
| 7.7
| 7.8
| 7.8
| 7.8
| ✓
|
Total Hardness (g/m3 as CaCO3)
| <200 (Guideline Value)
| 47
| 47
| 51
| 47.9
| 48.1
| ✓
|
Total Calcium (g/m3)
| None
| 16
| 16.1
| 17.4
| 16.26
| 16.33
| ✓
|
Total Iron (g/m3)
| <0.2 (Guideline Value)
| 0.021
| 0.021
| 0.030
| 0.021
| 0.021
| ✓
|
Total Sodium (g/m3)
| <200 (Guideline Value)
| 8.1
| 8.5
| 10.4
| 8.04
| 8.36
| ✓
|
Nitrate - Nitrogen (g/m3)
| 11.3 (Maximum Acceptable Value)
| 2.5
| 2.5
| 3.7
| 2.73
| 2.81
| ✓
|
Table 19‑9 Raw Water Chemical Analysis Summary: Moore Street Well No. 1
Total Lead (g/m3)
| 0.01 (Maximum
Acceptable Value)
| 0.0001
| 0.00011
| 0.00011
| 0.00017
| 0.00011
| 0.00011
| 0.00011
| ✓
|
pH (pH units)
| 7 - 8.5 (Guideline Value)
| 7.7
| 7.6
| 7.7
| 7.9
| 7.8
| 7.8
| 7.8
| ✓
|
Total Hardness (g/m3 as CaCO3)
| <200 (Guideline Value)
| 44
| 47
| 48
| 49
| 46.8
| 48
| 46
| ✓
|
Total Calcium (g/m3)
| None
| 14
| 15.1
| 15.7
| 15.9
| 15.29
| 15.49
| 15.07
| ✓
|
Total Iron (g/m3)
| <0.2 (Guideline Value)
| 0.055
| 0.04
| 0.021
| 0.021
| 0.021
| 0.021
| 0.021
| ✓
|
Total Sodium (g/m3)
| <200 (Guideline Value)
| 7.2
| 7.7
| 7.7
| 7.8
| 7.94
| 7.59
| 7.9
| ✓
|
Nitrate - Nitrogen (g/m3)
| 11.3 (Maximum
Acceptable Value)
| 1.2
| 1.34
| 1.27
| 1.33
| 1.44
| 1.51
| 1.43
| ✓
|
Table 19‑10 Raw Water Chemical Analysis Summary: Moore Street Well No. 2
Total Lead (g/m3)
| 0.01 (Maximum Acceptable Value)
| 0.00011
| 0.00011
| 0.00011
| ✓
|
pH (pH units)
| 7 - 8.5 (Guideline Value)
| 7.8
| 7.7
| 7.9
| ✓
|
Total Hardness (g/m3 as CaCO3)
| <200 (Guideline Value)
| 46.9
| 49.1
| 46.8
| ✓
|
Total Calcium (g/m3)
| None
| 15.83
| 16.93
| 15.70
| ✓
|
Total Iron (g/m3)
| <0.2 (Guideline Value)
| 0.028
| 0.055
| 0.021
| ✓
|
Total Sodium (g/m3)
| <200 (Guideline Value)
| 7.99
| 8.91
| 8.13
| ✓
|
Nitrate - Nitrogen (g/m3)
| 11.3 (Maximum Acceptable Value)
| 1.78
| 3.19
| 2.04
| ✓ |
Table 19‑11 Raw Water Chemical Analysis Summary: Overbury Crescent Well
Total Lead (g/m3)
| 0.01 (Maximum
Acceptable Value)
| 0.0001
| 0.00011
| 0.00011
| 0.00011
| 0.00011
| 0.00011
| 0.00011
| ✓
|
pH (pH units)
| 7 - 8.5 (Guideline Value)
| 7.1
| 7.7
| 7.5
| 7.8
| 7.8
| 7.7
| 7.8
| ✓
|
Total Hardness (g/m3 as CaCO3)
| <200 (Guideline Value)
| 47
| 54
| 56
| 57
| 56.1
| 59.2
| 57.4
| ✓
|
Total Calcium (g/m3)
| None
| 14
| 18
| 18.4
| 18.7
| 18.71
| 19.4
| 19.2
| ✓
|
Total Iron (g/m3)
| <0.2 (Guideline Value)
| 0.02
| 0.021
| 0.021
| 0.021
| 0.021
| 0.021
| 0.021
| ✓
|
Total Sodium (g/m3)
| <200 (Guideline Value)
| 12
| 10.2
| 10.6
| 10.8
| 10.89
| 10.57
| 10.94
| ✓
|
Nitrate - Nitrogen (g/m3)
| 11.3 (Maximum
Acceptable Value)
| 3.6
| 3.4
| 3.7
| 3.8
| 4.0
| 4.39
| 4.16
| ✓
|
Table 19‑12 Raw Water Chemical Analysis Summary: Helpet 1 Well
Total Lead (g/m3)
| 0.01 (Maximum Acceptable Value)
| 0.00018
| 0.000325
| ✓
|
pH (pH units)
| 7 - 8.5 (Guideline Value)
| 7.8
| 7.8
| ✓
|
Total Hardness (g/m3 as CaCO3)
| <200 (Guideline Value)
| 53.4
| 48.6
| ✓
|
Total Calcium (g/m3)
| None
| 17.39
| 15.82
| ✓
|
Total Iron (g/m3)
| <0.2 (Guideline Value)
| 0.021
| 0.021
| ✓
|
Total Sodium (g/m3)
| <200 (Guideline Value)
| 9.56
| 8.67
| ✓
|
Nitrate - Nitrogen (g/m3)
| 11.3 (Maximum Acceptable Value)
| 2.79
| 1.97
| ✓
|
A summary of material and diameter for pipes in Figure 19‑7 and Figure 19‑8.
Figure 19‑7 Pipe Material – Rolleston
Figure 19‑8 Pipe Diameter – Rolleston
19.8 Operational Management
The water supply is operated and maintained under two maintenance contracts as follows:
- Contract 1241: Water Services Contract. Contract is with SICON who undertakes investigations, conditions inspections, proactive and reactive maintenance and minor asset renewals; and
- Contract 1202: Parks and Reserves Contract. Contract is with SICON who undertakes the maintenance of land scape features related to water services e.g. mowing, gardens etc.
Water quality sampling is completed under an agreement with Food and Health Ltd as required.
19.9 Photos of Main Assets
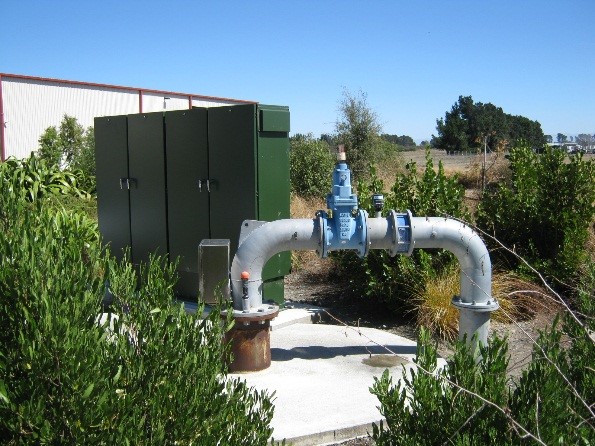
Photo 1: Westland Place Well Head
|
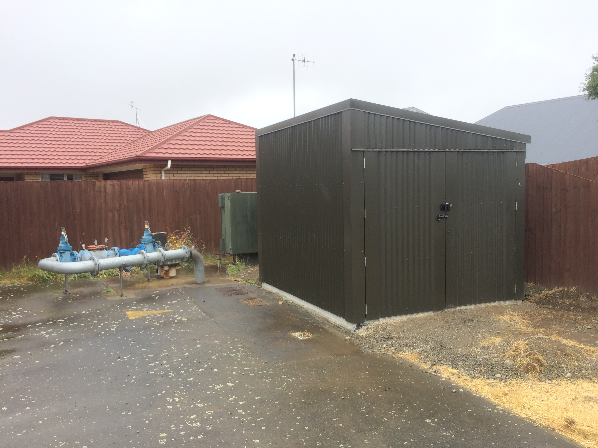
Photo 2: Overbury Cr UV Shed
|
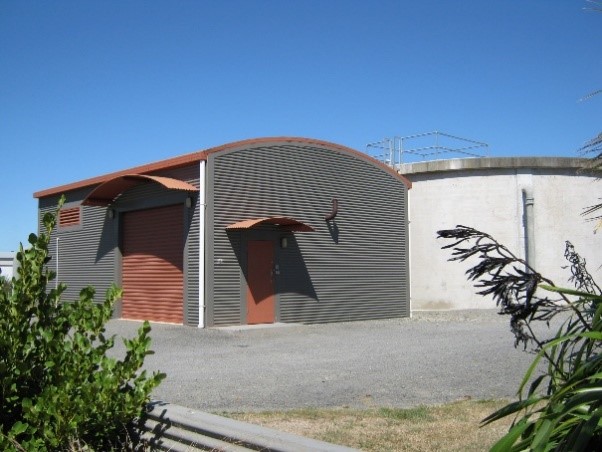
Photo 3: Izone Reservoir and Pump Station
|
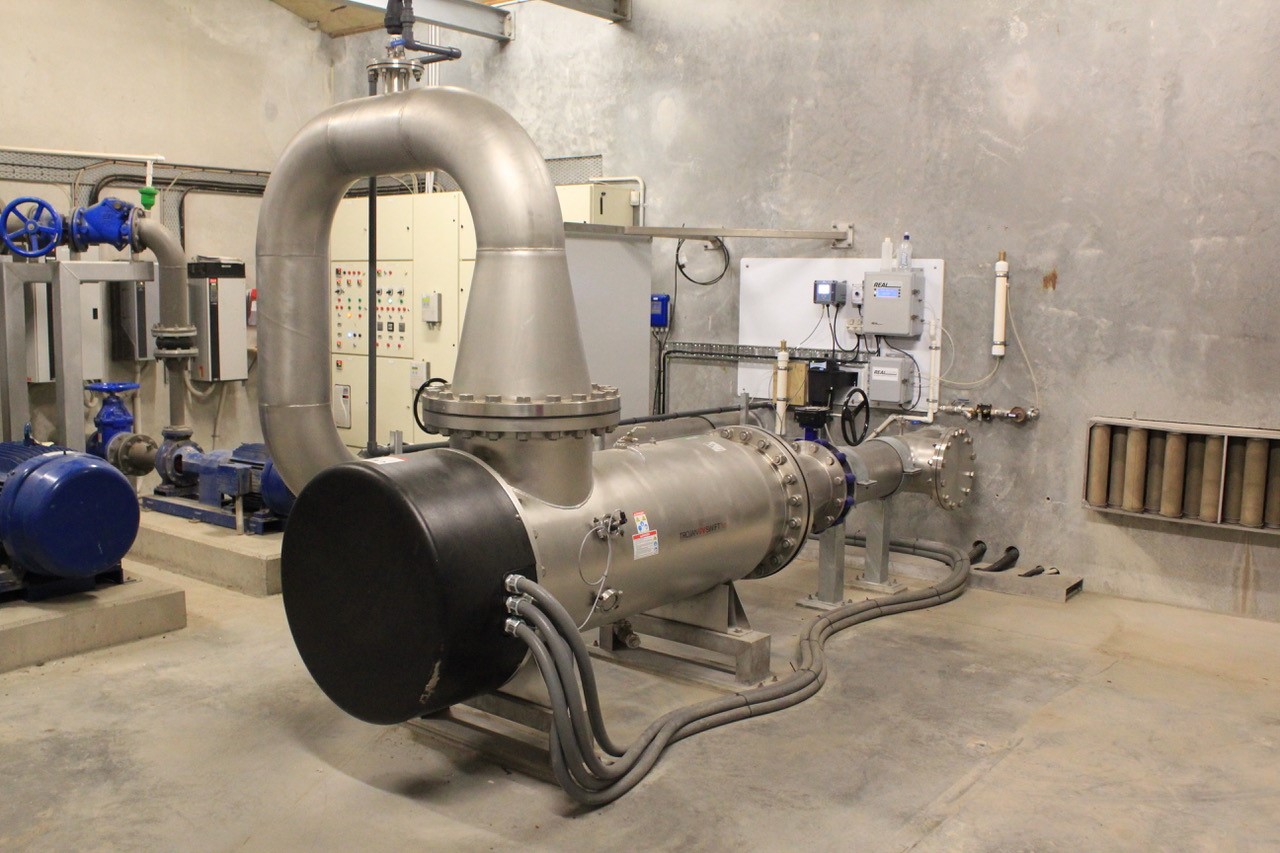
Photo 4: Izone UV
|

Photo 4: Helpet Bore
| 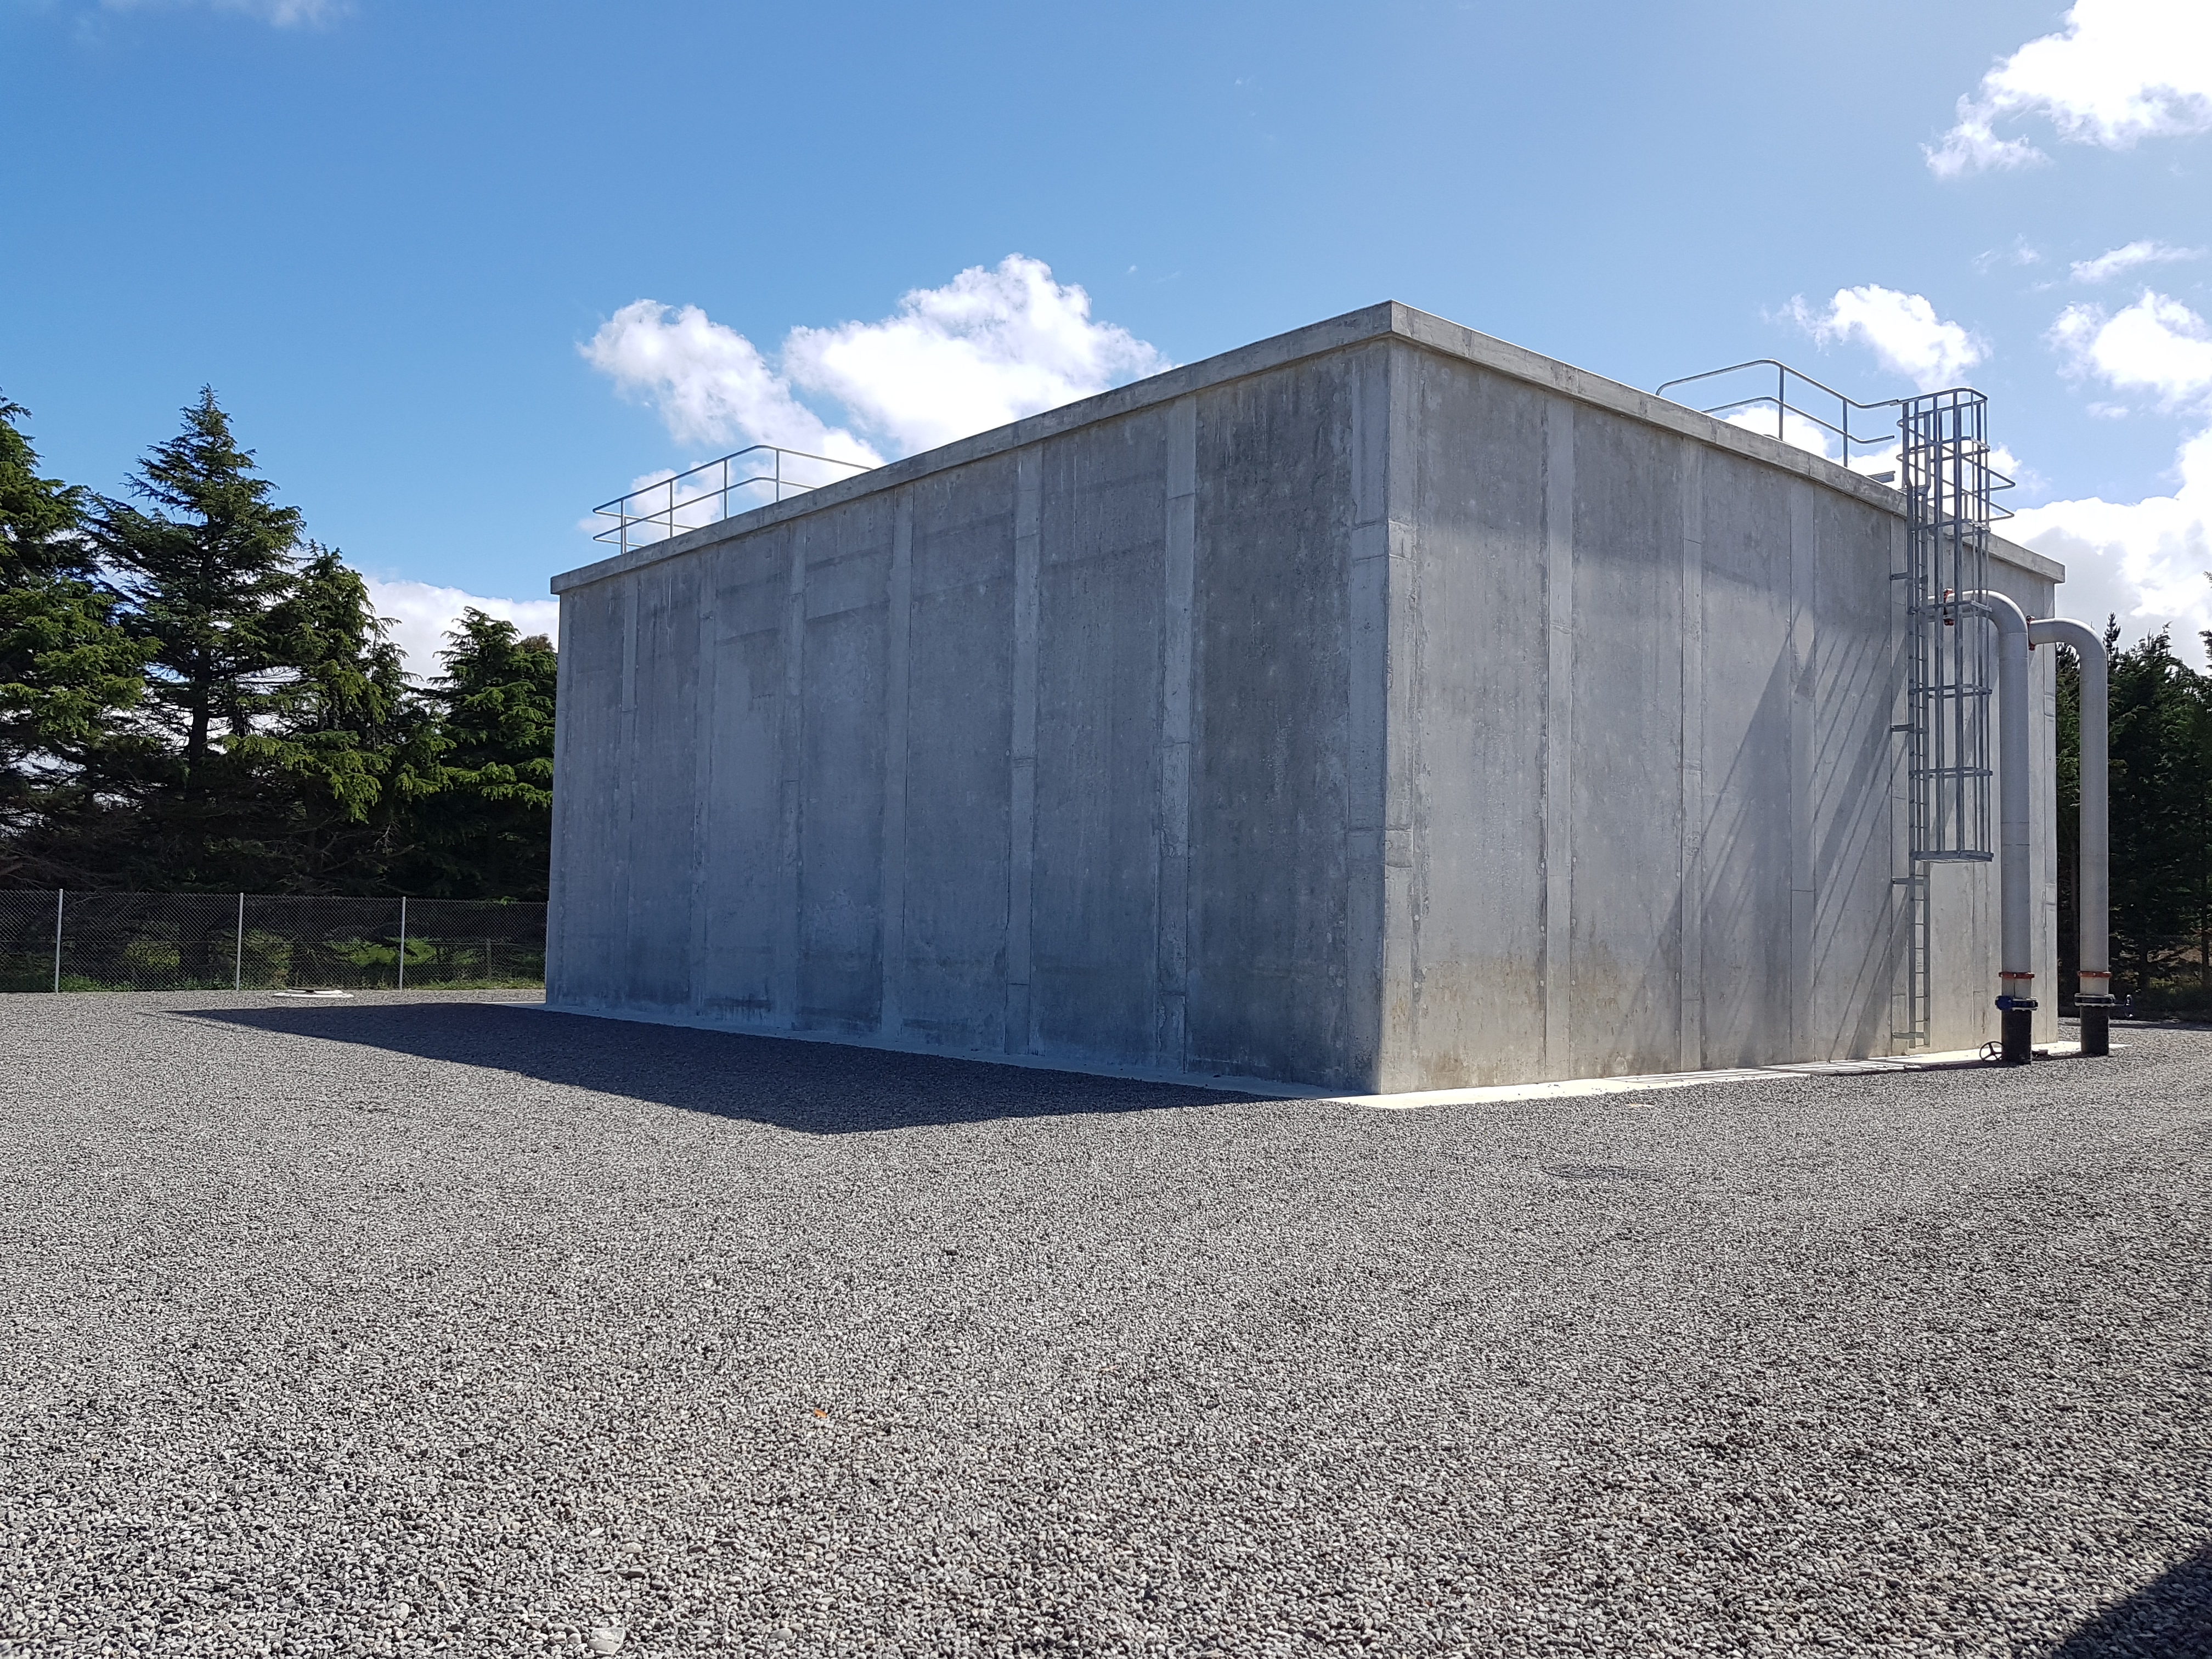
Photo 5: Helpet Res
|
19.10 Risk Assessment
A risk assessment has been undertaken for the Rolleston scheme. The key output from the risk assessment is the identification of any extreme and high risks which need to be mitigated. In order to mitigate these risks they have been included and budgeted for in the projects within this LTP. Table 19‑13 outlines the risk priority rating, Table 19‑14 outlines the risks and the list of key projects is found in Table 19‑19.
Table 19‑13 Risk Priority Rating
| > 50 | Extreme | Awareness of the event to be reported to Council. Urgent action to eliminate / mitigate / manage the risk. Document risk and action in the AMP. |
| 35-50 | Very High | Risk to be eliminated / mitigated / managed through normal business planning processes with responsibility assigned. |
| 14-35 | High | Manage risk using routine procedures. |
| 3.5-14 | Moderate | Monitor the risk. |
| < 3.5 | Low | Awareness of the event to be reported to Council. Immediate action required to eliminate / mitigate / manage the risk. Document risk and action in the AMP. |
Table 19‑14 Risks – Rolleston
| Risks associated with disused well | Decommission George St Well | 2014 | 12 | 0.6 | 0.6 |
| Inadequate turnover of Branthwaite Drive reservoir during times of low demand | Look at Branthwaite Drive reservoir turnover, if pump shed and reservoir is kept, install flush valve as required | 2014 | 20
| 1 | 1 |
| Electrical failure due to lightning or network spikes | Install surge diverters | 2014 | 50 | 5 | 5 |
| Failure to meet NES water meter standards | NES Water Meter Compliance | 2014 | 20 | 6 | 6 |
| Inability to collect income from non-metered properties | Install property water meters | 2014 | 45 | 0.6 | 0.6 |
| Non-compliance with the DWSNZ | DWSNZ - Age Testing | 2014 | 50 | 0.7 | 0.7 |
| Non-compliance with the DWSNZ | DWSNZ - Bore-head security | 2014 | 50 | 50 | 50 |
| Non-consented activities | Renewal of consents | 2014 | 27 | 27 | 6 |
The list of district wide risks can be found in 5Waters Activity Management Plan: Volume 1.
19.11 Asset Valuation Details
The total replacement value of assets within the Rolleston water scheme is $50,877,472 with further details in Table 19‑15 below.
Table 19‑15 Replacement Value, Rolleston
Plant and Equipment
| $5,959,527
|
Water Reticulation
| Fire | $9,159
|
| Hydrant | $2,489,638
|
| Lateral | $1,481,988
|
| Pipe | $31,519,200
|
| Supply Point | $6,195,622
|
| Valve | $3,210,509
|
19.12 Renewals
The renewal profile has been taken from the 2019 5 Waters Valuation. A graph showing the renewals for this scheme are shown by Figure 19‑9 below. The majority renewals occur in the first 15 years.
Figure 19‑9 Rolleston Water Renewal Profile
19.13 Critical Assets
The criticality model for Rolleston has been updated for the 2021 AcMP. The methodology of the criticality model can be found in 5Waters Activity Management Plan: Volume 1 and it provides details of how the criticality has been calculated for the reticulation assets. Table 19‑16 and Figure 19‑10 below shows the calculated criticality for all of the assets within this scheme that have a recorded known length.
Table 19‑16 Length of Assets per Criticality Level
5
| Low | 193,892
|
4
| Medium-Low | 60,563
|
3
| Medium | 62,860
|
2
| Medium-High | 26,280
|
1
| High | 20,623
|
19.14 Asset Condition
The asset condition model was run for Rolleston in 2021. The methodology of the model can be found in 5Waters Activity Management Plan: Volume 1 which provides details of how the model has been calculated for the pipe reticulation assets. Figure 19‑11 below shows the level of asset condition for these assets within this scheme that have a recorded known condition.
Table 19‑17 provides a description of the condition rating used within the condition model.
Table 19‑17 Asset Condition Grading
| 1.0 | Excellent |
| 2.0 | Good |
| 3.0 | Moderate |
| 4.0 | Poor |
| 5.0+ | Fail |
The number of pipe faults is also measured through the asset management system. Figure 19‑12 shows the known historic pipe failures within this scheme.
19.15 Funding Program
The 10 year budgets for Rolleston are shown by Table 19‑18. Budgets are split into expenditure, renewals, projects and capital projects. Expenditure and renewals have been reported on a district-wide basis in Volume 1.
All figures are ($) not adjusted for CPI “inflation". They are calculated on historical data, and population growth where relevant.
Table 19‑18 Rolleston Budget Summary
| 2021/2022 | $52,500
| $968,475
|
| 2022/2023 | -
| $1,609,330
|
| 2023/2024 | -
| $1,500,000
|
| 2024/2025 | -
| $863,300
|
| 2025/2026 | -
| $3,116,270
|
| 2026/2027 | -
| $638,855
|
2027/2028
| -
| $527,895
|
2028/2029
| -
| $530,975
|
2029/2030
| -
| $896,650
|
2030/2031
| -
| $250,000
|
Total
| $52,500
| $10,954,250
|
An explanation of the categories within the budgets are as follows below:
-
Expenditure consists of operation and maintenance costs;
-
Renewals are replacement of assets which are nearing or exceeded their useful life;
-
Projects are investigations, decisions and planning activities which exclude capital works; and
-
Capital projects are activities involving physical works.
There are several major projects for Rolleston water scheme in the LTP budget (Table 19-19).
Table 19‑19 Key Projects
| Capital Projects | 406690002 | Rolleston Growth
| $808,475
| $1,524,330
| $900,000
| $6,423,945
| 100% G
|
Capital Projects
| TBC
| Generator at Moore Street WTP
| -
| -
| $100,000
| -
| 100% LoS
|
Capital Projects
| TBC
| Overbury bore - connect to new site
| -
| -
| -
| $400,000
| 100% LoS
|
Capital Projects
| TBC
| Implement zoning
| $10,000
| - | $200,000
| -
| 100% LoS
|
Capital Projects
| TBC
| Pressure sensors in network
| -
| $75,000
| -
| -
| 100% LoS
|
Capital Projects
| TBC
| Screening to separate Helpet WTP from the storage reservoir
| $50,000
| -
| -
| -
| 100% LoS
|
Capital Projects
| TBC
| Upgrades required to gain borehead security
| $50,000
| -
| -
| - | 100% LoS
|
Capital Projects
| TBC
| Filtration at Izone WTP
| -
| $10,000
| $300,000
| -
| 100% LoS
|
* Where LoS refers to Level of Service and G refers to Growth
The list of district wide projects can be found in 5Waters Activity Management Plan: Volume 1.
Discussion on Projects
Projects have been determined based on their:
- Relevance to the scheme
- Requirement to be completed under legislation
- Ability to bring the scheme up to or maintain the Level of Service required under council's Asset Management Policy.
Many projects are jointly funded by more than one scheme and activity. Each scheme pays a pro-rata share only, equivalent to the number of connections.
Discussion on Capital and Projects
Where relevant, Capital (Levels of Service) and Capital (Growth) projects have been included in the scheme financial details.
Levels of Service Projects and growth splits have been provided to ensure the costs of population driven works are clear.
<<
5-Waters Volume 2 - Water Supplies


