<<
5-Waters Volume 2 - Water Supplies
18 Raven Drive Water Supply
18.1 Scheme Summary
| Estimated Population Served | 35
|
Scheme Coverage (1 Jan 2021)
| Full Charges | 12
|
| Half Charges | 0 |
| >1 Charges | 0
|
System Components
| Bores/Intakes (No.) | 1
|
Treatment/Disinfection
| 1
|
| Reservoirs (No.) | 0
|
| Pump Stations (No.) | 1
|
| Piped (m) | 860
|
| History | Original scheme installation date | 1995 |
Value ($)
| Replacement Cost | $347,971
|
| Depreciated Replacement Cost | $185,709
|
Financial
| Operator cost (scheduled and reactive maintenance) per connection
| $2,388.05/connection
|
Demand (m3) (1 Jan – 31 Dec 2020)
| Average daily | 16.5
|
| Peak daily | 59.6
|
| Minimum daily | -
|
| Average daily per connection | 0.97
|
| Type of Supply | | Unrestricted tank supply
|
Target Pressure & Flow at boundary
| Pressure
| Timer on, Pressure off |
| Flow | >40L/min |
| Sustainability | Well Security | Secure |
18.2 Key Issues
The following key issues are associated with the Raven Drive water supply. A list of district wide issues are located in 5Waters Activity Management Plan: Volume 1.
Table 18‑1 Raven Drive Scheme Issues
| Due to the Raven Drive's distance from the maintenance contractor's base the cost of operation and maintenance is high. | Council will investigate the potential for enhanced remote monitoring. |
| To provide adequate fire fighting storage. Four in ground tanks (22.7m3 each) were installed in the Raven Drive Water Supply, however these need to be maintained. | Council will assess the condition of the tanks and develop scheduled maintenance tasks to ensure the tanks remain in good repair and water quality is not compromised. Council will also ensure that the tanks are fitted with easy accessible couplings to NZ Fire Service specifications. |
| Bore near agriculture land use | Provide additional treatment barriers |
18.3 Overview & History
The Raven Drive water supply was installed in 1995, the same the year the subdivision was developed. Council took over the operation and administration of the scheme in 1996.
The system originally had a dionisation system with filters, a backwash reservoir and a pump. The system was removed in March 2008 as it had not been used for a number of years and the iron levels had consistently been lower for some time. The backwash reservoir remains but is not in use.
Raven Drive Water Supply provides untreated groundwater to a subdivision located adjacent to Gould's Road and 1.5km east of Springston-Rolleston Road (see schematics). There are 13 sections varying from 1.5ha to 3ha and in general land is used as a “lifestyle" and not as a farm related business.
The scheme was designed and operates as an unrestricted, metered tank supply. Each property must have a storage tank (minimum of 2m3) to receive the Council water supply. The owner is then responsible for pumping the water from the tank for property use.
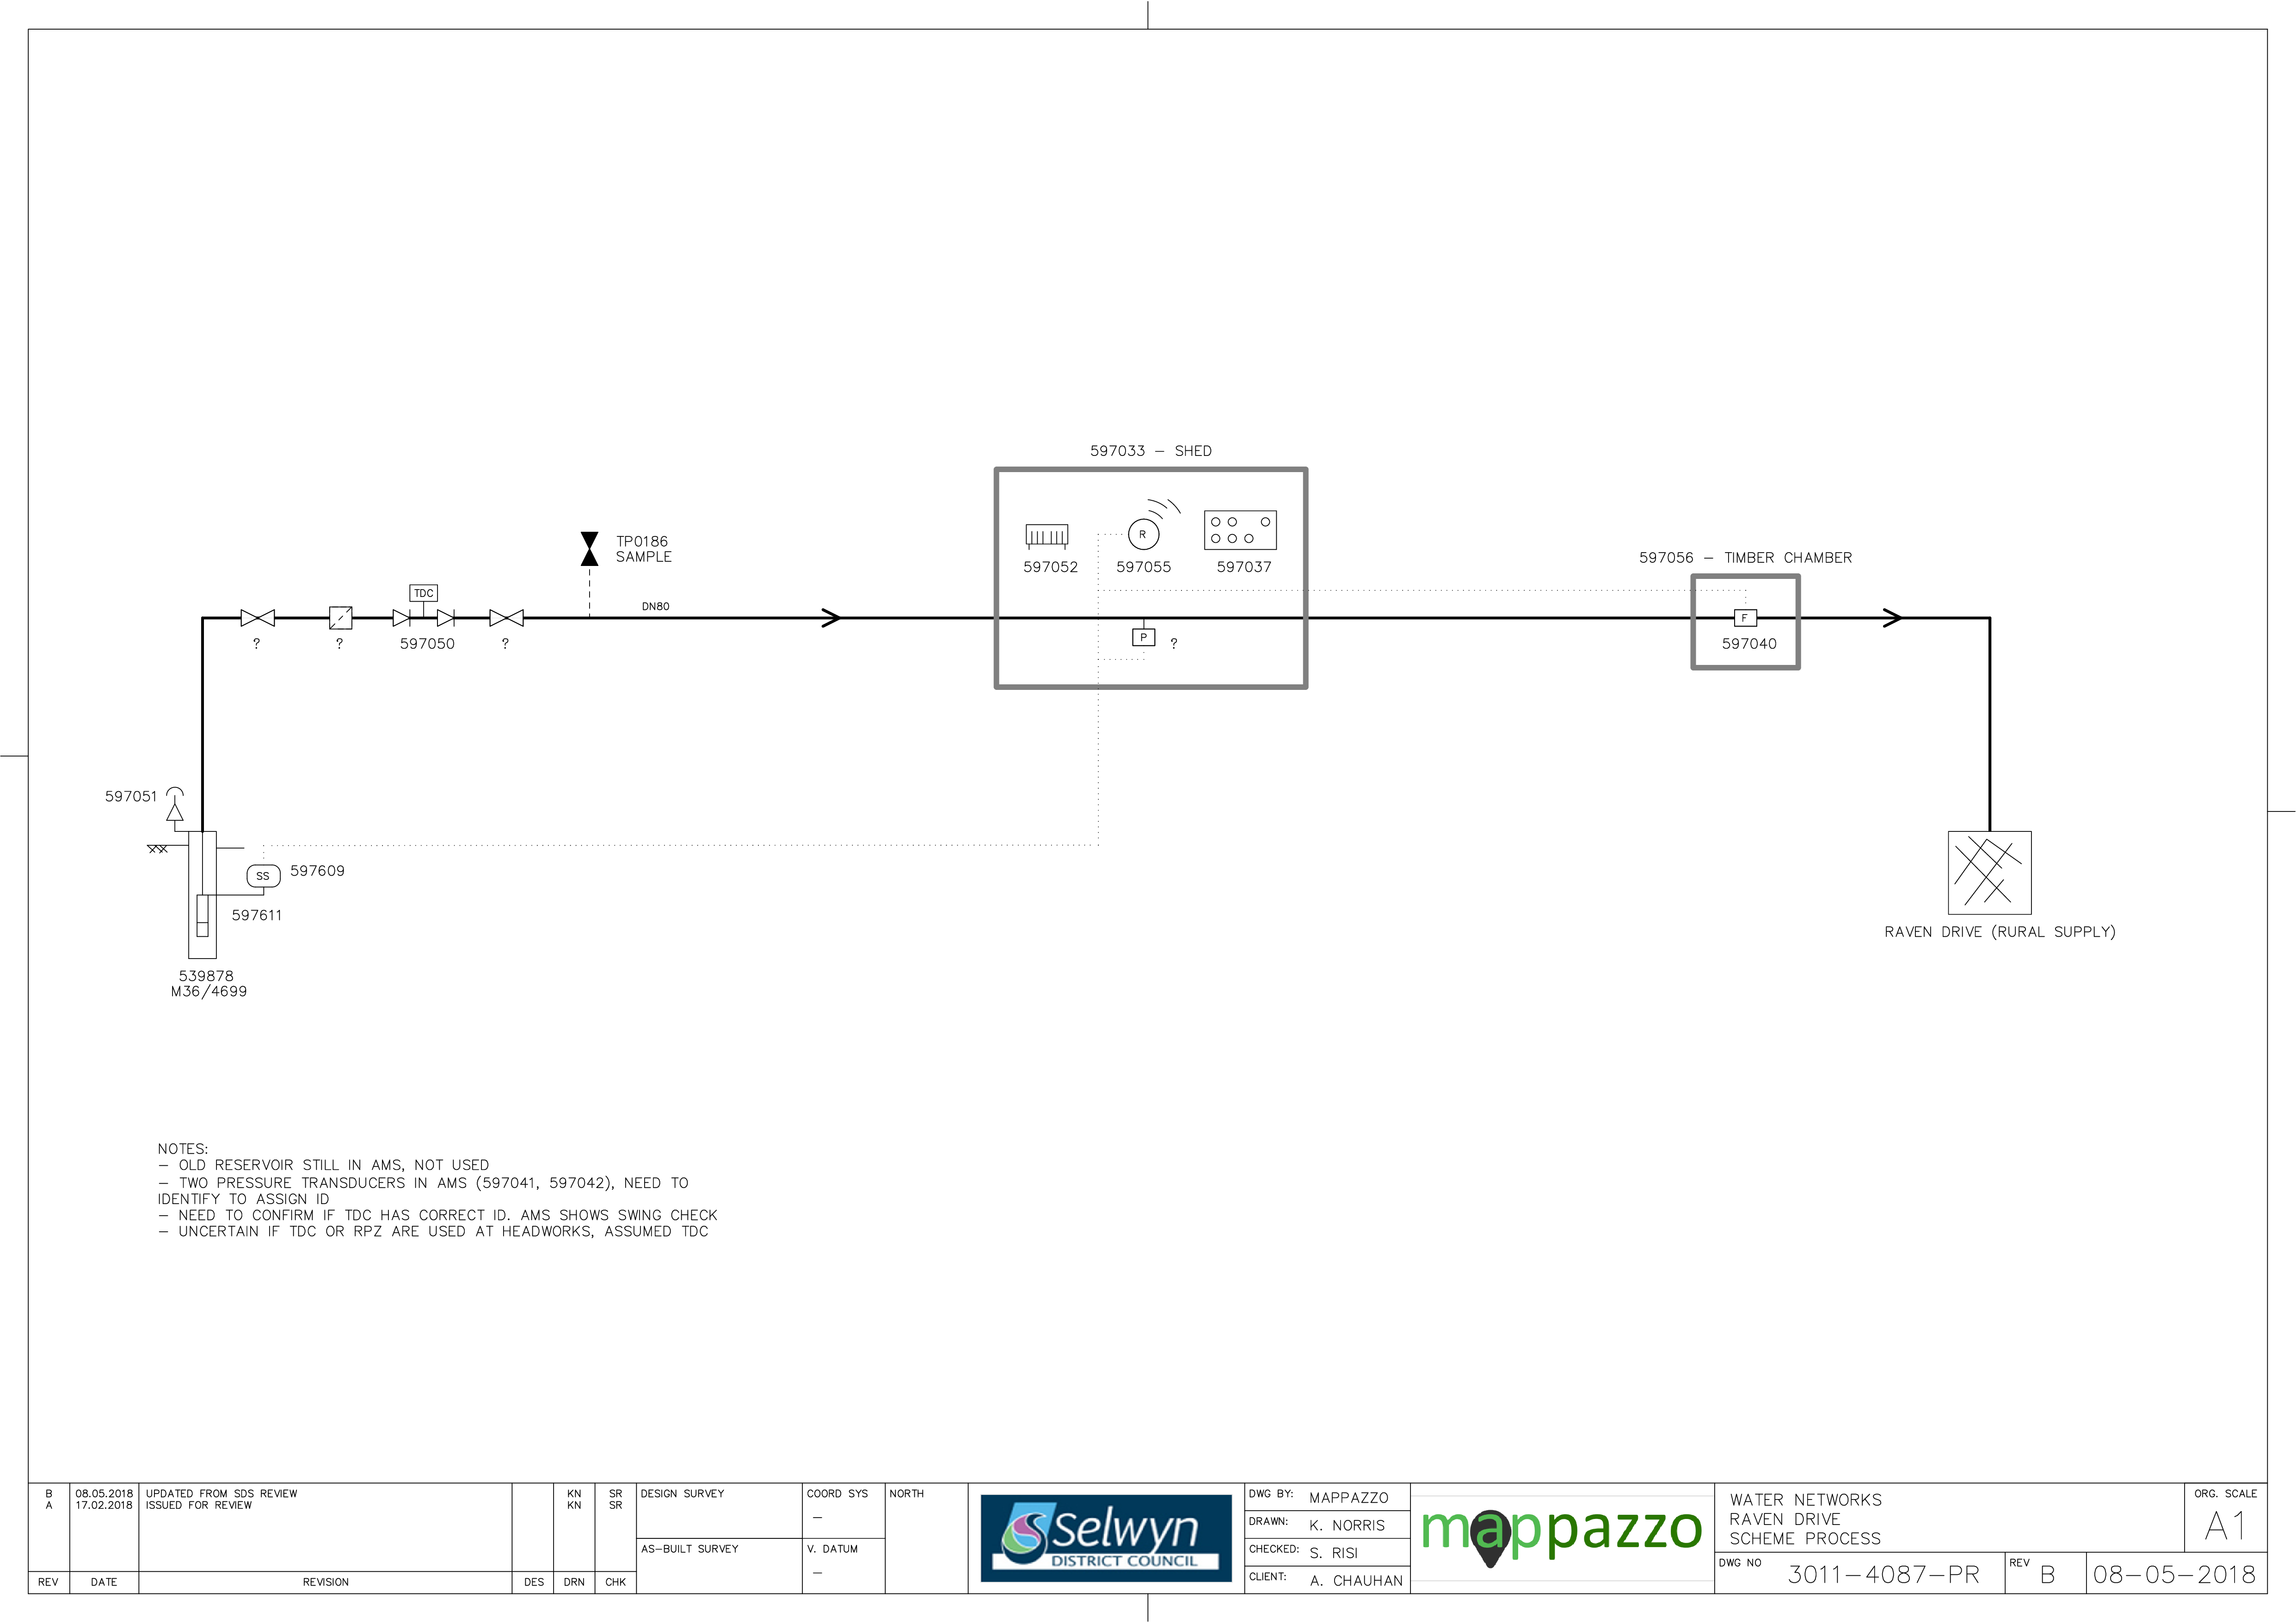
Figure 18‑2 Scheme Schematic
18.4 System Capacity
This water supply was developed to serve the 13 lot rural residential subdivision. All connections have been allocated and are utilised. No additional connections are anticipated. Existing capacity is adequate.
Table 18‑2 Capacity Summary
| Abstraction Capacity | 1.2 | 104 | - | 1 x bore pump |
| Consented Take | 25 | 600 | 90,000 * | |
| Peak Demand | 6 ** | 52 *** | 4,900 | |
* inferred value, ** 15 Dec 2012, *** 10 Jan 2013
18.5 Resource Consents
The Raven Drive water supply has a number of resource consents. Table 18‑3 shows the water take permitted by the resource consents for this scheme.
Table 18‑3 Resource Consents
CRC010905
| To take and use groundwater. | Raven Drive Goulds Road, SPRINGSTON | 1-Jul-02 | 31-Jan-35 | 25
| 600
|
18.6 Water Quality
The Raven Drive water supply is a secure water supply and is currently sampled weekly at the source and monthly in the reticulation.
The following details E. coli transgressions for the period 2012 to 2020.
Treatment
There have been no E. coli treatment transgressions during this period.
Zone
There have been no E. coli transgressions during this period.
Chemical Analysis
The following is a summary of the raw water chemical analysis carried out at the Raven Drive Water Supply.
Table 18‑4 Raven Drive Water Supply Raw Water Chemical Analysis Summary
| Total Lead (g/m3) | 0.01 (Maximum Acceptable Value)
| 0.00034 | < 0.00011
| ✓
|
| pH (pH units) | 7-8.5 (Guideline Value)
| 7.9 | 7.8 | ✓
|
| Total Hardness (g/m3 as CaCO3) | <200 (Guideline Value)
| 54 | 51.5 | ✓ |
| Total Calcium (g/m3) | n/v | 17.9 | 17.08 | ✓ |
| Total Iron (g/m3) | <0.2 (Guideline Value)
| 0.058 | 0.032 | ✓ |
| Total Sodium (g/m3) | <200 (Guideline Value)
| 10.3 | 9.49 | ✓ |
Nitrate - Nitrogen (g/m3)
| 11.3 (Maximum Acceptable Value)
| 0.92
| 1.064
| ✓
|
18.7 Scheme Assets
A summary of material and diameter for pipes in Raven Drive is shown below by Figure 18‑3 and Figure 18‑4.
Figure 18‑3 Pipe Material – Raven Drive
Figure 18‑4 Pipe Diameter – Raven Drive
18.8 Operational Management
The water supply is operated and maintained under two maintenance contracts as follows:
- Contract 1241: Water Services Contract. Contract is with SICON who undertakes investigations, conditions inspections, proactive and reactive maintenance and minor asset renewals; and
- Contract 1202: Parks and Reserves Contract. Contract is with SICON who undertakes the maintenance of land scape features related to water services e.g. mowing, gardens etc.
Water quality sampling is completed under an agreement with Food and Health Ltd as required.
18.9 Photos of Main Assets
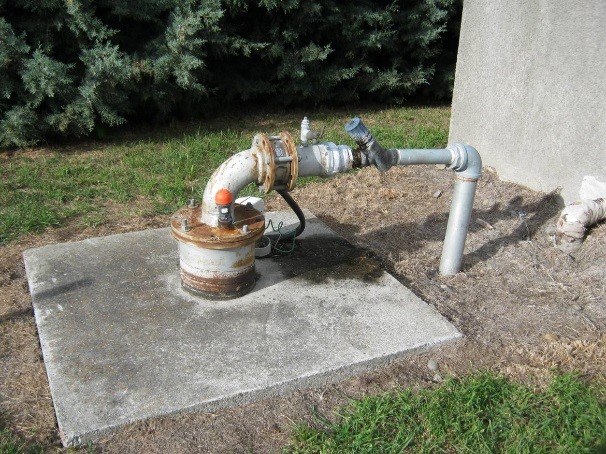
Photo 1: Well head
| 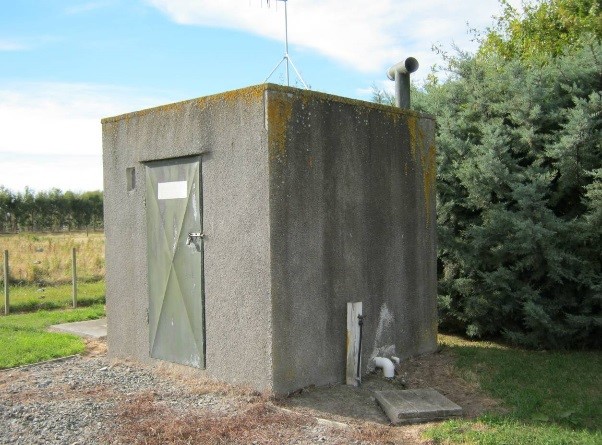
Photo 2: Control building
|
18.10 Risk Assessment
A risk assessment has been undertaken for the Raven Drive scheme. The key output from the risk assessment is the identification of any extreme and high risks which need to be mitigated. In order to mitigate these risks they have been included and budgeted for in the projects within this LTP. Table 18‑5 details the risk priority rating, Table 18‑6 outlines the risks and the list of key projects is found in Table 18‑11.
Table 18‑5 Risk Priority Rating
| > 50 | Extreme | Awareness of the event to be reported to Council. Urgent action to eliminate / mitigate / manage the risk. Document risk and action in the AMP. |
| 35-50 | Very High | Risk to be eliminated / mitigated / managed through normal business planning processes with responsibility assigned. |
| 14-35 | High | Manage risk using routine procedures. |
| 3.5-14 | Moderate | Monitor the risk. |
| < 3.5 | Low | Awareness of the event to be reported to Council. Immediate action required to eliminate / mitigate / manage the risk. Document risk and action in the AMP. |
Table 18‑6 Risks – Raven Drive
| Fire fighting capacity | Review use of storage tanks | 2014 | 12 | 6 | 6 |
| Electrical failure due to lightning or network spikes | Install surge diverters | 2014 | 6 | 6 | 6 |
| Failure to meet NES water meter standards | NES Water Meter Compliance | 2014 | 20 | 6 | 6 |
| Inability to collect income from non-metered properties | Install property water meters | 2014 | 27 | 0.6 | 0.6 |
| Non-compliance with the DWSNZ | DWSNZ - Age Testing | 2014 | 6 | 0.7 | 0.7 |
| Non-compliance with the DWSNZ | DWSNZ - Bore-head security | 2014 | 6 | 6 | 6 |
| Non-consented activities | Renewal of consents | 2014 | 27 | 27 | 6 |
| Scheme efficienty / redundancy | Review connect to Rolleston / Springston | 2017 | | 2.1 | 2.1 |
The list of district wide risks can be found in 5Waters Activity Management Plan: Volume 1.
18.11 Asset Valuation Details
The total replacement value of assets within the Raven Drive water scheme is $347,972 with further details in Table 18‑7 below.
Table 18‑7 Replacement Value, Raven Drive
|
Plant and Equipment | $228,615
|
Water Reticulation
| Fire | $42,476
|
| Lateral | $6,937
|
| Pipe | $56,275
|
| Supply Point | $11,149
|
| Valve | $2,520
|
18.12 Renewals
The renewal profile has been taken from the 2019 5 Waters Valuation. A graph showing the renewals for this scheme are shown by Figure 18‑5 below. The majority renewals occur in 2045/2046.
Figure 18‑5 Raven Drive Water Renewal Profile
18.13 Critical Assets
The criticality model for Raven Drive has been updated for the 2021 AcMP. The methodology of the criticality model can be found in 5Waters Activity Management Plan: Volume 1 and it provides details of how the criticality has been calculated for the reticulation assets. Table 18‑8 and Figure 18‑6 Criticality Maps below shows the calculated criticality for all of the assets within this scheme that have a recorded known length.
Table 18‑8 Length of Assets per Criticality Level
5
| Low | 305
|
4
| Medium-Low | 554
|
3
| Medium | 0 |
2
| Medium-High | 0 |
1
| High | 0 |
18.14 Asset Condition
The asset condition model was run for Raven Drive in 2021. The methodology of the model can be found in 5Waters Activity Management Plan: Volume 1 which provides details of how the model has been calculated for the pipe reticulation assets. Figure 18‑7 below shows the level of asset condition for these assets within this scheme that have a recorded known condition.
Table 18‑9 provides a description of the condition rating used within the condition model.
Table 18‑9 Asset Condition Grading
| 1.0 | Excellent |
| 2.0 | Good |
| 3.0 | Moderate |
| 4.0 | Poor |
| 5.0+ | Fail |
The number of pipe faults is also measured through the asset management system. Figure 18‑8 shows the known historic pipe failures within this scheme.
18.15 Funding Program
The 10 year budgets are shown by Table 18-10. Budgets are split into expenditure, renewals, projects and capital projects. Expenditure and renewals have been reported on a district-wide basis in Volume 1.
All figures are ($) not adjusted for CPI “inflation". They are calculated on historical data, and population growth where relevant.
Table 18‑10 Budget Summary
| 2021/2022 | -
| -
|
2022/2023
| -
| -
|
| 2023/2024 | -
| -
|
| 2024/2025 | -
| -
|
| 2025/2026 | -
| -
|
| 2026/2027 | -
| -
|
| 2027/2028 | -
| $400,000
|
2028/2029
| -
| -
|
2029/2030
| -
| -
|
2031/2032
| -
| -
|
| Total | -
| $400,000
|
An explanation of the categories within the budgets are as follows below:
-
Expenditure consists of operation and maintenance costs;
-
Renewals are replacement of assets which are nearing or exceeded their useful life;
-
Projects are investigations, decisions and planning activities which exclude capital works; and
-
Capital projects are activities involving physical works.
Table 18-11 Key Projects
Capital Projects
| -
| Connect to Rolleston/Springston
| -
| -
| -
| $400,000
| TBC
|
* Where LoS refers to Level of Service and G refers to Growth
The list of district wide projects can be found in 5Waters Activity Management Plan: Volume 1.
Discussion on Projects
Projects have been determined based on their:
- Relevance to the scheme
- Requirement to be completed under legislation
- Ability to bring the scheme up to or maintain the Level of Service required under council's Asset Management Policy.
Many projects are jointly funded by more than one scheme and activity. Each scheme pays a pro-rata share only, equivalent to the number of connections.
Discussion on Capital and Projects
Where relevant, Capital (Levels of Service) and Capital (Growth) projects have been included in the scheme financial details.
Levels of Service Projects and growth splits have been provided to ensure the costs of population driven works are clear.
<<
5-Waters Volume 2 - Water Supplies


