<<
5-Waters-Volume-3-Wastewater
11 Prebbleton Wastewater Scheme
11.1 Scheme Summary
Estimated Population Served
| 4,893
|
Scheme Coverage (1 Jan 2021)
| Full Charges | 1,502
|
| Half Charges | 164
|
| >1 Charges | 19
|
System Components
| Piped (m) | 65,020
|
| Manholes (No.) | 476
|
| Pump Stations (No.) | 9
|
| Treatment | N/A (to Pines WWTP)
|
| Disposal | N/A (to Pines WWTP) |
| History | Original scheme installation date | 1996
|
Value ($)
| Replacement Cost | $28,780,428
|
| Depreciated Replacement Cost | $25,289,632
|
Financial
| Operator cost (scheduled and reactive maintenance) per connection
| $104.50/connection
|
Demand
(1 Jan - 31 Dec 2020)
| Annually (m3) | 295,820
|
Average daily (m3)
| 811
|
| Peak daily (m3) | 1,624
|
| Minimum daily (m3) | 310
|
| Infiltration | Yes |
| Sustainability | Ultimate discharge point | To Pines WWTP
|
11.2 Key Issues
The following key issues are associated with the Prebbleton Wastewater Scheme. A list of district wide issues are located in 5Waters Activity Management Plan: Volume 1.
Table 11‑1 Prebbleton Scheme Issues
| Significant infiltration and inflow is experienced during wet weather | Target renewals to address infiltration and investigate sources of infiltration |
| Capacity limitations of discharge to Lincoln | Construct new direct pipeline and pump station to the Selwyn Road Pump Station |
11.3 Overview & History
A reticulated sewerage scheme for Prebbleton was proposed in the 1980s by the then Paparua County Council. Costs for reticulation and treatment were not acceptable to the residents at that time so development of the township stopped due to restrictions placed by the Regional Council.
In 1995/96, agreement with Meadow Mushrooms helped facilitate the installation of a sewerage scheme system by guaranteeing Meadow Mushroom 84 future lots on their site and the “existing Township" paying their share for a pump station and rising main. This coupled with Christchurch City's agreement to take untreated sewage allowed the scheme to proceed. The scheme was commissioned in 1996.
The SDC/CCC 1995/96 agreement for Prebbleton sewerage allowed for the raw sewage and trade waste to be pumped 24 hours a day at a maximum flow rate of 25 L/s and a maximum annual discharge of 250,000m3 in each financial year.
For Prebbleton, as with Lincoln, a discharge agreement was reached with CCC to connect to their wastewater system. Unlike Lincoln, there is neither the level of pre-treatment nor buffer storage afforded by the oxidation pond. Therefore the growth of the Prebbleton community was significantly impacted by the amount of wastewater servicing that can be provided under the CCC agreement.
The growth of Prebbleton and Lincoln was limited by the discharge restrictions as defined in the CCC agreement. Without an alternative solution being adopted, no further growth could occur. Similarly for Rolleston, there would be limited growth without greater capacity of treatment and conveyance being constructed in accordance with the master plan, even on a standalone basis.
In order to solve these issues, Prebbleton was connected to the ESSS scheme via a diversion line (completed in April 2011) which allows switching of the CCC directed flows to the installed Lincoln/Springston sewer pipe. Aberdeen subdivision is pumped back to Prebbleton via a new pressure main.
Sewage effluent will gravity feed to the Lincoln WWTP (aeration only) and be pumped to the Rolleston Pines for final treatment and disposal.
2010/2011 Earthquakes
The 2010/2011 earthquakes had a minor impact on the scheme's below ground infrastructure. Several deep lateral connections separated but were repaired. Based on visual assessment (CCTV and qualified staff) no other damage to the below ground infrastructure or resulting effects e.g. blockages have been detected. There may however be long term but intangible impact on maintenance and renewals programmes.
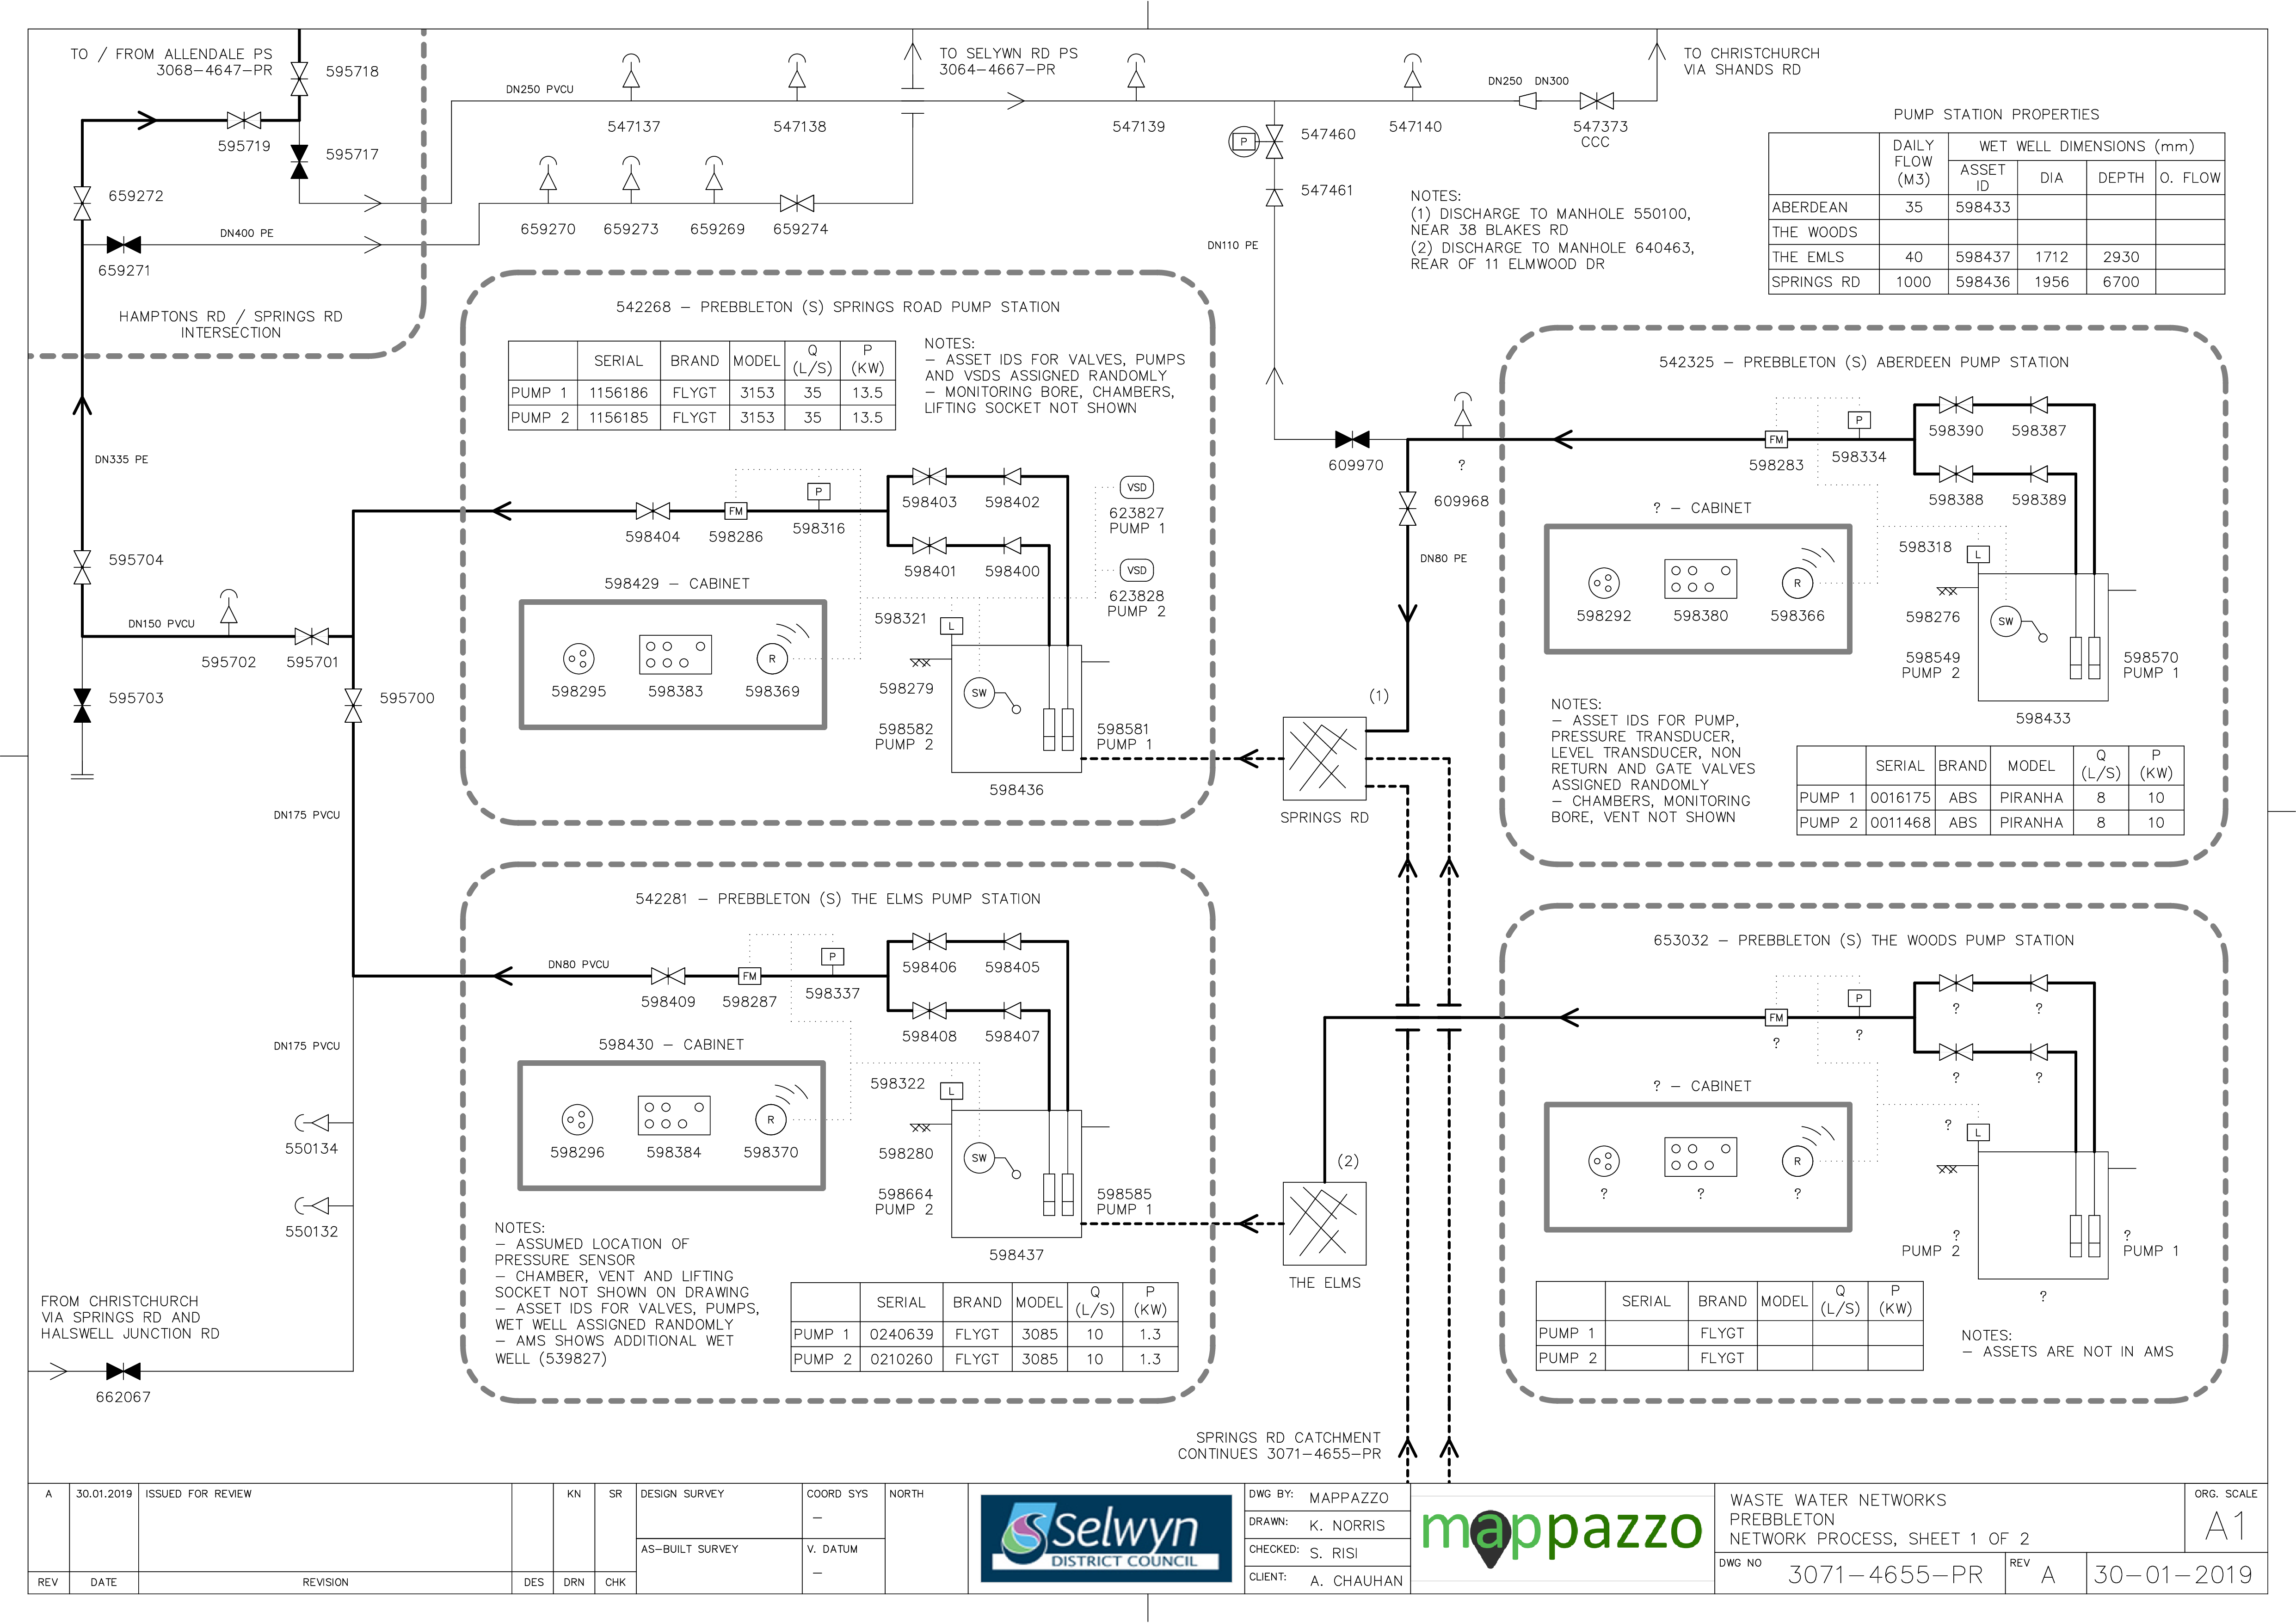
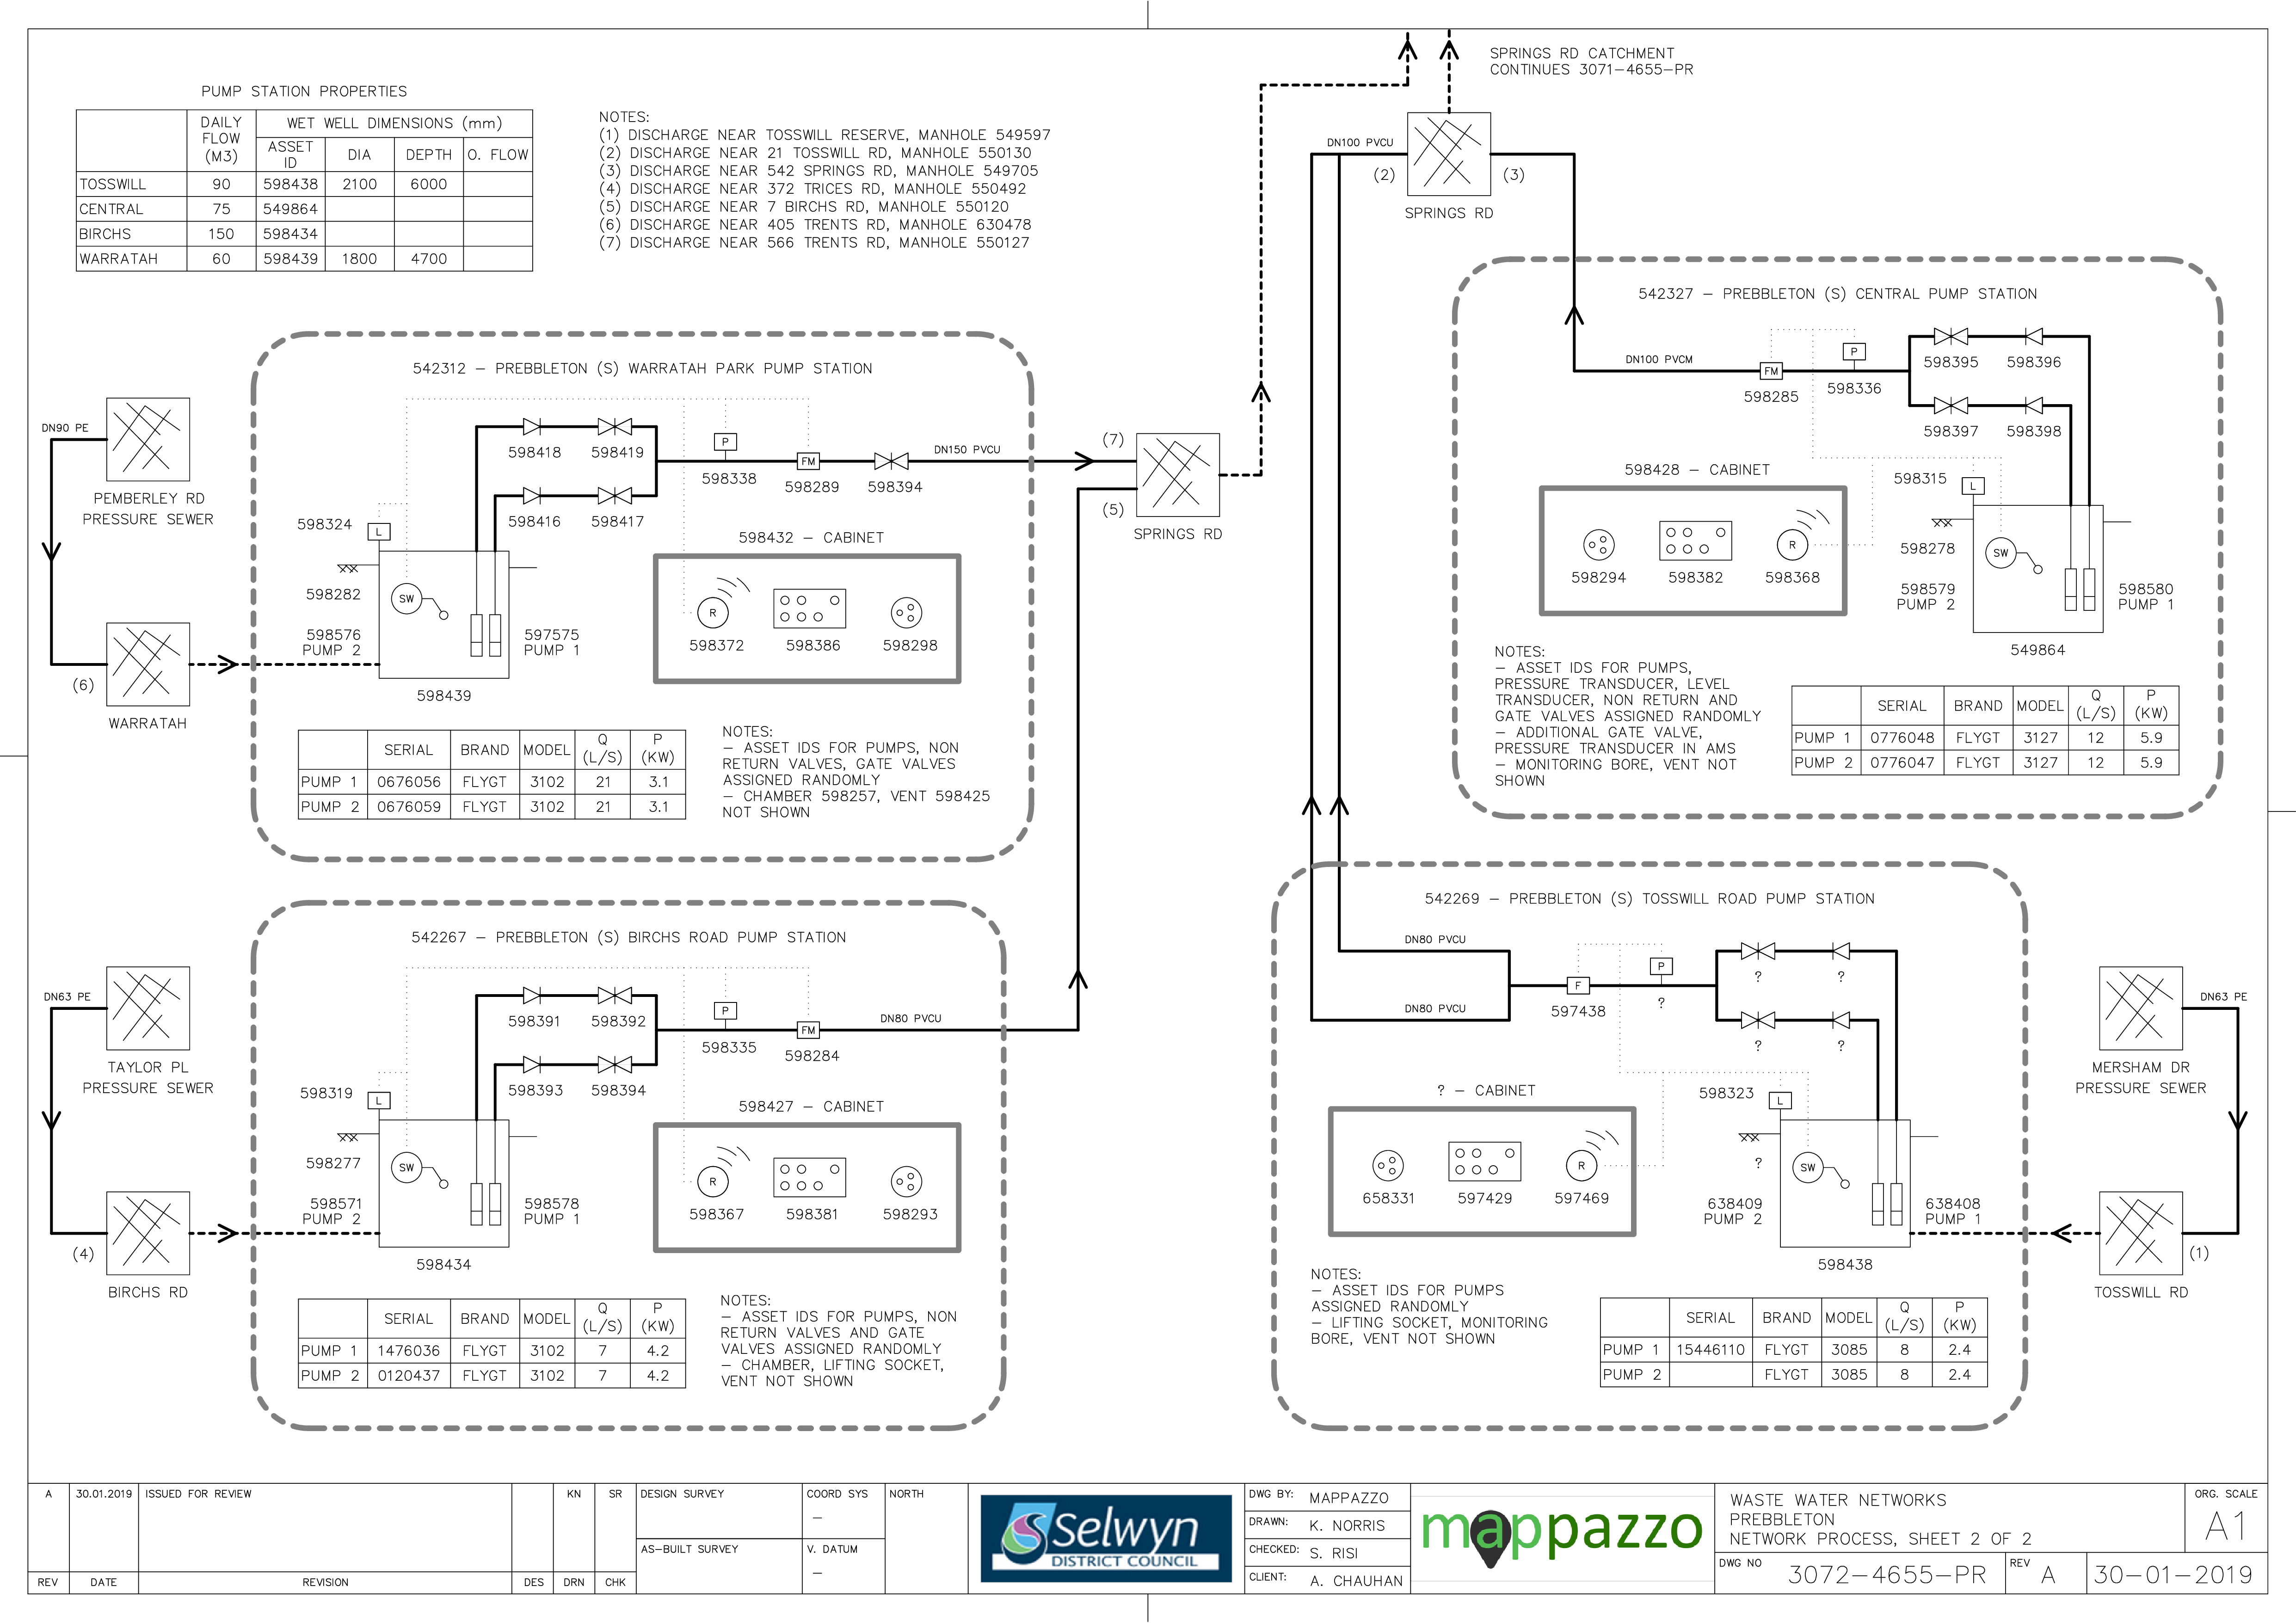
Figure 11‑2 Scheme Schematic x2
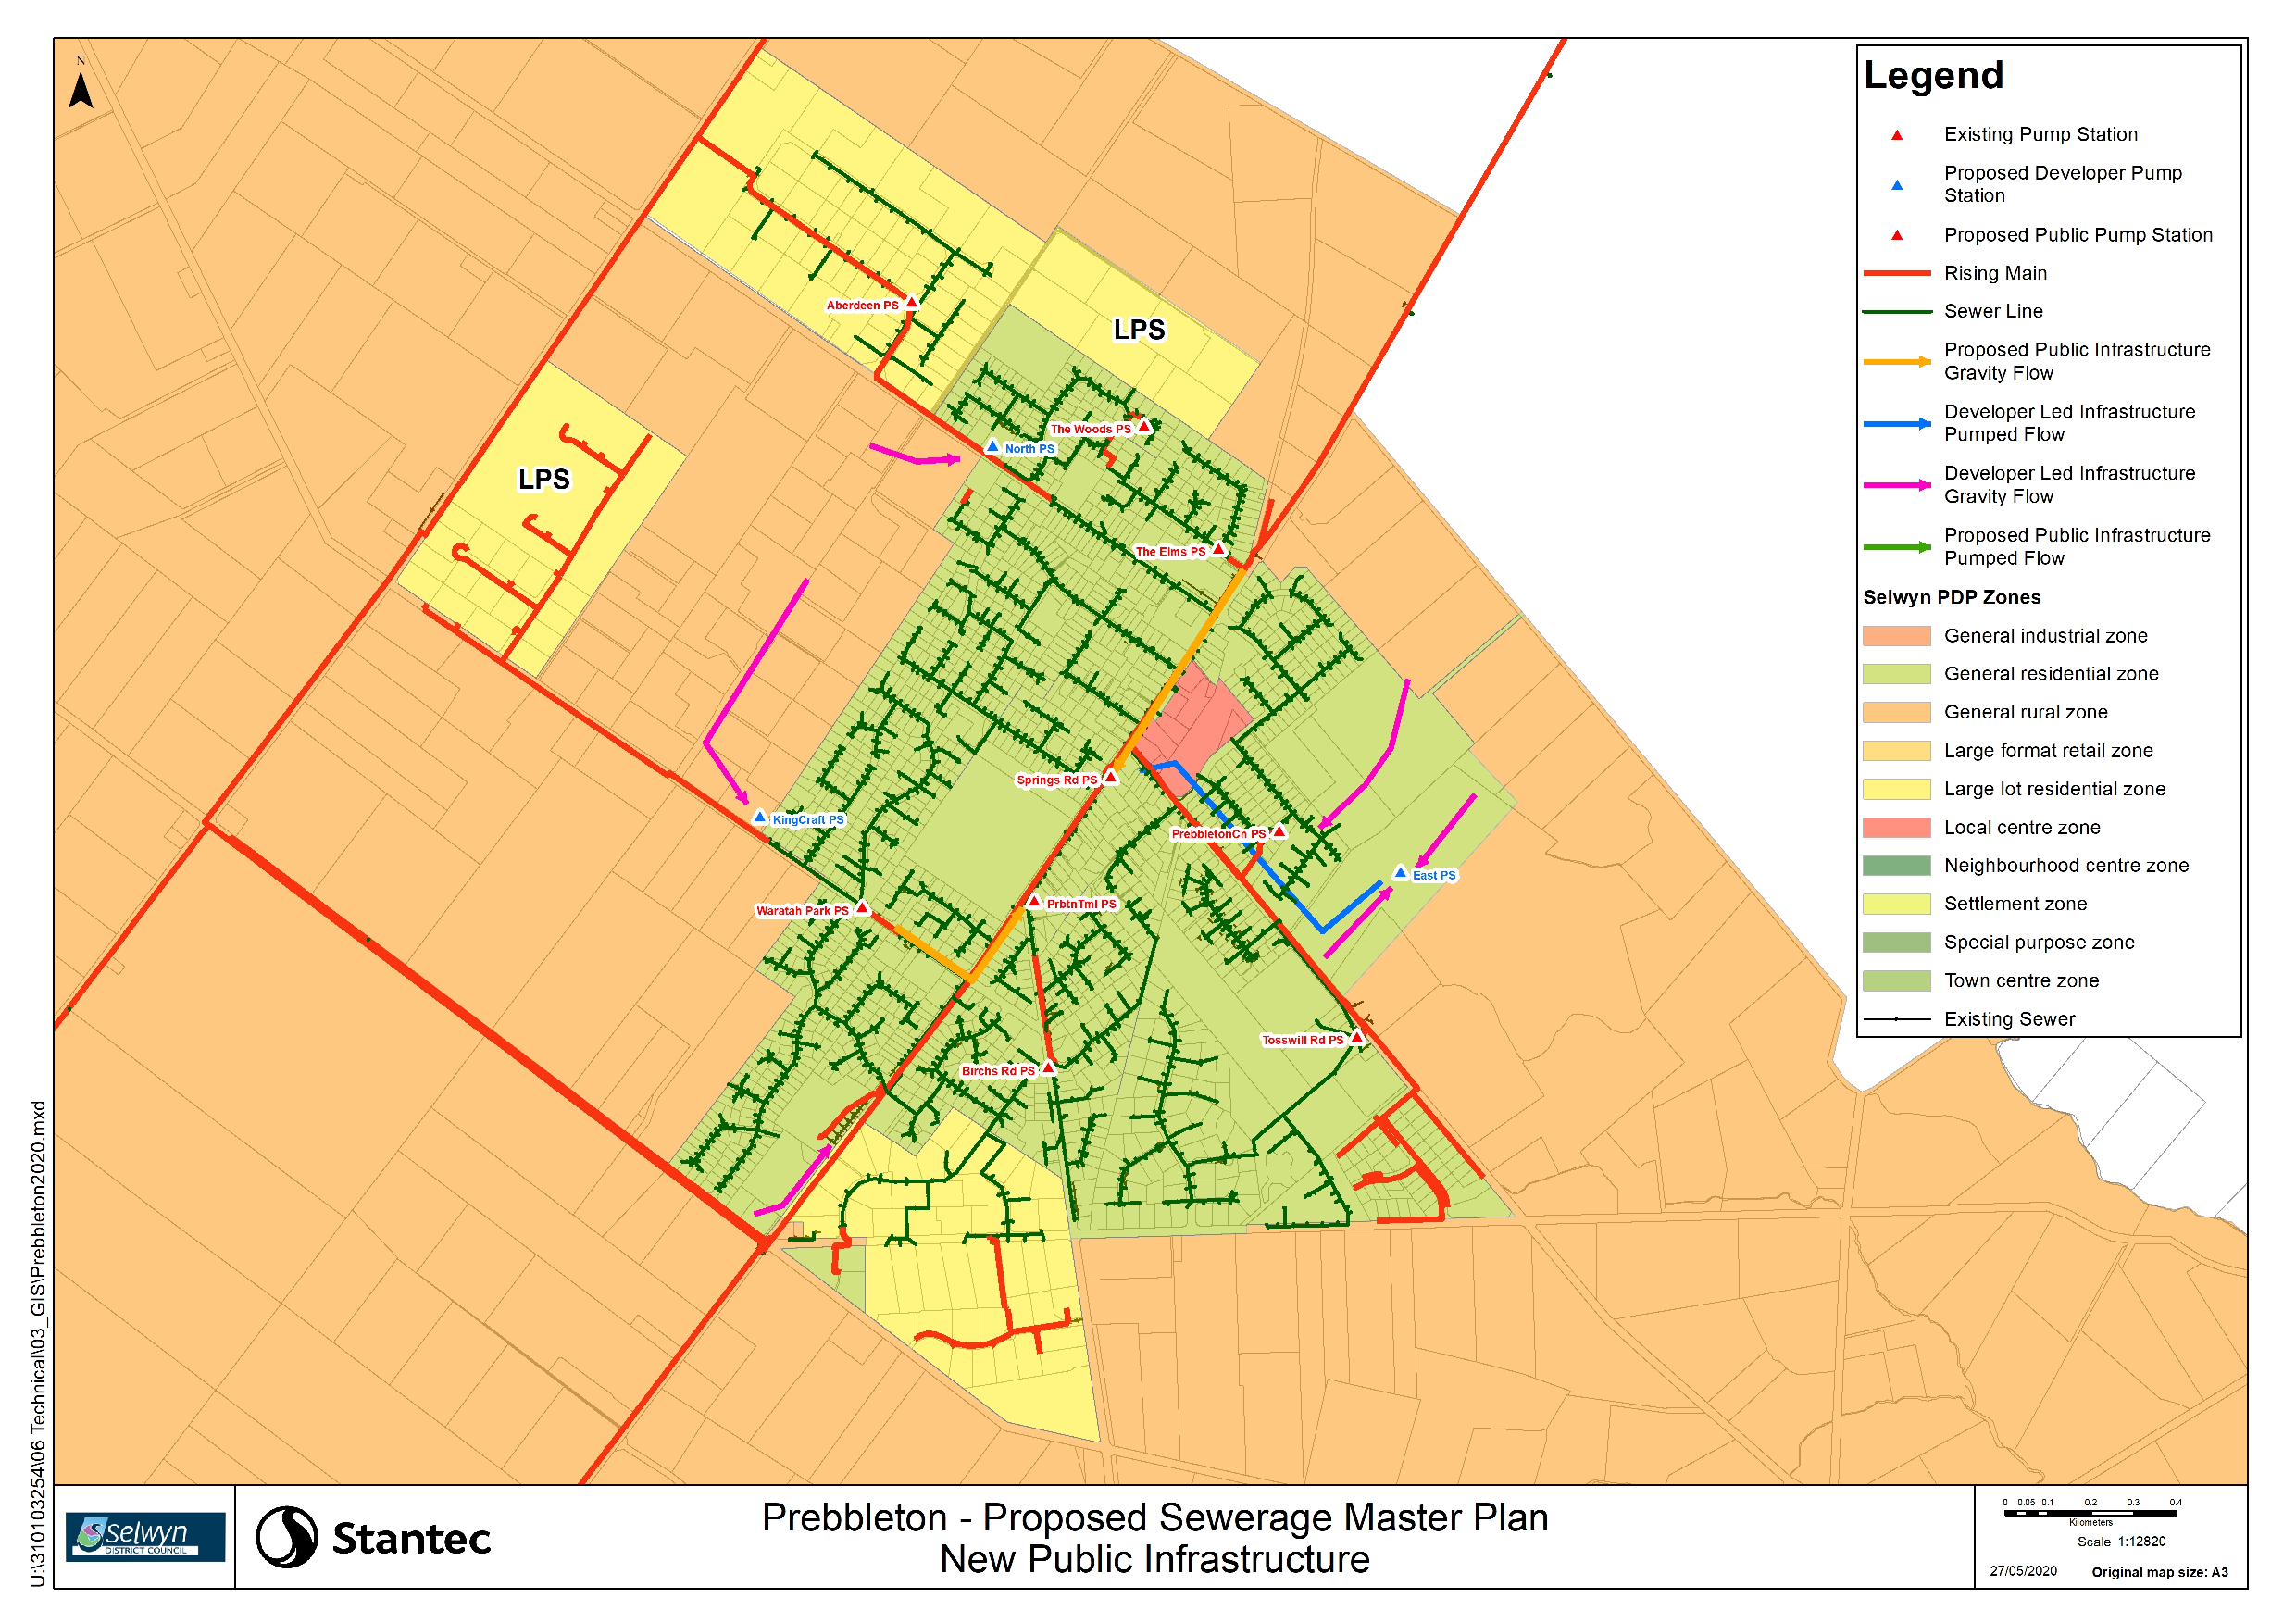
Figure 11‑3 Prebbleton Master Plan
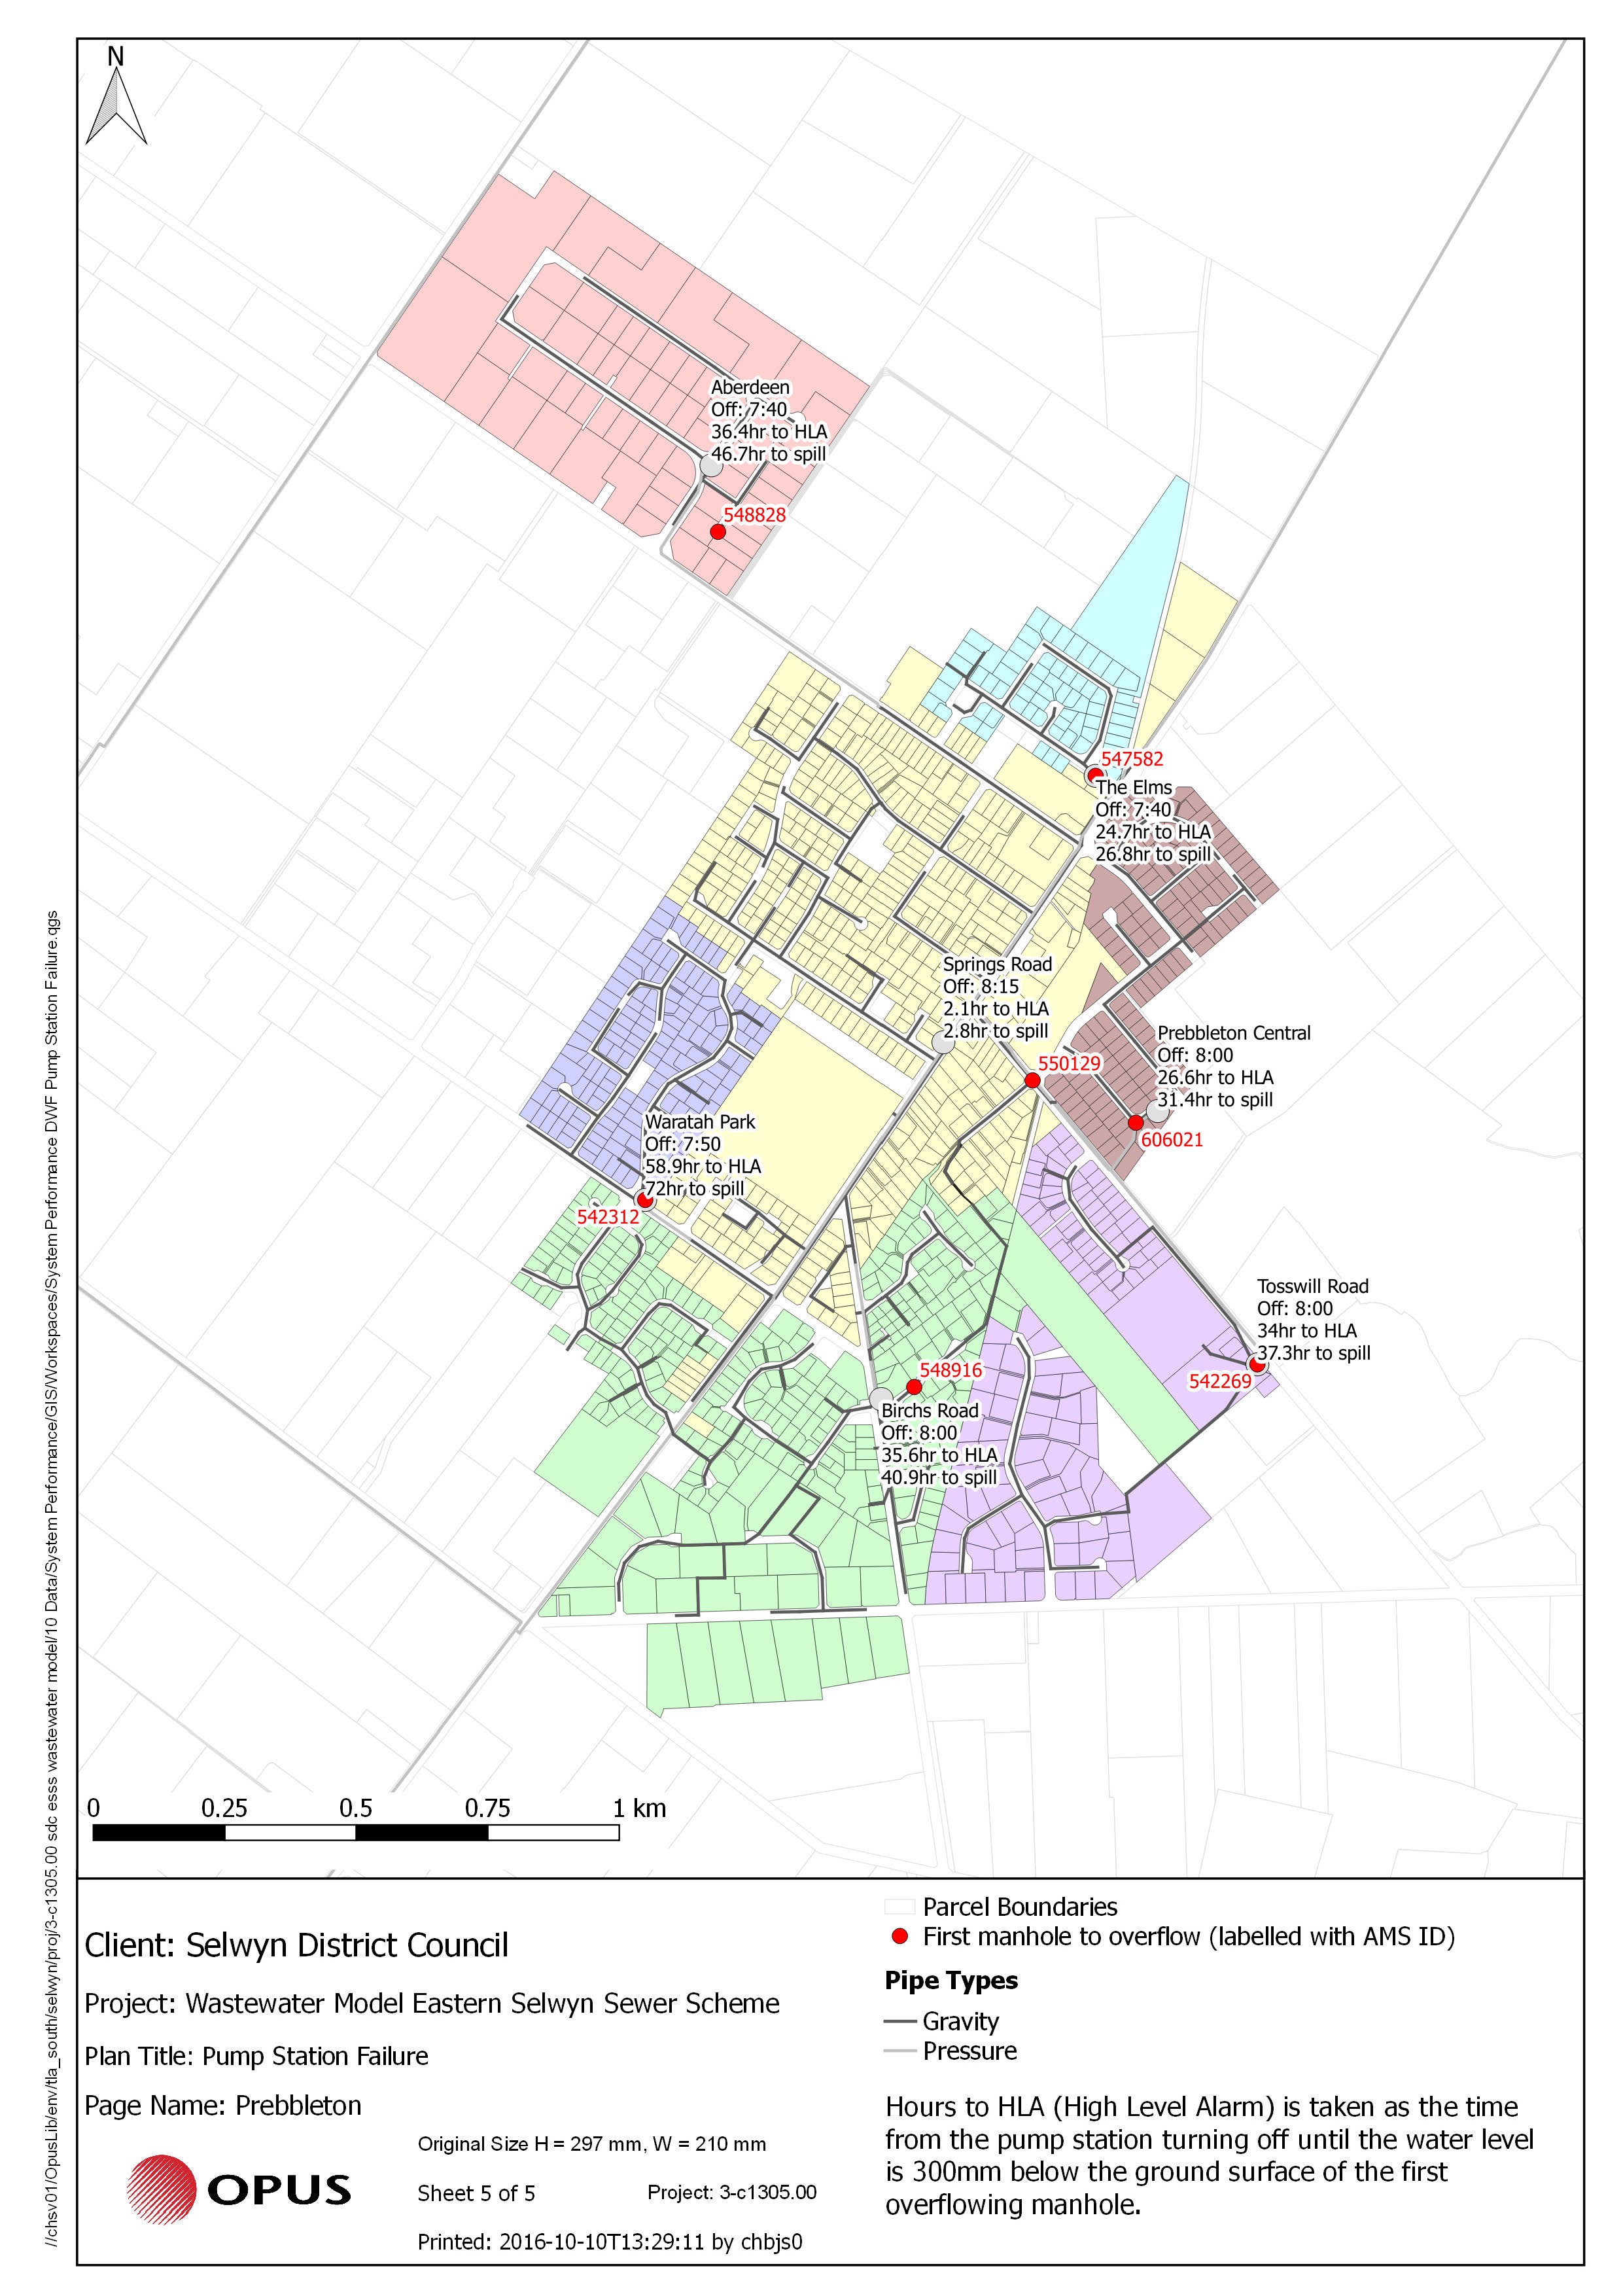
Figure 11‑4 Pump Station Failure Map
11.4 System Capacity
A decline in the Industrial/Commercial allocation within the Prebbleton urban area associated with the projected transition of existing business into residential development.
In recent years there has been rapid residential growth in the Prebbleton community. This has placed a strain on the existing wastewater collection system. Therefore, with the implementation of the ESSS, the wastewater system has been expanded in stages to meet the increasing flows. A wastewater master plan has been established to structure the expansion of scheme to meet the timing of new development. The capacity of existing catchment pump stations, while not yet reached, will need to be monitored and upgraded as pump renewals are considered. Figure 11‑5 shows the projected growth for the Prebbleton township.
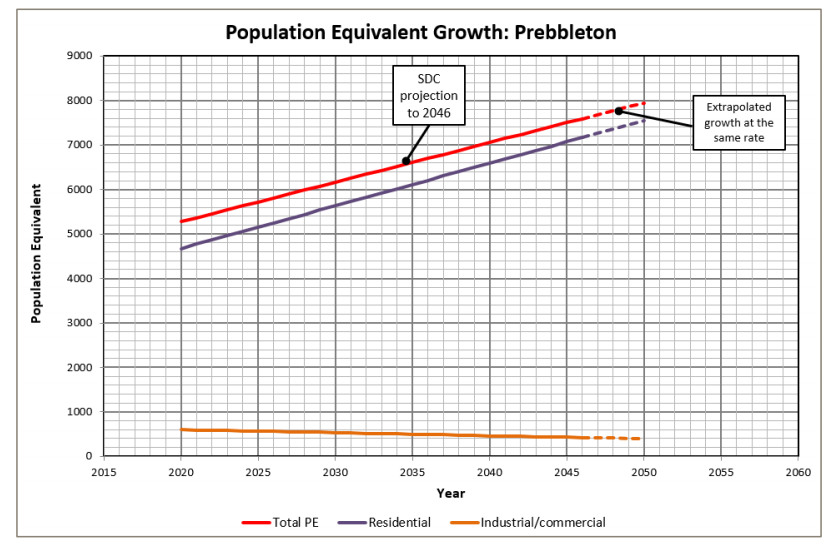
Figure 11‑5 Projected PE Growth – Prebbleton
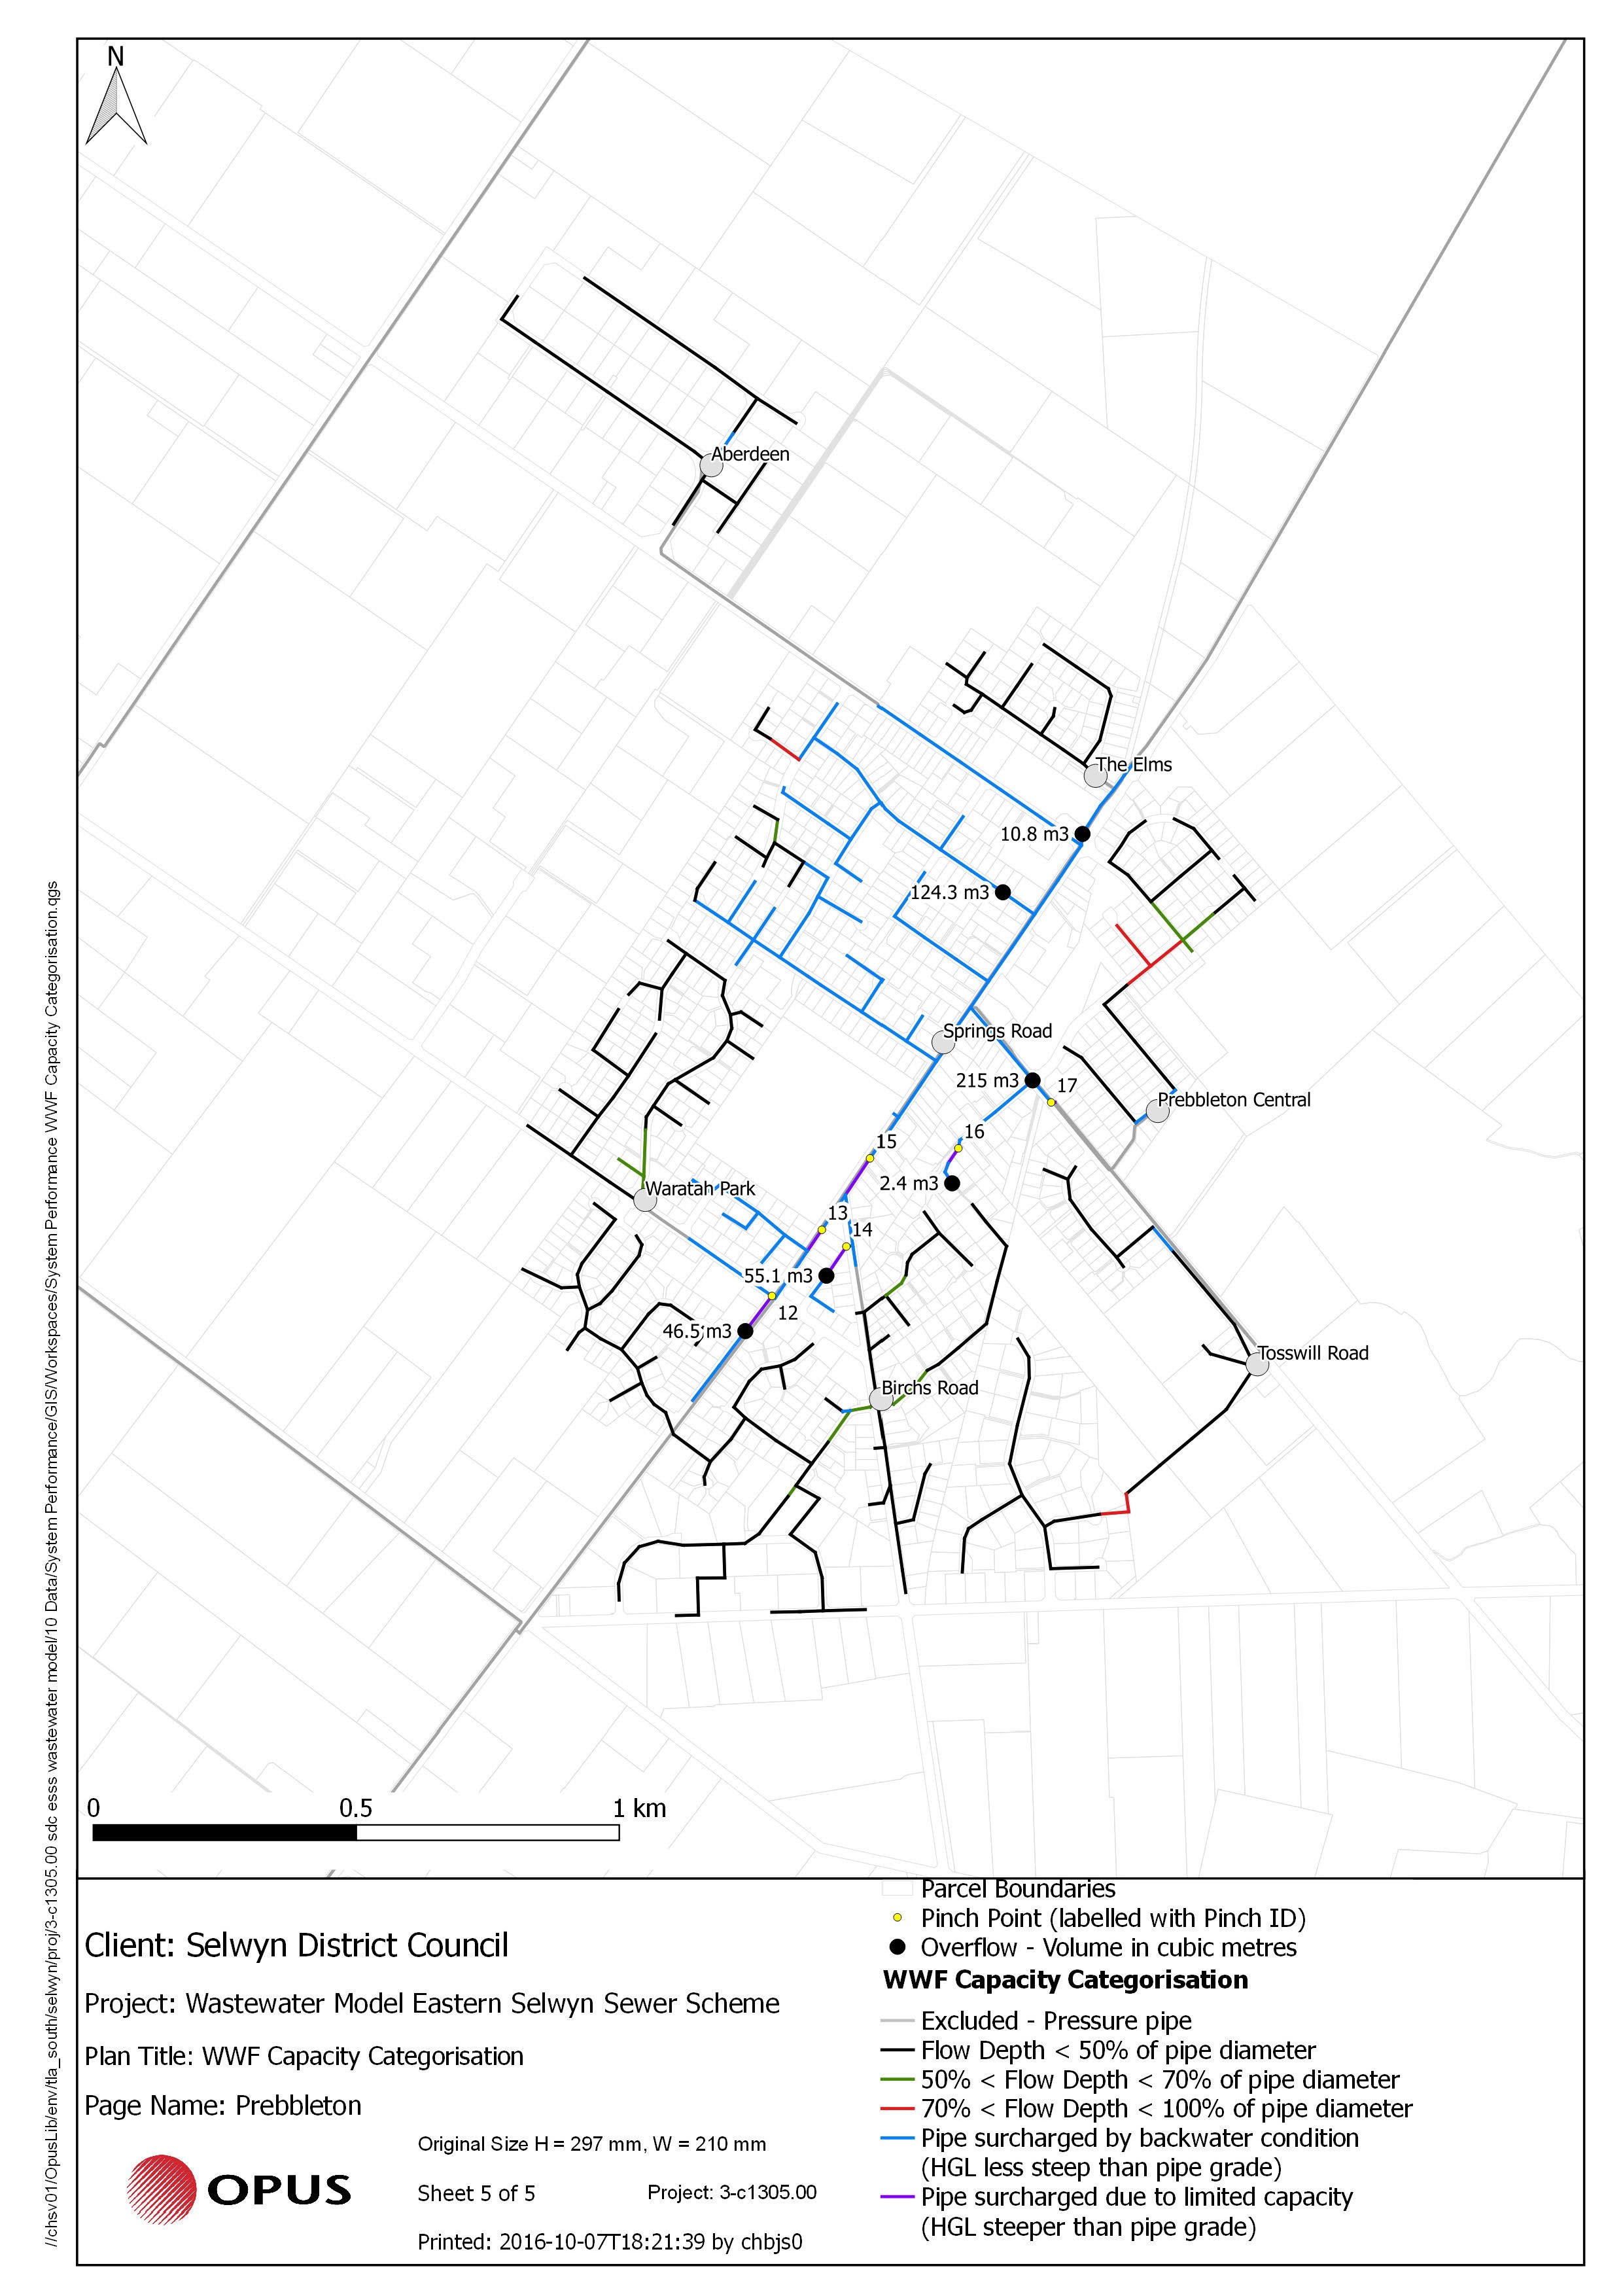
Figure 11‑6 Wet Weather Flow Capacity Map
11.5 Resource Consents
Prebbleton township is part of the ESSS scheme. Therefore, all wastewater is pumped to the Pines Treatment Plant located in Rolleston. The resource consents required for this treatment plant are in the ESSS section of this plan.
11.6 Scheme Assets
A summary of the assets within this scheme is outlined in this section.
11.6.1 Reticulation Overview
A summary of material and diameter for pipes is shown in Figure 11‑7 and Figure 11‑8.
Figure 11‑7 Pipe Material – Prebbleton
Figure 11‑8 Pipe Diameter - Prebbleton
11.6.2 Treatment and Disposal
No treatment is carried out with all wastewater pumped to the Pines WWTP.
Further reference to the treatment and disposal of Prebbleton wastewater is described in the ESSS section.
11.6.3 Design
The wastewater collection system has been designed in accordance with the appropriate New Zealand engineering design guidelines at the time of construction and in accordance with the Selwyn District Council Engineering Design Standards. Specific designs for portions of the scheme outside of these standards have been considered where detailed engineering designs have been provided.
11.6.4 Pump Stations
The township reticulation is gravity mains (some very deep) to a main pump station on Springs Road. There are 6 small to medium sized pump stations within the reticulation, these are:
- Tosswill Road which serves the Domain and future development in surrounding area (small pumpstation)
- Birchs Road to serve the southern area (medium size)
- Elms, Aberdeen, Prebbleton Central and Warratah Park (small pumpstations)
The main pump station located on Springs Road pumps the sewage effluent via a 7.5 km pipeline to Lincoln. Details are shown below in Table 11‑2.
Pump stations where the standby / assist pump is predicted to start have been highlighted in
yellow and
red for those that experience a peak wet weather response.
Yellow Pumps are can convey the peak flow without backing up the system
Red Pumps are unable to convey the peak flow causing the system to back up
Table 11‑2 Pump Station Overview
| Prebbleton (S) Aberdeen PS | 1800Ø | 2 | PIRANHA-M85/2 | 5-7 | 6.4 | 0.4 | 1.1 | 1.1 |
| Prebbleton (S) Birchs Rd PS | 1800Ø | 2 | Flygt 3102 180 HT252 | 7 | 8.9 | 1.5 | 4.6 | 9.5 |
| Prebbleton (S) Central PS | 2000Ø | 2 | Flygt 3127 181 HT487 | 13 | 12 | 0.8 | 2.4 | 12.0 |
| Prebbleton (S) Springs Rd PS | 2000Ø | 2 | Flygt 3152 181 HT452 | 23-39 | 30 | 7.2 | 38.5 | 53.4 |
| Prebbleton (S) The Elms PS | 1800Ø | 2 | Flygt 3085 182 MT440 | 10 | 6.5 | 0.4 | 1.3 | 1.3 |
| Prebbleton (S) Tosswill Rd PS | 2000Ø | 3 | Flygt 3085 182 HT252 | 7 | 6.7 | 0.8 | 2.5 | 4.9 |
| Prebbleton (S) Waratah Park PS | 1800Ø | 2 | Flygt 3102 181 MT461 | 23 | 24 | 0.4 | 1.3 | 1.3 |
Table 11‑3 Pump Station Storage Time Analysis
| Prebbleton (S) Aberdeen PS | Two submersibles pumps to reticulation | 36.4
| 46.7
| 548828
|
| Prebbleton (S) Birchs Rd PS | Two submersibles - to reticulation | 35.6 | 40.9 | 548916 |
| Prebbleton (S) Central PS | Two submersibles - to reticulation | 26.6 | 31.4 | 606021 |
| Prebbleton (S) Springs Rd PS | Three submersibles - to Lincoln | 2.1 | 2.8 | 550129 |
| Prebbleton (S) The Elms PS | Two submersibles - to reticulation | 24.7 | 26.8 | 547582 |
| Prebbleton (S) Tosswill Rd PS | Three submersibles - to reticulation via twin mains | 34.0 | 37.3 | 542269 |
| Prebbleton (S) Waratah Park PS | Two submersibles - to reticulation | 58.9 | 72.0 | 542312 |
11.6.5 Rising Mains
Table 11‑4 Rising Main Overview
| Prebbleton (S) Aberdeen PS | Prebbleton | 728 | 3.3 | 0.4 | 2.6 | 0.0 | 2.6 | 60 | No data
|
| Prebbleton (S) Birchs Rd PS | Prebbleton | 266 | 1.4 | 1.5 | 0.2 | 0.0 | 0.2 | 165 | No data |
| Prebbleton (S) Central PS | Prebbleton | 567 | 5.0 | 0.8 | 1.7 | 0.0 | 1.7 | 130 | 115 - 145 |
| Prebbleton (S) Springs Rd PS | Prebbleton | 9,757
| 525.8 | 7.2 | 7.6 | 3.0 | 10.6
| 120 | 35 - 185 |
Prebbleton (S) The Elms PS
|
Prebbleton |
48 |
0.2 |
0.4 |
0.2 |
0.0 |
0.2 |
5 |
No data |
| Prebbleton (S) Tosswill Rd PS | Prebbleton | 1,293 | 6.7 | 0.8 | 2.3 | 0.0 | 2.3 | 70 | No data |
| Prebbleton (S) Waratah Park PS | Prebbleton | 129 | 2.1 | 0.4 | 1.4 | 0.0 | 1.4 | 30 | No data |
11.7 Operational Management
The wastewater schemes are operated and maintained under the maintenance contract as follows:
- Contract 1241: Water Services Contract. Contract is with SICON who undertakes investigations, conditions inspections, proactive and reactive maintenance and minor asset renewals.
Wastewater sampling is completed under an agreement with Food and Health Ltd as required.
11.8 Photos of Main Assets
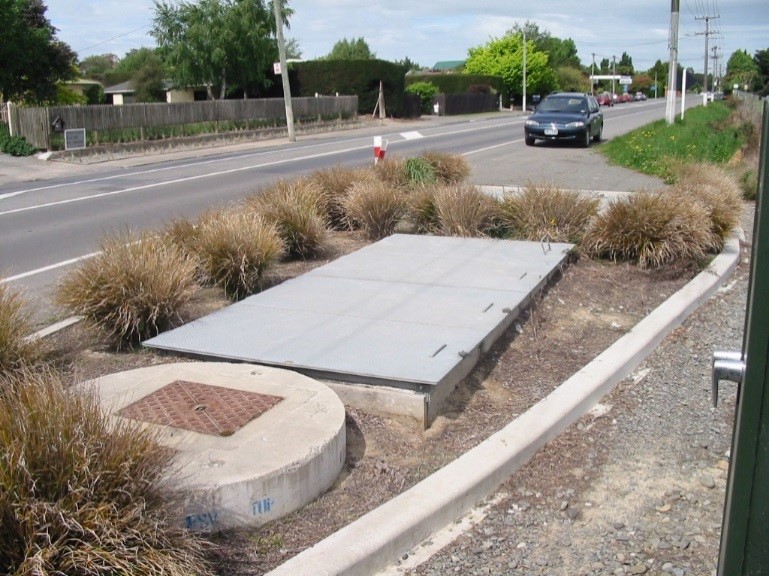
Photo 1 – Springs Road Pump Station
|
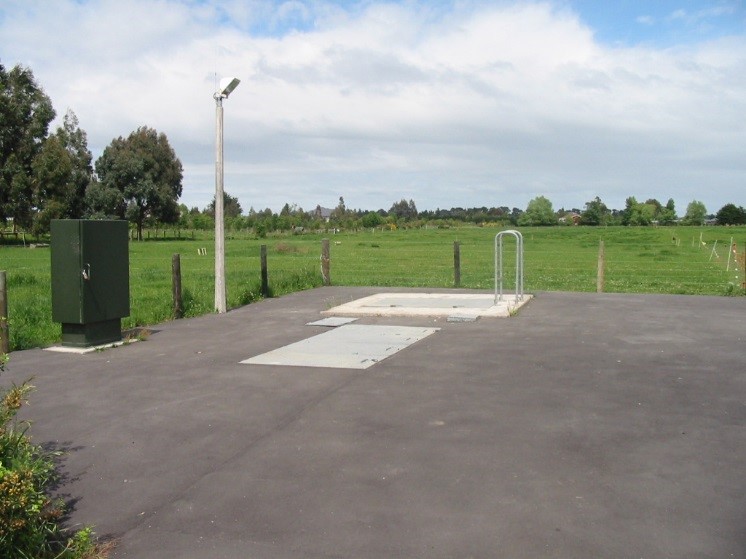
Photo 2 – Toswill Rd Pump Station
|
11.9 Risk Assessment
A risk assessment has been undertaken for the Prebbleton scheme. The key output from the risk assessment is the identification of any extreme and high risks which need to be mitigated. In order to mitigate these risks they have been included and budgeted for in the projects within this LTP. Table 11‑5 details the risk priority rating, Table 11‑6 outlines the risks and the list of key projects is found in Table 11‑11.
Table 11‑5 Risk Priority Rating
| > 50 | Extreme | Awareness of the event to be reported to Council. Urgent action to eliminate / mitigate / manage the risk. Document risk and action in the AMP. |
| 35-50 | Very High | Risk to be eliminated / mitigated / managed through normal business planning processes with responsibility assigned. |
| 14-35 | High | Manage risk using routine procedures. |
| 3.5-14 | Moderate | Monitor the risk. |
| < 3.5 | Low | Awareness of the event to be reported to Council. Immediate action required to eliminate / mitigate / manage the risk. Document risk and action in the AMP. |
Table 11‑6 Risks - Prebbleton
| System capacity is exceeded | Springs Road pumpstation requires upgrading | 2014 | 45 | 45 | 45 |
| System capacity is exceeded | Install new pipeline to Selwyn Road P.S. | 2014 | 45 | 45 | 45 |
| Power outage resulting in loss of pumping capability at pump station(s) | Purchase trailer mounted generator, sized for all Prebbleton pump stations | 2014 | 10 | 10 | 10 |
| Infiltration overwhelms network | Infiltration inspections | 2017 | | 20 | 10 |
The list of district wide risks can be found in 5Waters Activity Management Plan: Volume 1.
11.10 Asset Valuation Details
The total replacement value of assets within the Prebbleton Scheme is $28,780,428 as detailed in Table 11‑7 below.
Table 11‑7 Replacement Value, Prebbleton
Plant and Equipment
| $705,820
|
Wastewater Reticulation
| Chamber | $431,397
|
| Lateral | $5,213,398
|
| Manhole | $3,206,434
|
| Pipe | $18,807,248
|
| Valve | $416,131
|
11.11 Renewals
The renewal profile has been taken from the 2019 5 Waters Valuation. A graph showing the renewals for this scheme are shown by Figure 11‑9 below.
Figure 11‑9 Prebbleton Wastewater Renewal Profile
11.12 Critical Assets
The criticality model for Prebbleton has been updated for the 2021 AcMP. The methodology of the criticality model can be found in 5Waters Activity Management Plan: Volume 1 and it provides details of how the criticality has been calculated for the reticulation assets. Table 11‑8 and Figure 11‑10 below show the calculated criticality for all of the assets within this scheme that have a recorded known length.
Table 11‑8 Length of Assets per Criticality Level
5
| Low | 48,253
|
4
| Medium-Low | 3,481
|
3
| Medium | 1,868
|
2
| Medium-High | 10,861
|
1
| High | 1,492
|
11.13 Asset Condition
The asset condition model was run for Prebbleton in 2021. The methodology of the model can be found in 5Waters Activity Management Plan: Volume 1 and it provides details of how the model has been calculated for the reticulation assets (particularly pipes). Figure 11‑11 below shows the level of asset condition for all of the assets within this scheme that have a recorded known condition.
Table 11‑9 provides a description of the condition rating used within the condition model.
Table 11‑9 Asset Condition Grading
| 1.0 | Excellent |
| 2.0 | Good |
| 3.0 | Moderate |
| 4.0 | Poor |
| 5.0+ | Fail |
11.14 Funding Program
The 10 year budgets for Prebbleton are shown by Table 11‑10. Budgets are split into expenditure, renewals, projects and capital projects. Expenditure and renewals have been reported on a district-wide basis in Volume 1.
All figures are ($) not adjusted for CPI “inflation". They are calculated on historical data, and population growth where relevant.
Table 11‑10 Prebbleton Budget Summary
| 2021/2022 | -
| $12,000
|
| 2022/2023 | -
| $200,000
|
| 2023/2024 | -
| -
|
| 2024/2025 | -
| -
|
| 2025/2026 | -
| -
|
| 2026/2027 | -
| -
|
2027/2028
| -
| -
|
2028/2029
| -
| -
|
2029/2030
| -
| -
|
2030/2031
| -
| -
|
| Total | - | $212,000
|
An explanation of the categories within the budgets are as follows below:
- Expenditure consists of operation and maintenance costs;
- Renewals are replacement of assets which are nearing or exceeded their useful life;
- Projects are investigations, decisions and planning activities which exclude capital works; and
- Capital projects are activities involving physical works.
Table 11‑11 Key Projects
| Capital Projects | -
| Upgrade Tosswill Road main
| -
| -
| $200,000
| -
| TBC
|
Capital Projects
| -
| Move electrical cabinets at Birchs Road
| $12,000
| -
| -
| -
| 100% LoS
|
* LoS refers to Level of Service
The list of district wide projects can be found in 5Waters Activity Management Plan: Volume 1.
Discussion on Projects
Projects have been determined based on their:
- Relevance to the scheme
- Requirement to be completed under legislation
- Ability to bring the scheme up to or maintain the Level of Service required under council's Asset Management Policy.
Many projects are
jointly funded by more than one scheme and activity. Each scheme pays a pro-rata share only, equivalent to the number of connections.
Discussion on Capital and Projects
Where relevant, Capital (Levels of Service) and Capital (Growth) projects have been included in the scheme financial details.
Levels of Service Projects and growth splits have been provided to ensure the costs of population driven works are clear.
<<
5-Waters-Volume-3-Wastewater


