<<
5-Waters Volume 2 - Water Supplies
13 Lake Coleridge Water Supply
13.1 Scheme Summary
Estimated Population Served
| 172
|
Scheme Coverage (1 Jan 2021)
| Full Charges | 58
|
| Half Charges | 0
|
| >1 Charges | 1
|
System Components
| Bores/Intakes (No.) | Sourced from Trust Power
|
| Treatment/Disinfection | UV |
| Reservoirs (No.) | Storage tank owned by Trust Power |
| Pump Stations (No.) | 1
|
| Piped (m) | 4,910
|
| History | Original scheme installation date | 1920's |
Value ($)
| Replacement Cost | $1,077,802
|
| Depreciated Replacement Cost | $693,688
|
| Financial | Operator cost (scheduled and reactive maintenance) per connection
| $1,032.71/connection
|
Demand (m3)
(1 Jan – 31 Dec 2020)
| Average daily | 26.3
|
| Peak daily | 74.1
|
| Minimum daily | 0.6
|
| Average daily per connection | 0.41
|
| Type of Supply | | On demand/unrestricted
|
Target Pressure & Flow at boundary
| Pressure | >310kPa |
| Flow | >20L/min |
| Sustainability | Well Security | Unsecure |
13.2 Key Issues
The following key issues are associated with the Lake Coleridge water supply. A list of district wide issues are located in 5Waters Activity Management Plan: Volume 1.
Table 13‑1 Lake Coleridge Scheme Issues
| Due to Lake Coleridge's isolated location and distance from the maintenance contractor's base the cost of operation and maintenance is high. The rating base is small and there are also limited skills available within Lake Coleridge. | Council will investigate the potential for enhanced remote monitoring. Council plan to investigate optimisation of maintenance and renewals to ensure costs stay at a minimum.
|
Additional treatment of the raw water will be required for compliance with DWSNZ.
| Council will identify options for improved water treatment (protozoa & turbidity) in accordance with the DWSNZ requirements and implement required upgrades. Council will also identify any demand management options work in conjunction with renewals. |
13.3 Overview & History
The water supply was installed to serve Electricorp's Township when the Lake Coleridge power station was built in the 1920's. Significant upgrade works occurred in 1994. On completion of these works to reticulation and treatment the Selwyn District Council took over the operation and maintenance of the scheme during 1994.
Water for the former hydro-electric power project village is drawn from the power station penstocks, ie by gravity directly from Lake Coleridge, an unprotected catchment. Water is treated (UV) but doesn't comply with DWSNZ. Customer supply pressure varies depending on the individual property elevation, but is reliable.
There is a small residential population but little commercial activity in the village. Recent subdivision developments in the Lake Coleridge basin including Terrace Downs Resort which is supplied from the Selwyn Rural Scheme.
In November 2011 a variation to the Rakaia River Water Conservation Order was made by Trust Power Ltd. Council staff had a number of concerns which they were submitted. An agreement was signed dated 11 July 2012 between the Council and TrustPower which stated:
“TrustPower will not, through the Coleridge Project, adversely affect the existing assets held and operated by the Council for the purposes of taking and conveying water from the Rakaia River for the purposes of stock water".
The community is located within the alpine fault line, and is expected to incur significant damage to its water infrastructure resulting from a 76MMI event.
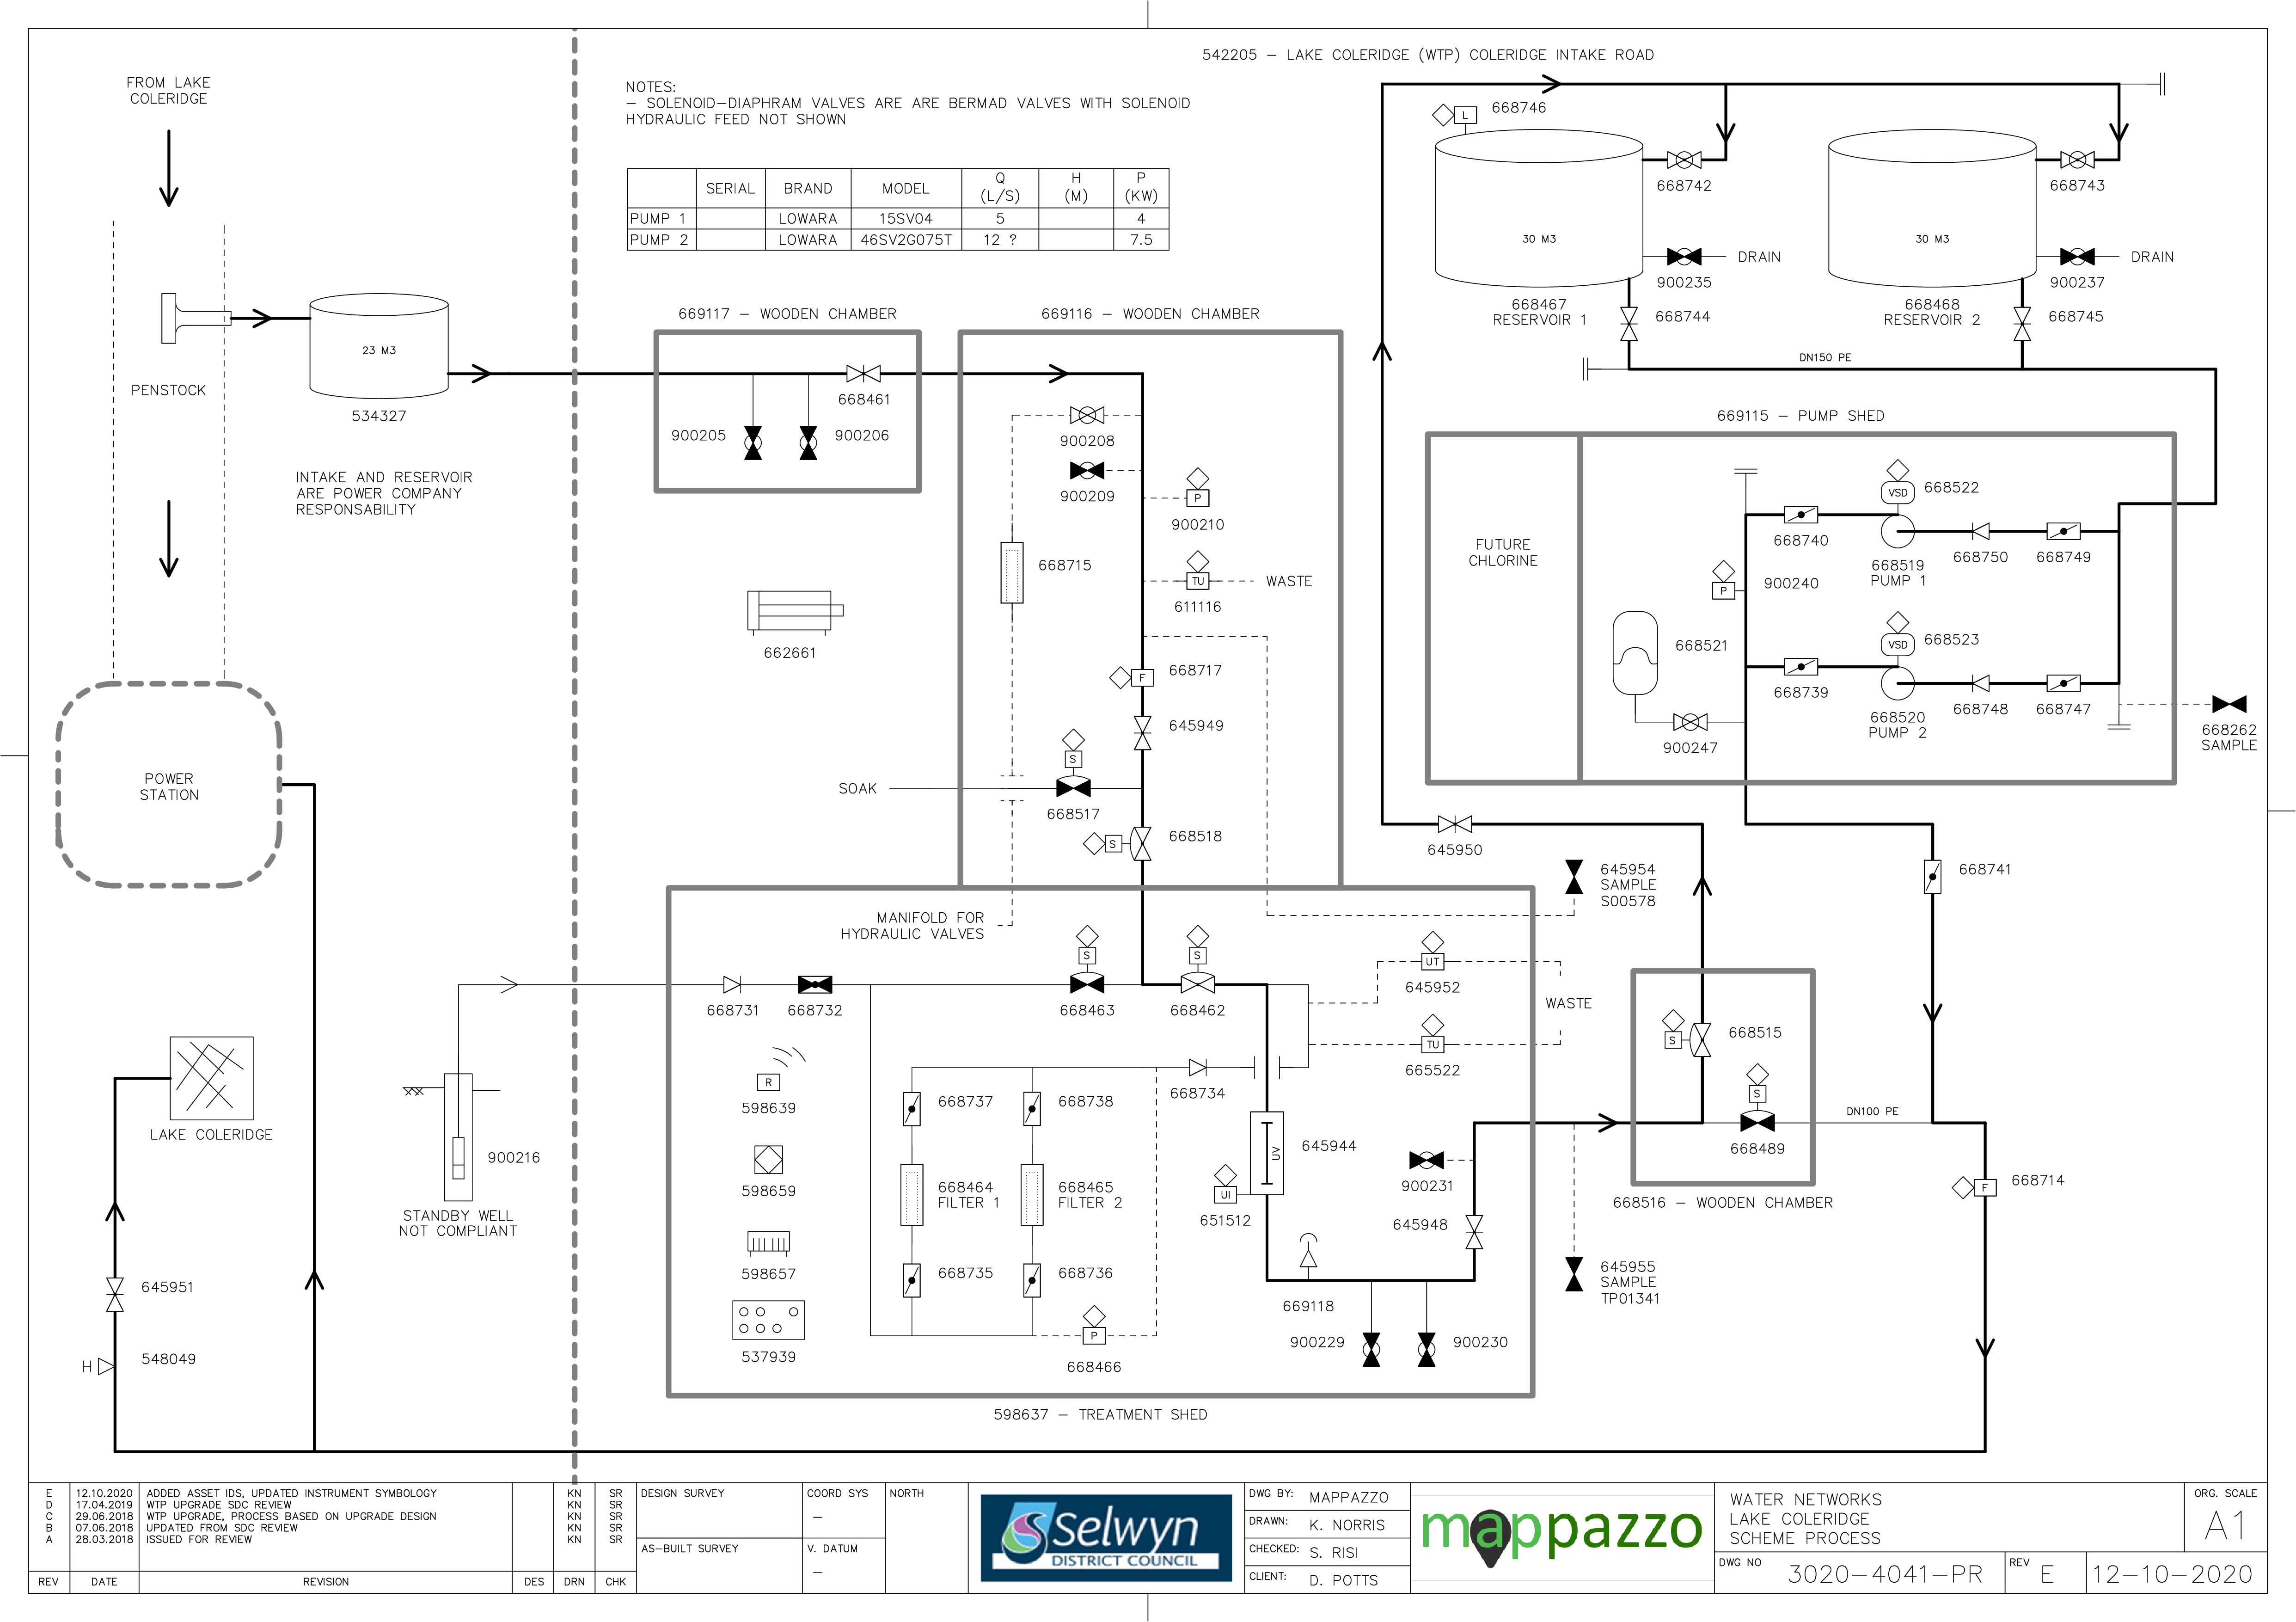
Figure 13‑2 Scheme Schematic
13.4 System Capacity
The water supply infrastructure provides sufficient capacity for the current level of development in Lake Coleridge Village and will be sufficient to meet some increased demand from allocated connections that are not presently in use. Further development of the village is subject to planning constraints and would require a Plan Change. Planning for growth related capacity upgrades will not be necessary until such time that a Plan Change is considered.
Access to water is governed by an agreement with TrustPower who hold the necessary resource consent.
Table 13‑2 Capacity Summary
| Abstraction Capacity | > treatment | - | - | TrustPower penstock intake |
| Treatment Capacity | Unknown | - | - | UV to be renewed |
| Consented Take | na | 500 | na | -
|
| Peak Demand | 13 * 4.3 ** | 205 *** | 22,700 12,860 **** | -
|
* Short duration, ** 24 Jan 2015, *** 18 Jan 2015, **** 2014
The 2013/14 peak day volume is much less (half) than the peak reported previously (after spurious data eliminated). Annual volume data from 2013/14 is incorrect – missing record.
13.5 Resource Consents
The Lake Coleridge water supply has a number of resource consents. Table 13‑3 shows the water take permitted by the resource consents for this scheme.
Table 13‑3 Resource Consents
CRC991051
| To take groundwater via bore K35/0005 at or about map reference NZMS 260 K35:906-588 for reserve public water supply and transformer cooling. | Lake Coleridge Township Water Supply, LAKE COLERIDGE | 15-Jan-99 | 13-Jan-34 | 3.5 | 101 |
13.6 Water Quality
The Lake Coleridge water supply is a non-secure source and is currently sampled weekly at the source, treatment plant and monthly in the reticulation zone.
The following details E. coli transgressions for the period 2012 to 2020.
Source
There have been 31 incidences of E. coli identified in source water samples during this period, highlighting the importance of water treatment for this scheme.
Figure 13‑3 E. coli Transgressions - Source
Treatment
There have been no E. coli transgression during this period.
Zone
There have been no E. coli zone transgressions during this period.
Chemical Analysis
The following is a summary of the raw water chemical analysis carried out at the Lake Coleridge Water Supply.
Table 13‑4 Lake Coleridge Water Supply Raw Water Chemical Analysis Summary
| Total Lead (g/m3) | 0.01 (Maximum Acceptable Value)
| 0.00021 | 0.000266 | ✓
|
| pH (pH units) | 7-8.5 (Guideline Value)
| 7.6 | 7.6 | ✓ |
| Total Hardness (g/m3 as CaCO3) | <200 (Guideline Value)
| 26 | 24.51 | ✓ |
| Total Calcium (g/m3) | n/v | 9.2 | 8.72 | ✓ |
| Total Iron (g/m3) | <0.2 (Guideline Value)
| <0.021 | < 0.021 | ✓
|
| Total Sodium (g/m3) | <200 (Guideline Value)
| 2.1 | 1.94 | ✓ |
| Nitrate - Nitrogen (g/m3) | 11.3 (Maximum Acceptable Value)
| <0.05 | < 0.05 | ✓
|
13.7 Scheme Assets
A summary of material and diameter for pipes in Lake Coleridge is shown in Figure 13‑4 and Figure 13‑5.
Figure 13‑4 Pipe Material – Lake Coleridge
Figure 13‑5 Pipe Diameter – Lake Coleridge
13.8 Operational Management
The water supply is operated and maintained under two maintenance contracts as follows:
- Contract 1241: Water Services Contract. Contract is with SICON who undertakes investigations, conditions inspections, proactive and reactive maintenance and minor asset renewals; and
- Contract 1202: Parks and Reserves Contract. Contract is with SICON who undertakes the maintenance of land scape features related to water services e.g. mowing, gardens etc.
Water quality sampling is completed under an agreement with Food and Health Ltd as required.
13.9 Photos of Main Assets
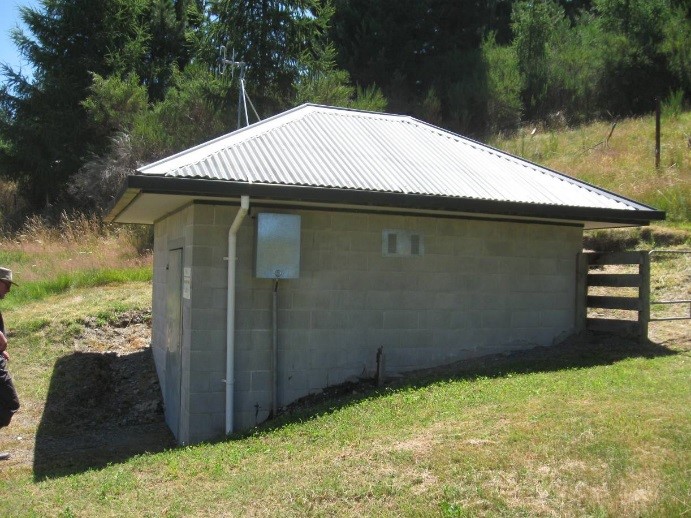
Photo 1: Treatment Shed
13.10 Risk Assessment
A risk assessment has been undertaken for the Lake Coleridge scheme. The key output from the risk assessment is the identification of any extreme and high risks which need to be mitigated. In order to mitigate these risks they have been included and budgeted for in the projects within this LTP. Table 13‑5 outlines the risk priority rating, Table 13‑6 outlines the risks and the list of key projects is found in Table 13‑11.
Table 13‑5 Risk Priority Rating
| > 50 | Extreme | Awareness of the event to be reported to Council. Urgent action to eliminate / mitigate / manage the risk. Document risk and action in the AMP. |
| 35-50 | Very High | Risk to be eliminated / mitigated / managed through normal business planning processes with responsibility assigned. |
| 14-35 | High | Manage risk using routine procedures. |
| 3.5-14 | Moderate | Monitor the risk. |
| < 3.5 | Low | Awareness of the event to be reported to Council. Immediate action required to eliminate / mitigate / manage the risk. Document risk and action in the AMP. |
Table 13‑6 Risks – Lake Coleridge
| Loss of power results in loss of treatment | Review options for a back up power source | 2014 | 45 | 45 | 45 |
| No water when water is turned off in shed as there is no storage (break pressure tank but no res) | Review option of emergency storage | 2014 | 20 | 20 | 45 |
| Electrical failure due to lightning or network spikes | Install surge diverters | 2014 | 10 | 10 | 10 |
| Failure to meet NES water meter standards | NES Water Meter Compliance | 2014 | 20 | 6 | 6 |
| Inability to collect income from non-metered properties | Install property water meters | 2014 | 27 | 27 | 2.1 |
| Non-consented activities | Renewal of consents | 2014 | 27 | 27 | 6 |
| Inadequate treatment under all conditions | Install filtration | 2017 | | 45 | 3.5 |
The list of district wide risks can be found in 5Waters Activity Management Plan: Volume 1.
13.11 Asset Valuation Details
The total replacement value of assets within the Lake Coleridge water scheme is $1,077,802 with details in Table 13‑7 below.
Table 13‑7 Replacement Value, Lake Coleridge
Plant and Equipment
| $450,003
|
Water Reticulation
| Hydrant | $32,339
|
| Lateral | $13,905
|
| Pipe | $492,855
|
| Supply Point | $54,570
|
| Valve | $34,130
|
13.12 Renewals
The renewal profile has been taken from the 2019 5 Waters Valuation. A graph showing the renewals for this scheme are shown by Figure 13‑6 below. The majority of renewals occur in 2028 and 2037.
Figure 13‑6 Lake Coleridge Water Renewal Profile
13.13 Critical Assets
The criticality model for Lake Coleridge has been updated for the 2021 AcMP. The methodology of the criticality model can be found in 5Waters Activity Management Plan: Volume 1 and it provides details of how the criticality has been calculated for the reticulation assets. Table 13‑8 and Figure 13‑7 below shows the calculated criticality for all of the assets within this scheme that have a recorded known length.
Table 13‑8 Length of Assets per Criticality Level
5
| Low | 1,620
|
4
| Medium-Low | 1,342
|
3
| Medium | 2,120
|
2
| Medium-High | 233
|
1
| High | 0 |
13.14 Asset Condition
The asset condition model was run for Lake Coleridge in 2021. The methodology of the model can be found in 5Waters Activity Management Plan: Volume 1 which provides details of how the model has been calculated for the pipe reticulation assets. Figure 13‑8 below shows the level of asset condition for these assets within this scheme that have a recorded known condition.
Table 13‑9 provides a description of the condition rating used within the condition model.
Table 13‑9 Asset Condition Grading
| 1.0 | Excellent |
| 2.0 | Good |
| 3.0 | Moderate |
| 4.0 | Poor |
| 5.0+ | Fail |
The number of pipe faults is also measured through the asset management system. Figure 13‑9 shows the known historic pipe failures within this scheme.
13.15 Funding Program
The 10 year budgets are shown by Table 13-10. Budgets are split into expenditure, renewals, projects and capital projects. Expenditure and renewals have been reported on a district-wide basis in Volume 1.
All figures are ($) not adjusted for CPI “inflation". They are calculated on historical data, and population growth where relevant.
Table 13-10 Budget Summary
| 2021/2022 | -
| -
|
2022/2023
| $10,000
| -
|
| 2023/2024 | -
| $100,000
|
| 2024/2025 | -
| -
|
| 2025/2026 | -
| -
|
| 2026/2027 | -
| -
|
| 2027/2028 | -
| - |
2028/2029
| -
| -
|
2029/2030
| -
| -
|
2031/2032
| -
| -
|
| Total | $10,000
| $100,000
|
An explanation of the categories within the budgets are as follows below:
-
Expenditure consists of operation and maintenance costs;
-
Renewals are replacement of assets which are nearing or exceeded their useful life;
-
Projects are investigations, decisions and planning activities which exclude capital works; and
-
Capital projects are activities involving physical works.
Table 13‑11 Key Projects
Capital Projects
| -
| Install pre-treatment (20 micron filtration)
| -
| -
| $100,000
| -
| 100% LoS
|
Projects
| -
| Investigation works for reticulation renewals
| -
| $5,000
| -
| -
| 100% LoS
|
Projects
| -
| Investigation: WWTP water supply
| -
| $5,000
| -
| -
| 100% LoS
|
* Where LoS refers to Level of Service and G refers to Growth
The list of district wide projects can be found in 5Waters Activity Management Plan: Volume 1.
Discussion on Projects
Projects have been determined based on their:
- Relevance to the scheme
- Requirement to be completed under legislation
- Ability to bring the scheme up to or maintain the Level of Service required under council's Asset Management Policy.
Many projects are jointly funded by more than one scheme and activity. Each scheme pays a pro-rata share only, equivalent to the number of connections.
Discussion on Capital and Projects
Where relevant, Capital (Levels of Service) and Capital (Growth) projects have been included in the scheme financial details.
Levels of Service Projects and growth splits have been provided to ensure the costs of population driven works are clear.
<<
5-Waters Volume 2 - Water Supplies


