<<
5-Waters Volume 2 - Water Supplies
12 Kirwee Water Supply
12.1 Scheme Summary
Estimated Population Served
| 1,326
|
Scheme Coverage (1 Jan 2021)
| Full Charges | 357
|
| Half Charges | 0
|
| >1 Charges | 101
|
System Components
| Bores/Intakes (No.) | 1
|
| Treatment/Disinfection | UV Treatment |
| Reservoirs (No.) | 1 |
| Pump Stations (No.) | 1
|
| Piped (m) | 52,583
|
| History | Original scheme installation date | 1981
|
Value ($)
| Replacement Cost | $5,920,750
|
| Depreciated Replacement Cost | $3,777,935
|
Financial
| Operator cost (scheduled and reactive maintenance) per connection
| $155.96/connection
|
Demand (m3) (1 Jan – 31 Dec 2020)
| Average daily | 606
|
| Peak daily | 1,963
|
| Minimum daily | -
|
| Average daily per connection | 1.2
|
| Type of Supply | | Medium pressure restricted and unrestricted |
Target Pressure & Flow at boundary
| Pressure | >310kPa (150kPa restricted) |
| Flow | >20 L/min (±10% maric restricted) |
| Sustainability | Well Security | Secure |
12.2 Key Issues
The following key issues are associated with the Kirwee water supply. A list of district wide issues are located in 5Waters Activity Management Plan: Volume 1.
Table 12‑1 Kirwee Scheme Issues
| Due to the significant growth of Kirwee, new wells are required to meet demand. | Council will continue to review the water infrastructure plan on an annual basis while considering actual and predicted growth. Infrastructure will be provided as and when required in consideration of the urban/industrial split. Detailed network modelling supports the infrastructure plan.
|
Catchment management
| To encompass a holistic view of the drinking water supply improved liaison with ECan and study of ground water quality within the water supply protection zones are being investigated.
|
Backflow risk
| To prevent water supplies from the risk of backflow there is currently a district wide backflow prevention project underway. The Kirwee backflow project would focus on providing backflow prevention for all high risk users, rural connections and preventing backflow from the rural to urban sections of the water scheme.
|
System redundancy
| System redundancy is highlighted as a key operational vulnerability due to the singular water source and treatment plant. To reduce this risk a second bore has been established with plan for connection to Kirwee water network.
|
12.3 Overview & History
The Kirwee water supply scheme is a high pressure metered on-demand (urban) and restricted (rural) scheme.
The water supply was installed in 1981 to replace individual supplies from roof tanks and water races. The township area was designed as a medium pressure, unrestricted supply, with restricted connections in the rural area for domestic use only (2m3/day per connection). The township zone scheme has full “Fire Fighting Capacity".
The pumping and control system was upgraded in 1997 with additional pumps installed in both 2005/06 and 2009/10.
During the 2015-28 LTP period UV treatment and a backup generator was added to the scheme.
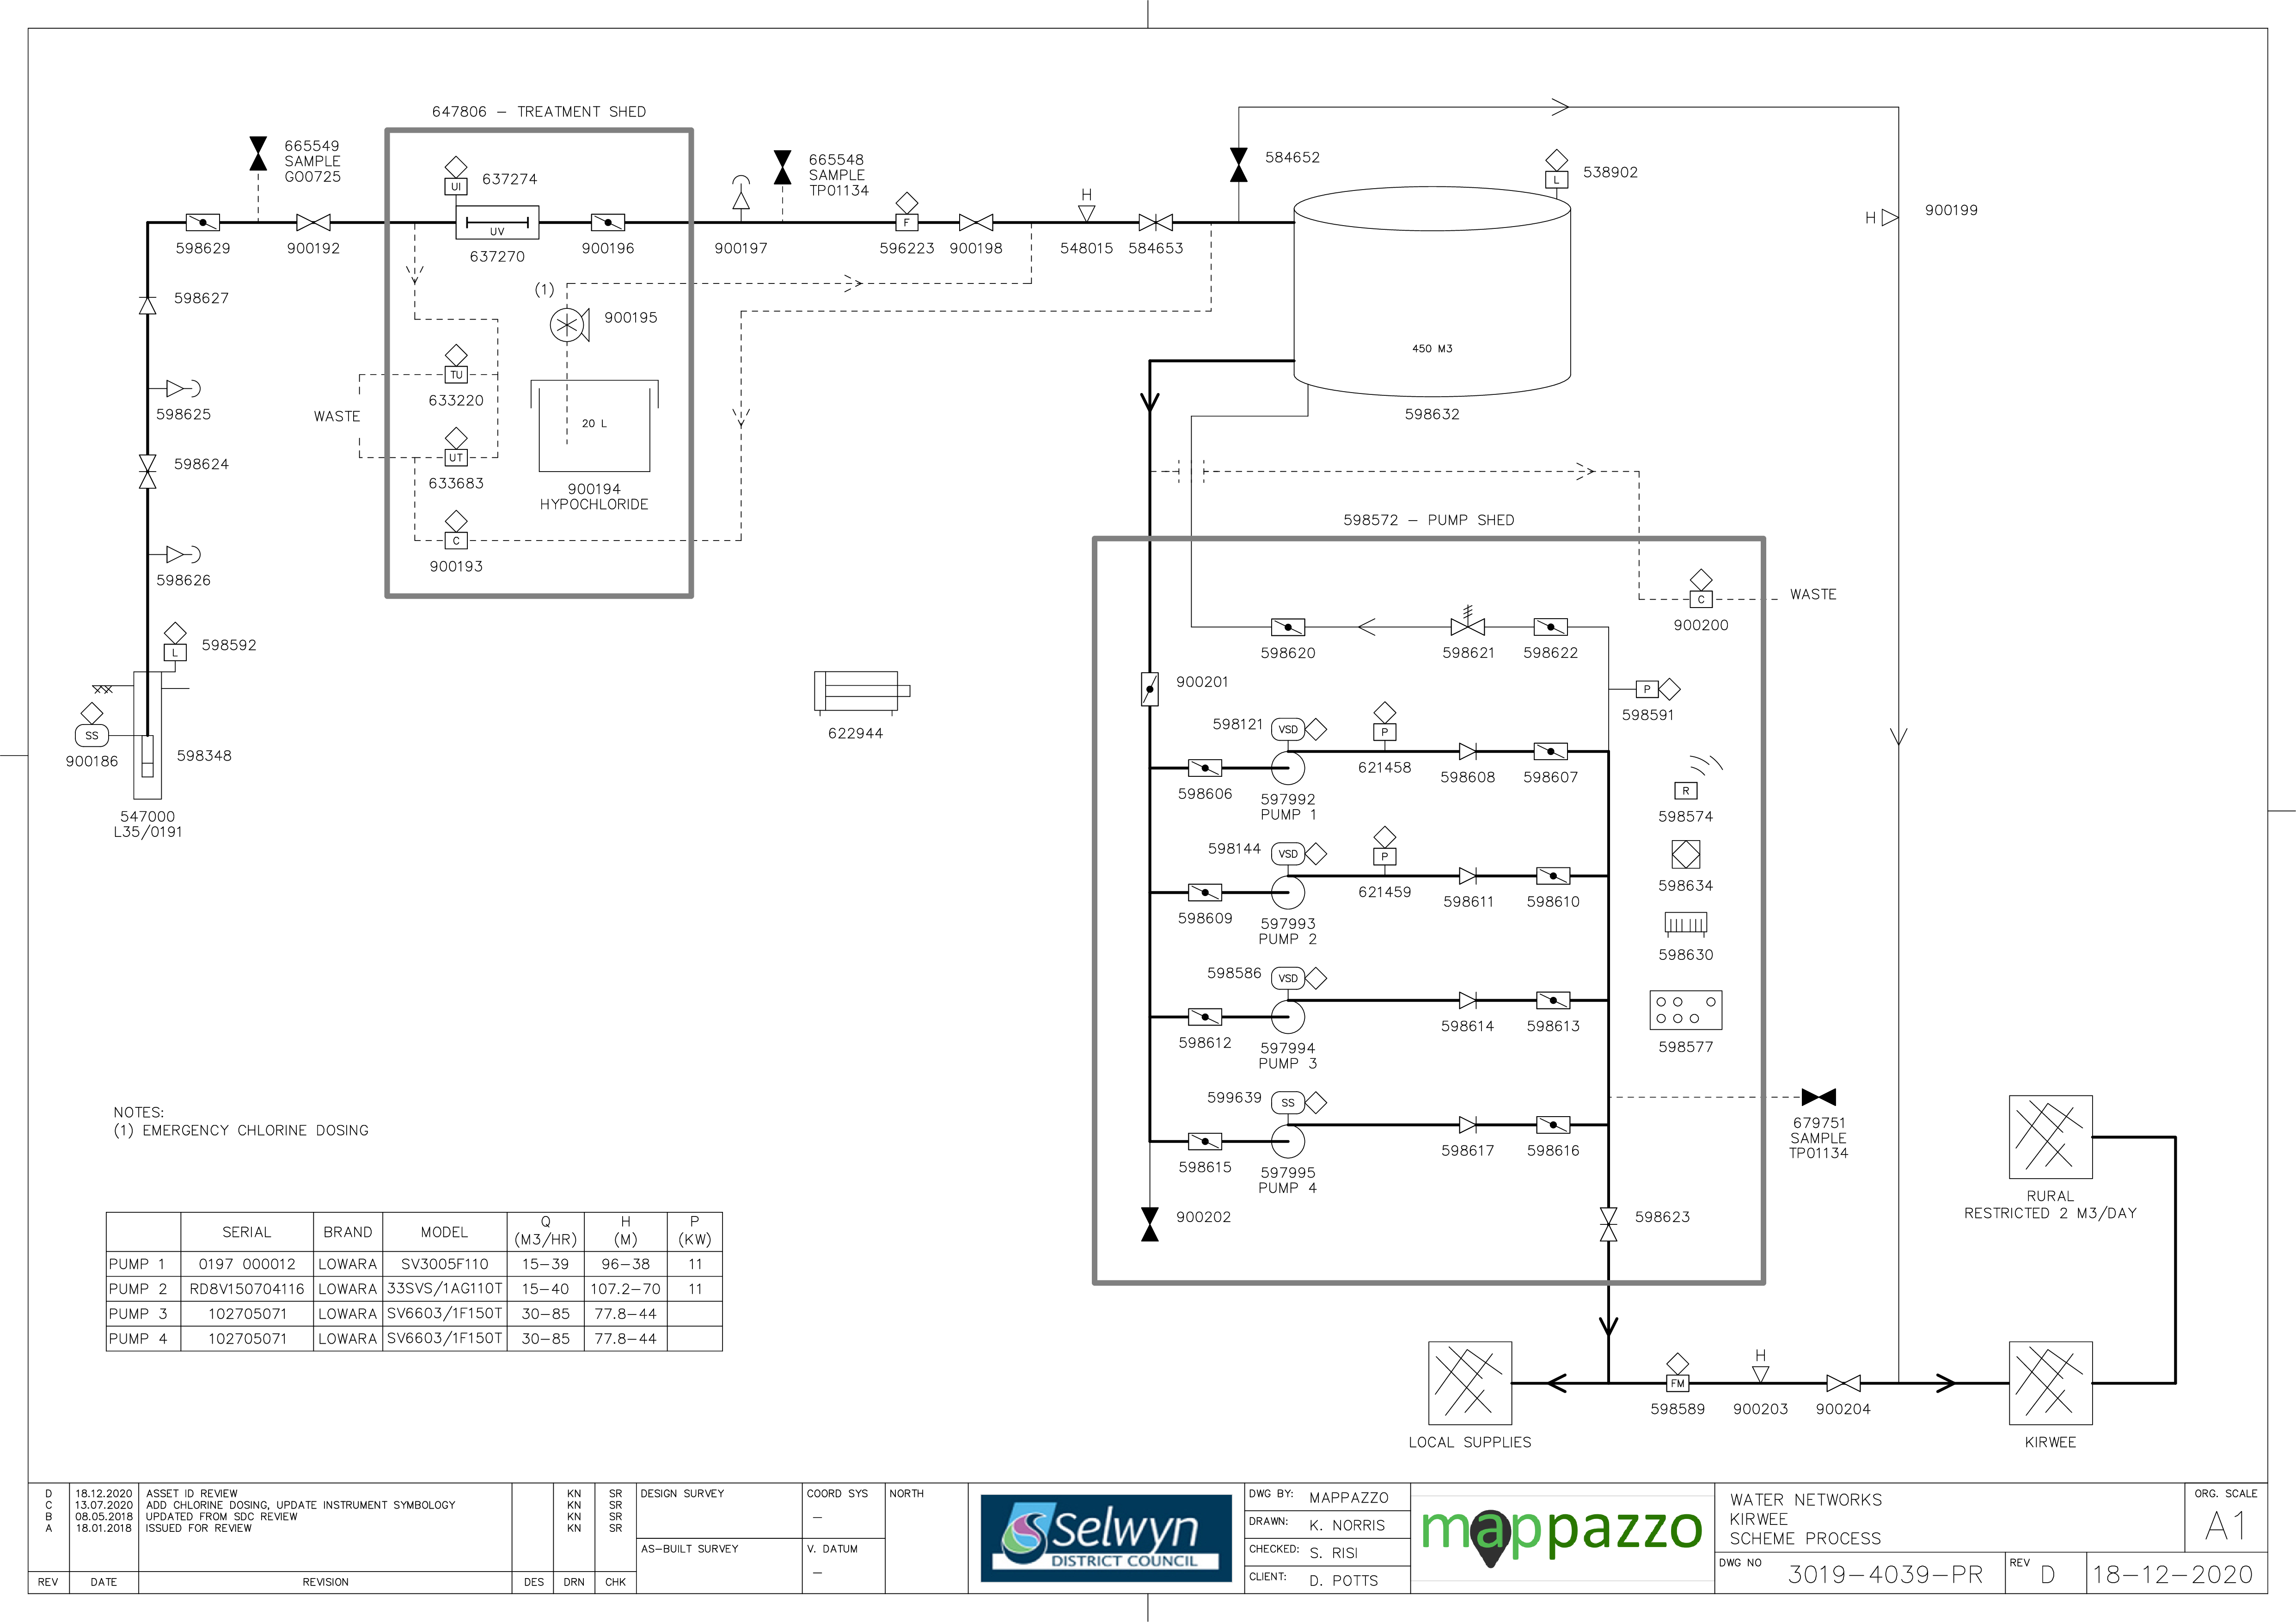
Figure 12‑2 Scheme Schematic
12.4 System Capacity
Kirwee has potential for growth in terms of zoned land availability and projections suggest growth over the next 30 years. The Kirwee supply also delivers a restricted supply to a small proportion (<10%) of properties. On-demand (town) connections typically use less water but generate a higher peak flow rate, while restricted (rural) connections require more water but this is trickle fed at a low flow rate. The restricted connections are not metered separately so this capacity assessment considers the supply as a whole.
Figure 12‑3 shows the projected growth in water demand for Kirwee in accordance with the latest house projections.
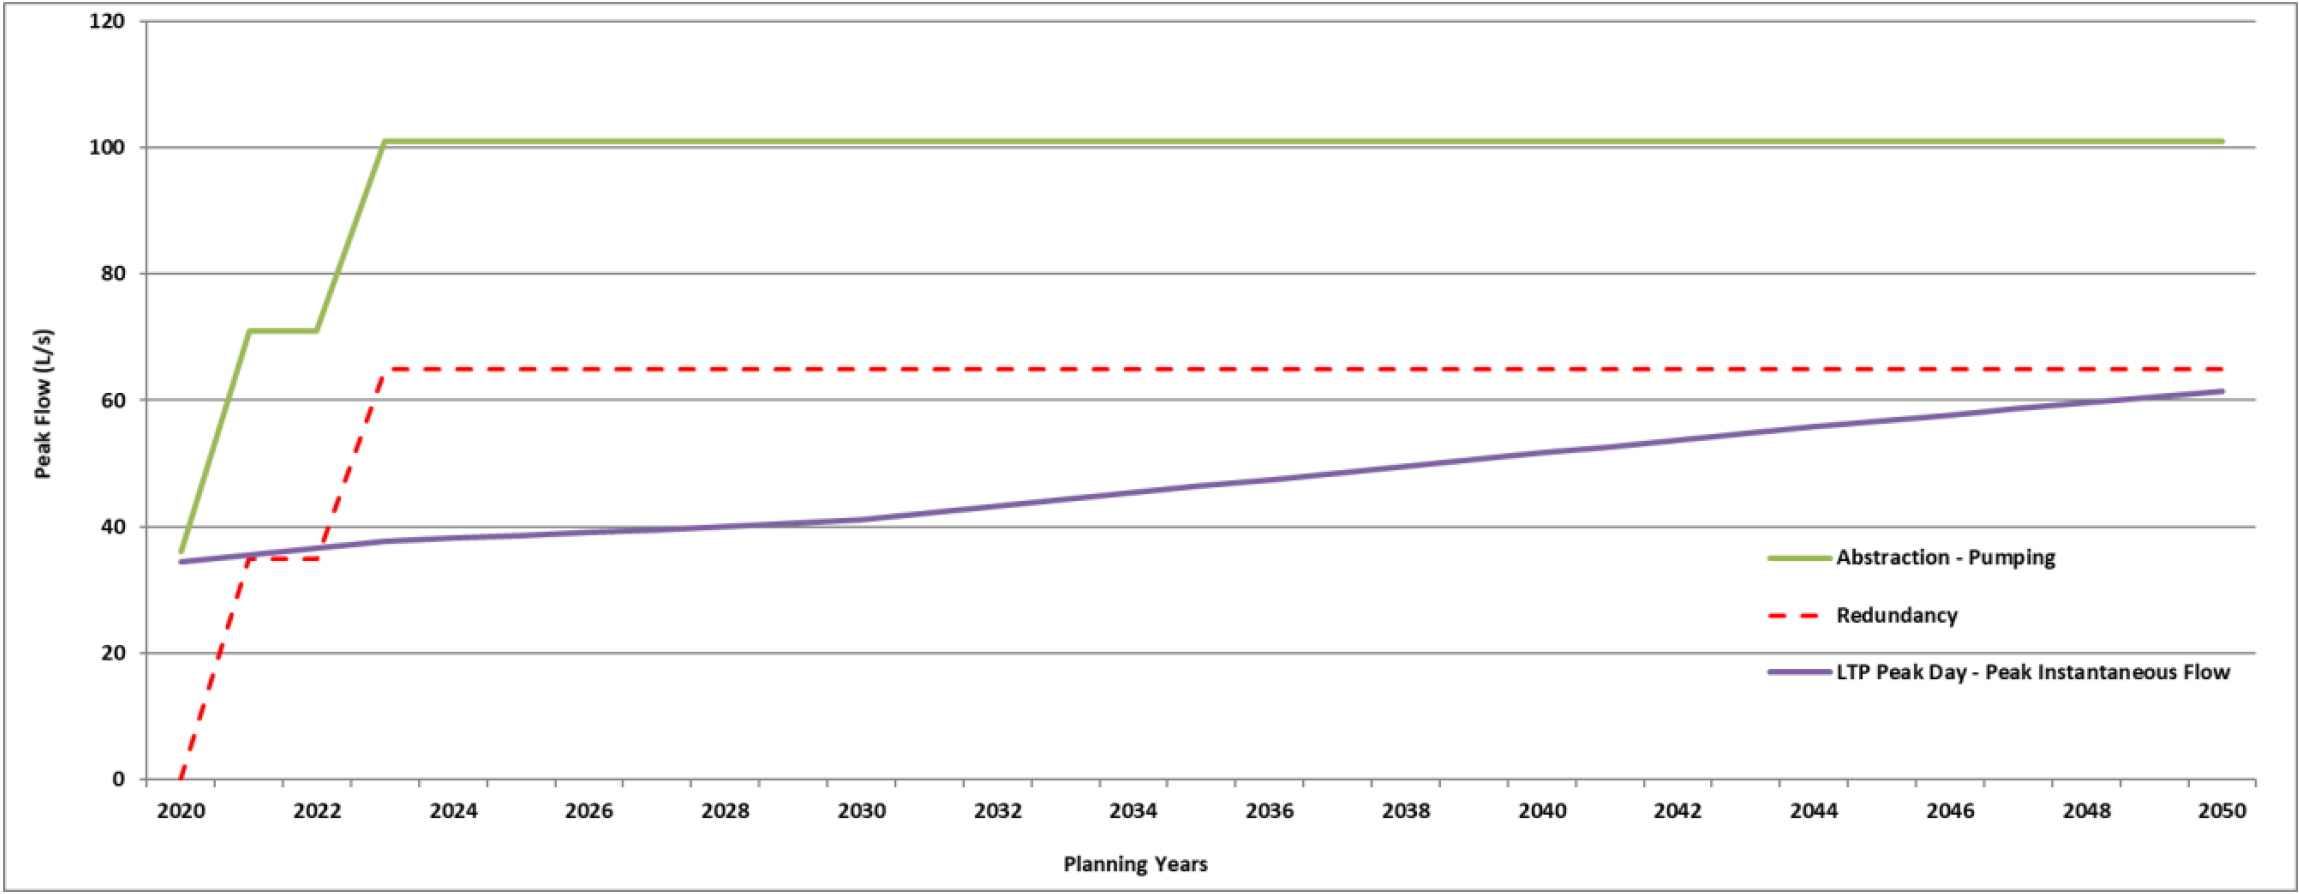
Figure 12‑3 Kirwee Water Demand
The water take consent limits the maximum rate of take to 45 L/s. This is greater than the installed pump capacity. There is 450 m3 of reservoir storage and a booster pumping system so the maximum flow rate that can be supplied to the community is 53 L/s. The water take consent limits the maximum daily take to 3110 m3 (21,770 in any 7 day period). The water supply is currently operating at its limit in terms of peak day demand and it is probable that water restrictions will need to be imposed from time to time to keep demand within the capacity of the infrastructure and the consented daily abstraction limit. Peak summer demands are very high relative to average winter demand (8x greater), suggesting considerable scope for demand management. Growth related infrastructure upgrades will be required. Council is trialling demand management measures which include reduced pressure management (reduced pressure 590KPA to 420KPA) and low level water restrictions. These issues may be resolved when the new source well comes online.
Table 12‑2 Existing Water Supply Capacity
| Consented Take | 45 | 3,110***
| 396,450 | CRC158020 |
Peak Demand - current
| 38L/s | 2,400 *
| 245,000 **
| -
|
Abstraction capacity
| 36 | 3,110 | - | One bore pump Capacity limited by consent |
Distribution pumping
| 53.2
| - | -
| 4 pumps (duty/assist) from 450m3 storage – can buffer peak flows but not peak days
|
* 15 January 2013, ** July 2012-June 2013, *** 21,770 per 7 days
Hydraulic models have been used to plan future water infrastructure for Kirwee, as part of a master planning exercise. The master planning provides an assessment of the sizing and timing of new infrastructure for new water sources (wells) and pipelines to service growth. Part of the master planning requires a water balance to be developed to forecast growth, using historical peak demand per household. The water balance forecasts the peak instantaneous flow per year versus the water resources available to determine the staging of new wells. The well staging assumes that one well is redundant for each water supply, to take into consideration maintenance of wells, planning/timing of new wells and security of supply i.e. to maintain average/peak demand.
The existing High Street well was modelled with a capacity of 36 L/s. The master planning exercise has identified that two new wells be required in Kirwee: one of which is near commissioining, and one which is required in 2022/23 to service growth (Table 12-4).
Table 12‑3 Water Source Current Capacity
Table 12‑4 Water Source Future Capacity
Kirw1
| New Site (nr. Kirwee Model School) | 2021/22
| 35
|
Additional
| TBC | 2022/23
| 30
|
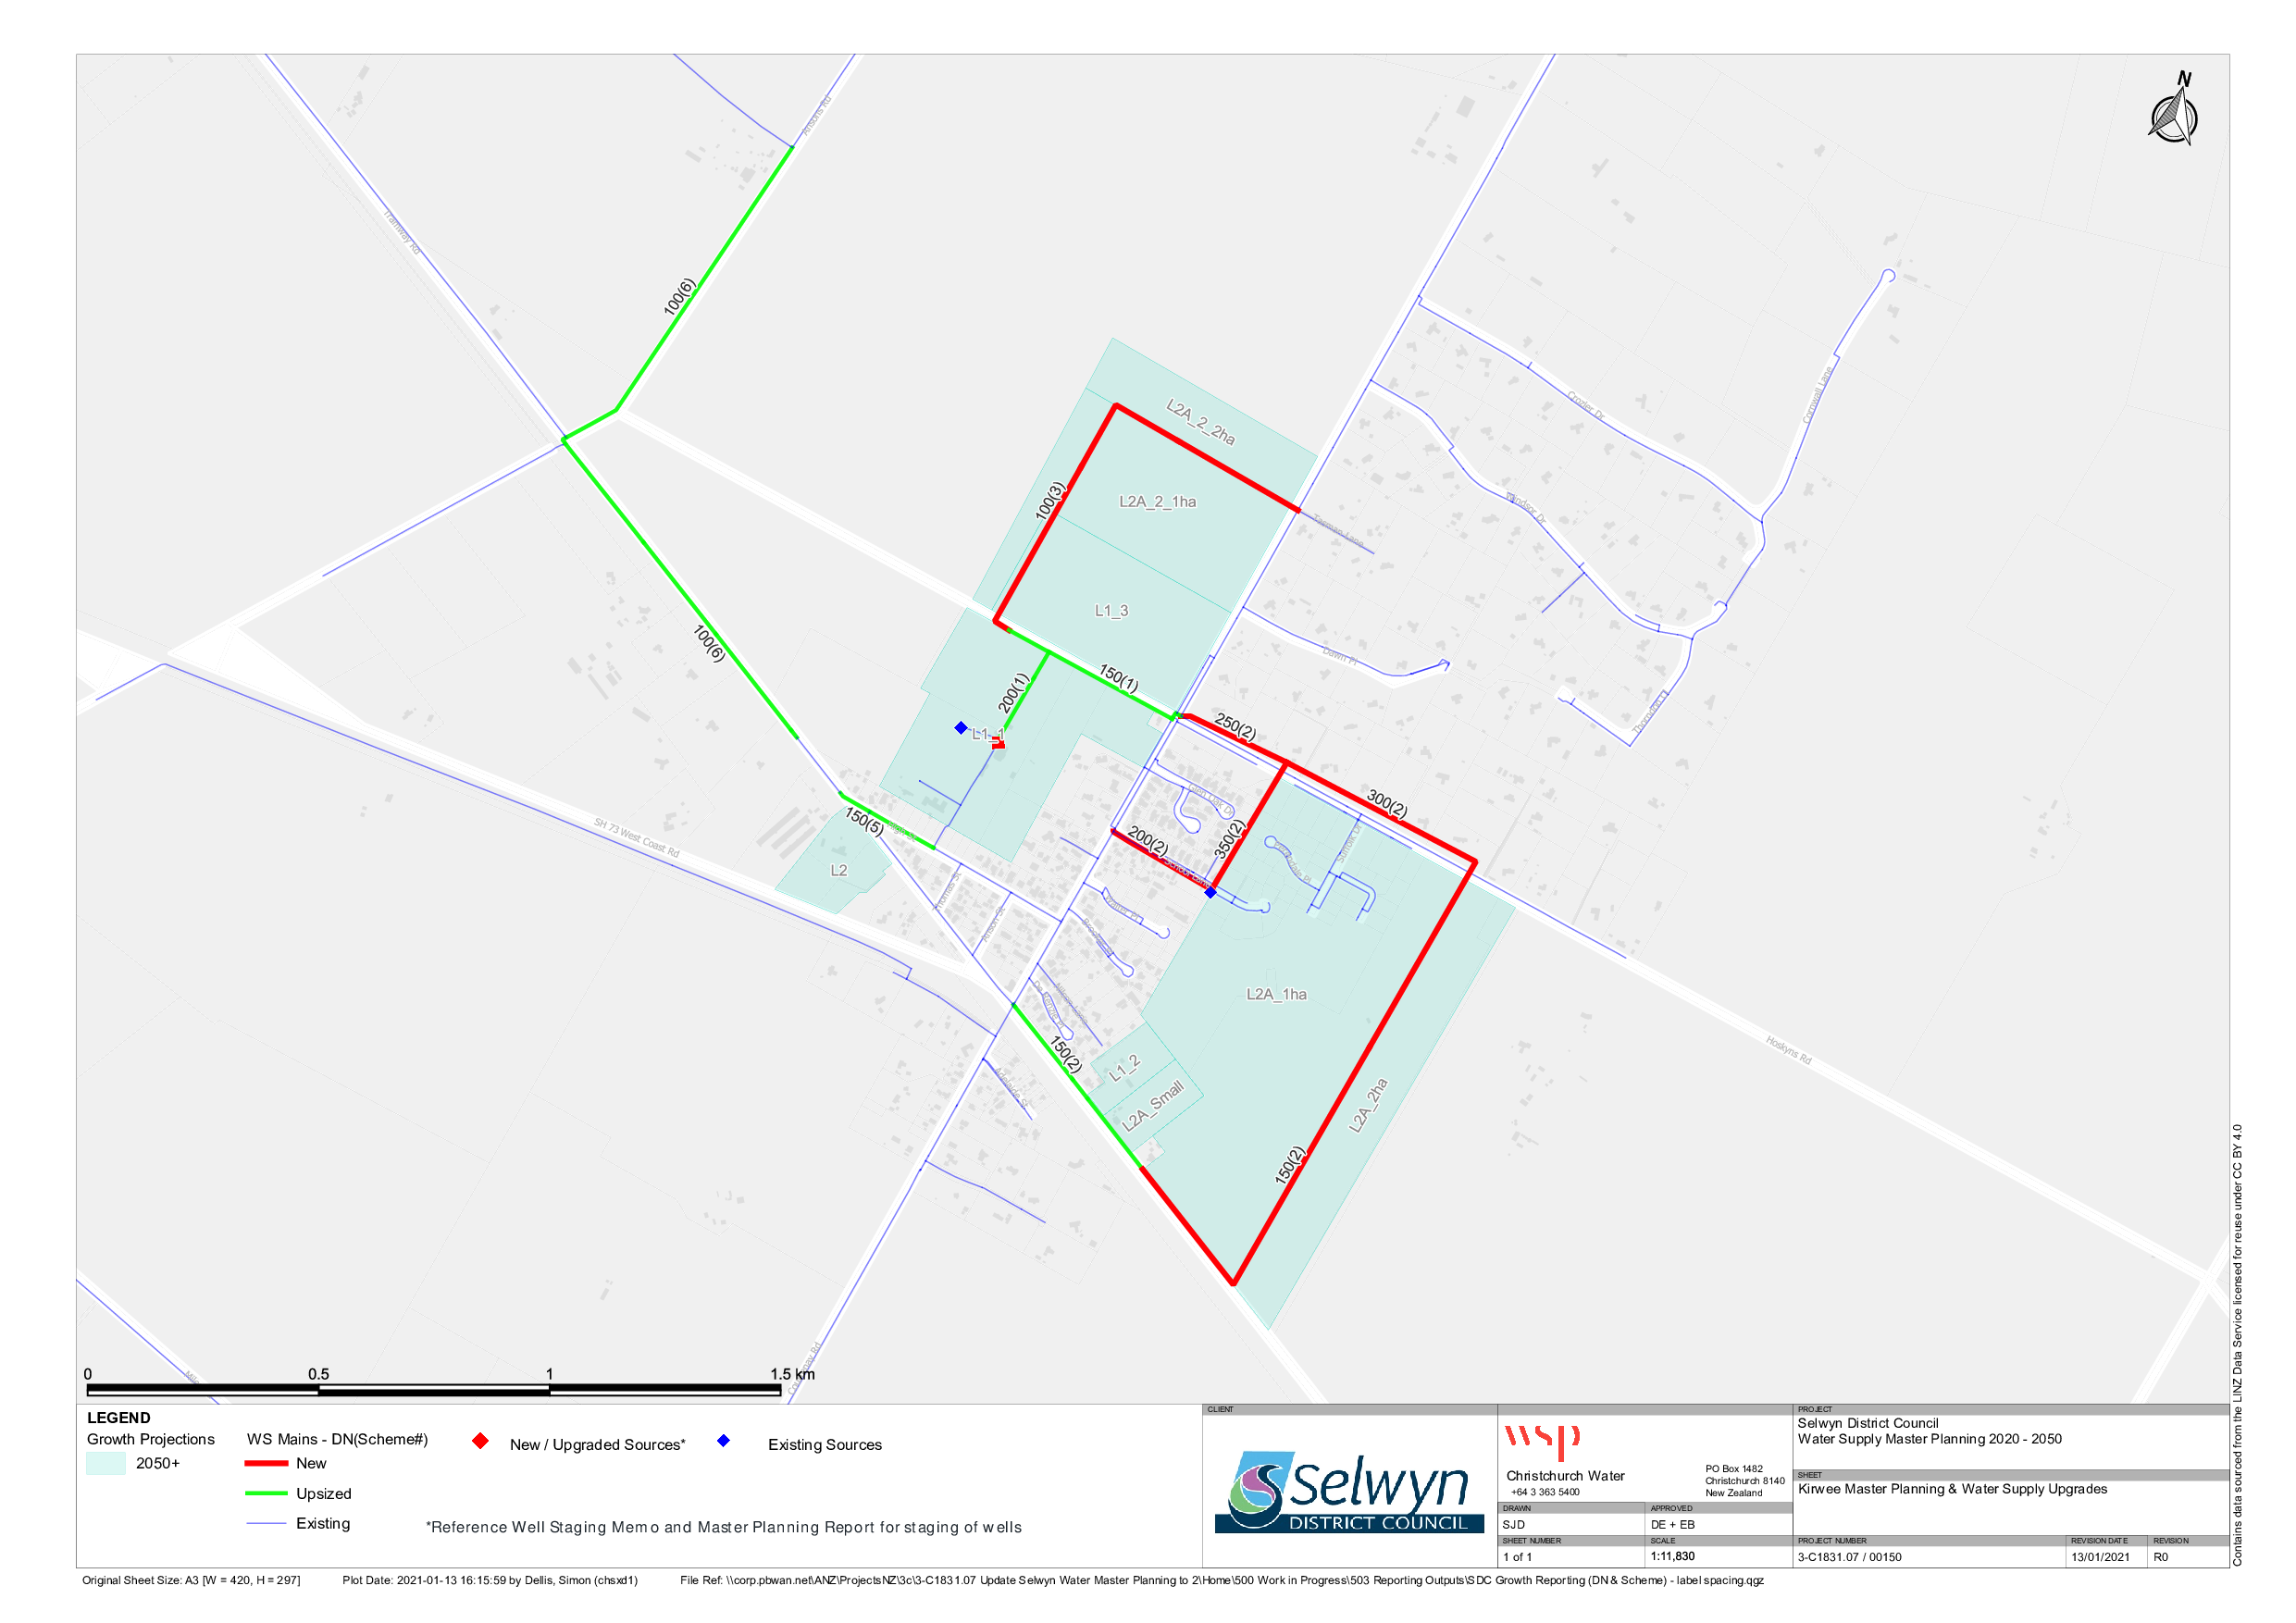
Figure 12‑4 Kirwee Master Plan
12.5 Resource Consents
The Kirwee water supply has a number of resource consents. Table 12‑5 shows the water take permitted by the resource consents for this scheme.
Table 12‑5 Resource Consents
| CRC158020 | To take and use groundwater. | Hoskyns Road, KIRWEE DOMAIN | 11-Sep-01 | 31-Jan-35 | 45 | 3110
(21,770 per 7 days) |
12.6 Water Quality
The Kirwee water supply is a secure source and is currently sampled twice weekly at the treatment plant and weekly in the reticulation zone. The following details E. coli transgressions for the period 2012 to 2020.
Treatment
There have been two E. coli Treatment transgressions during this period which occurred in September 2013 and June 2017.
Zone
There have been 6 E. coli treatment transgressions during this period (excluding re-samples). Most of these transgressions have been attributed to the reservoir which has been upgraded.
Chemical Analysis
The following is a summary of the raw water chemical analysis carried out at the Kirwee Water Supply.
Table 12‑6 Kirwee Water Supply Raw Water Chemical Analysis Summary
| Total Lead (g/m3) | 0.01 (Maximum Acceptable Value)
| 0.00011
| 0.00034
| 0.00025
| <0.00011
| 0.000114 | 0.00011
| 0.000194
| 0.000139
| ✓
|
pH (pH units)
| 7-8.5 (Guideline Value)
| -
| -
| -
| 7.8 | 7.7 | -
| 7.7
| 7.8
| ✓
|
| Total Hardness (g/m3 as CaCO3) | <200 (Guideline Value)
| 45
| 49
| 52
| 54
| 49.3
| 50.5
| 51.4
| 51.3
| ✓
|
| Total Calcium (g/m3) | n/v | 16
| 16.6
| 17.7
| 18.6
| 16.98 | 17.41
| 17.71
| 17.58
| ✓ |
| Total Iron (g/m3) | <0.2 (Guideline Value)
| 0.05
| <0.021
| <0.021
| <0.021 | < 0.021 | < 0.021
| < 0.021
| < 0.021
| ✓ |
| Total Sodium (g/m3) | <200 (Guideline Value)
| 7.3
| 7.7
| 7.9 | 8.4
| 7.94
| 8
| 8.38
| 7.72
| ✓ |
| Nitrate - Nitrogen (g/m3) | 11.3 (Maximum Acceptable Value)
| 3.6
| 3.9
| 4.4
| 4.8
| 4.32 | 3.99
| 4.37
| 4.91
| ✓
|
12.7 Scheme Assets
A summary of material and diameter for pipes in Kirwee is shown in Figure 12‑5 and Figure 12‑6.
Figure 12‑5 Pipe Material – Kirwee
Figure 12‑6 Pipe Diameter – Kirwee
12.8 Operational Management
The water supply is operated and maintained under two maintenance contracts as follows:
- Contract 1241: Water Services Contract. Contract is with SICON who undertakes investigations, conditions inspections, proactive and reactive maintenance and minor asset renewals; and
- Contract 1202: Parks and Reserves Contract. Contract is with SICON who undertakes the maintenance of land scape features related to water services e.g. mowing, gardens etc.
Water quality sampling is completed under an agreement with Food and Health Ltd as required.
12.9 Photos of Main Assets
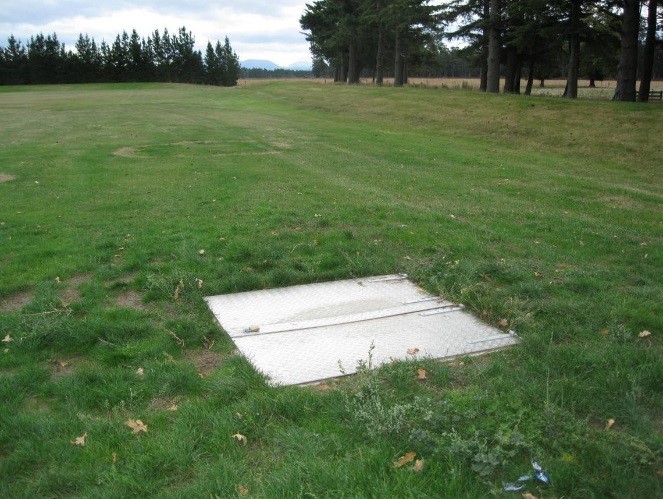
Photo 1: Well head
| 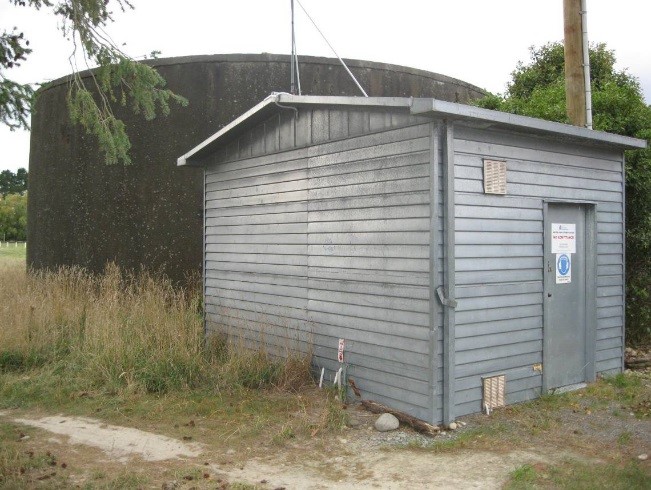
Photo 2: Reservoir and Pump Shed
|
12.10 Risk Assessment
A risk assessment has been undertaken for the Kirwee scheme. The key output from the risk assessment is the identification of any extreme and high risks which need to be mitigated. In order to mitigate these risks they have been included and budgeted for in the projects within this LTP. Table 12‑7 outlines the risk priority rating, Table 12‑8 outlines the risks and the list of key projects is found in Table 12‑13.
Table 12‑7 Risk Priority Rating
| > 50 | Extreme | Awareness of the event to be reported to Council. Urgent action to eliminate / mitigate / manage the risk. Document risk and action in the AMP. |
| 35-50 | Very High | Risk to be eliminated / mitigated / managed through normal business planning processes with responsibility assigned. |
| 14-35 | High | Manage risk using routine procedures. |
| 3.5-14 | Moderate | Monitor the risk. |
| < 3.5 | Low | Awareness of the event to be reported to Council. Immediate action required to eliminate / mitigate / manage the risk. Document risk and action in the AMP. |
Table 12‑8 Risks – Kirwee
| Single source of supply - risk of supply interruption | Commission and connect abandoned Darfield well or add alternative source. | 2014 | 40 | 40 | 20 |
| Electrical failure due to lightning or network spikes | Install surge diverters | 2014 | 20 | 7 | 7 |
| Failure to meet NES water meter standards | NES Water Meter Compliance | 2014 | 20 | 6 | 6 |
| Inability to collect income from non-metered properties | Install property water meters | 2014 | 27 | 0.6 | 0.6 |
| Non-compliance with the DWSNZ | DWSNZ - Age Testing | 2014 | 20 | 0.7 | 0.7 |
| Non-compliance with the DWSNZ | DWSNZ - Bore-head security | 2014 | 20 | 20 | 20 |
| Non-consented activities | Renewal of consents | 2014 | 27 | 27 | 6 |
| Backflow at treatment building | Install backflow | 2017 | | 10 | 2 |
| Ground chamber flooding | New soakhole to drain chamber | 2017 | | 20 | 7 |
The list of district wide risks can be found in 5Waters Activity Management Plan: Volume 1.
12.11 Asset Valuation Details
The total replacement value of assets within the Kirwee water scheme is $5,920,750 with further details in Table 12‑9 below.
Table 12‑9 Replacement Value, Kirwee
Plant and Equipment
| $1,099,287
|
Water Reticulation
| Hydrant | $171,742
|
| Lateral | $276,878
|
| Pipe | $3,854,378
|
| Supply Point | $397,034
|
| Valve | $121,431
|
12.12 Renewals
The renewal profile has been taken from the 2019 5 Waters Valuation. A graph showing the renewals for this scheme are shown by Figure 12‑7 below. There is a backlog of assets due for renewal, and another peak in renewals in 2029/30.
Figure 12‑7 Kirwee Water Renewal Profile
12.13 Critical Assets
The criticality model for Kirwee has been updated for the 2021 AcMP. The methodology of the criticality model can be found in 5Waters Activity Management Plan: Volume 1 and it provides details of how the criticality has been calculated for the reticulation assets. Table 12‑10 and Figure 12‑8 below shows the calculated criticality for all of the assets within this scheme that have a recorded known length.
Table 12‑10 Length of Assets per Criticality Level
5
| Low | 38,563
|
4
| Medium-Low | 4,391
|
3
| Medium | 5,737
|
2
| Medium-High | 520
|
1
| High | 269
|
12.14 Asset Condition
The asset condition model was run for Kirwee in 2021. The methodology of the model can be found in 5Waters Activity Management Plan: Volume 1 which provides details of how the model has been calculated for the pipe reticulation assets. Figure 12‑9 below shows the level of asset condition for these assets within this scheme that have a recorded known condition.
Table 12‑11 provides a description of the condition rating used within the condition model.
Table 12‑11 Asset Condition Grading
| 1.0 | Excellent |
| 2.0 | Good |
| 3.0 | Moderate |
| 4.0 | Poor |
| 5.0+ | Fail |
The number of pipe faults is also measured through the asset management system. Figure 12‑10 shows the known historic pipe failures within this scheme.
12.15 Funding Program
The 10 year budgets are shown by Table 12‑12. Budgets are split into expenditure, renewals, projects and capital projects. Expenditure and renewals have been reported on a district-wide basis in Volume 1.
All figures are ($) not adjusted for CPI “inflation". They are calculated on historical data, and population growth where relevant.
Table 12‑12 Budget Summary
| 2021/2022 | $26,000
| $50,000
|
2022/2023
| -
| $100,000
|
| 2023/2024 | -
| $100,000
|
| 2024/2025 | $5,000
| $400,000
|
| 2025/2026 | -
| $50,000
|
| 2026/2027 | -
| -
|
| 2027/2028 | -
| - |
2028/2029
| -
| -
|
2029/2030
| -
| -
|
2031/2032
| -
| -
|
| Total | $31,000
| $700,000
|
An explanation of the categories within the budgets are as follows below:
- Expenditure consists of operation and maintenance costs;
- Renewals are replacement of assets which are nearing or exceeded their useful life;
- Projects are investigations, decisions and planning activities which exclude capital works; and
- Capital projects are activities involving physical works.
Table 12‑13 Key Projects
Capital Projects
| -
| New ringmain and/or parallel water main
| -
| -
| -
| $400,000
| TBC
|
Capital Projects
| -
| Courtenay Road between Hoskins Road and Dawn Place: new connections
| -
| -
| $100,000
| -
| TBC
|
Capital Projects
| -
| Additional crossing of SH and rail; emergency line from Darfield
| -
| -
| -
| $50,000
| TBC
|
Capital Projects
| -
| Pressure sensors added to network
| $50,000
| -
| -
| -
| TBC
|
Capital Projects
| -
| Backflow prevention devices
| -
| $100,000
| -
| -
| TBC
|
Projects
| -
| Investigate options to improve system resilience/redundancy; investigate water loss; etc.
| $26,000
| -
| -
| $5,000
| TBC
|
* Where LoS refers to Level of Service and G refers to Growth
The list of district wide projects can be found in 5Waters Activity Management Plan: Volume 1.
Discussion on Projects
Projects have been determined based on their:
- Relevance to the scheme
- Requirement to be completed under legislation
- Ability to bring the scheme up to or maintain the Level of Service required under council's Asset Management Policy.
Many projects are jointly funded by more than one scheme and activity. Each scheme pays a pro-rata share only, equivalent to the number of connections.
Discussion on Capital and Projects
Where relevant, Capital (Levels of Service) and Capital (Growth) projects have been included in the scheme financial details.
Levels of Service Projects and growth splits have been provided to ensure the costs of population driven works are clear.
<<
5-Waters Volume 2 - Water Supplies


