The following key issues are associated with the Leeston water supply. A list of district wide issues are located in 5Waters Activity Management Plan: Volume 1.
The Leeston Water Supply provides untreated groundwater to both the Leeston and Doyleston townships.
Water is sourced from three bores, located on Gallipoli Street, Leeston and Lake Road and Leeston Dunsandel Road respectively. Three previously used bores have all been capped and removed from service: one on Pound Road (capped 1994), one on Market Street (capped 1995) and one on Gallipoli Street (capped 2020).
The Leeston scheme was designed as an unrestricted supply complying with the NZ Fire Fighting Code of Practice. In late 1999 a mobile standby generator was installed at Gallipoli Street pump station with automatic start up on power failure. This unit is also used to supply the Leeston Service Centre.
In 2006 the Leeston Water Supply was extended in order to service the Doyleston community located approximately 3km north-east of the Leeston township.
The Doyleston water supply is sourced from Leeston, a water supply which provides both treated and untreated groundwater to the community. The extension to the Leeston to Doyleston system was undertaken in 2006 after consultation with the Doyleston Community. The Doyleston extension consists of a reticulation network, three booster pumps and five 30m3 storage tanks. In January 2015 a new connection was made linking the Leeston to Doyleston main directly into the five reservoirs.
In December 2020, a new point of supply for the Leeston Water Supply scheme was introduced on Leeston Dunsandel Road. The new supply consisted of a deep bore consented at 100 L/s. A temporary container treatment plant was installed to allow for increased flow to the Leeston network to provide capacity for increasing summer water demand. The former Gallipoli Street generator was moved to this site to provide a back-up power contingency.
The Doyleston connection was originally designed as a restricted system, with firefighting capacity provided by 3x30m3 tanks. The system capacity allows for 2200L/property/day which is 272m3 per day. This limit is often exceeded with peak summer daily demand exceeding 296m3 which historically resulted in prolonged pressure drops. In February 2015 a new connection between the 'Leeston to Doyleston line' and the reservoir was made to increase capacity. Since the upgrade the system has performed well with reservoir levels being maintained.
Hydraulic models have been used to plan future water infrastructure for Leeston/Doyleston, as part of a master planning exercise. The master planning provides an assessment of the sizing and timing of new infrastructure for new water sources (wells) and pipelines to service growth. Part of the master planning requires a water balance to be developed to forecast growth, using historical peak demand per household. The water balance forecasts the peak instantaneous flow per year versus the water resources available to determine the staging of new wells. The well staging assumes that one well is redundant for each water supply, to take into consideration maintenance of wells, planning/timing of new wells and security of supply i.e. to maintain average/peak demand. Figure 14-3 shows the projected increase in water demand for Leeston & Doyleston based on housing projections, and including 7L/s of commercial demand.
The master planning exercise has identified that new wells are required over the LTP timeframe (Table 14-3).
Table 14‑2 Water Source Current Capacity
| Gallipoli well 1 | 1 | 18 |
| Gallipoli well 2 | 1 | 36 |
Lake Road well
(to be decommissioned)
| 1 | 17
|
Table 14‑3 Water Source Future Capacity
| Lee1 | Near Leeston Dunsandel Rd | 2020/21
| 60
|
| Lee2 | Decommission Lake Road well
| 2020/21
| -17 |
Lee3
| Near Leeston Dunsandel Rd | 2021/22
| 30
|
Additional well
| TBC
| 2035/36
| 45
|
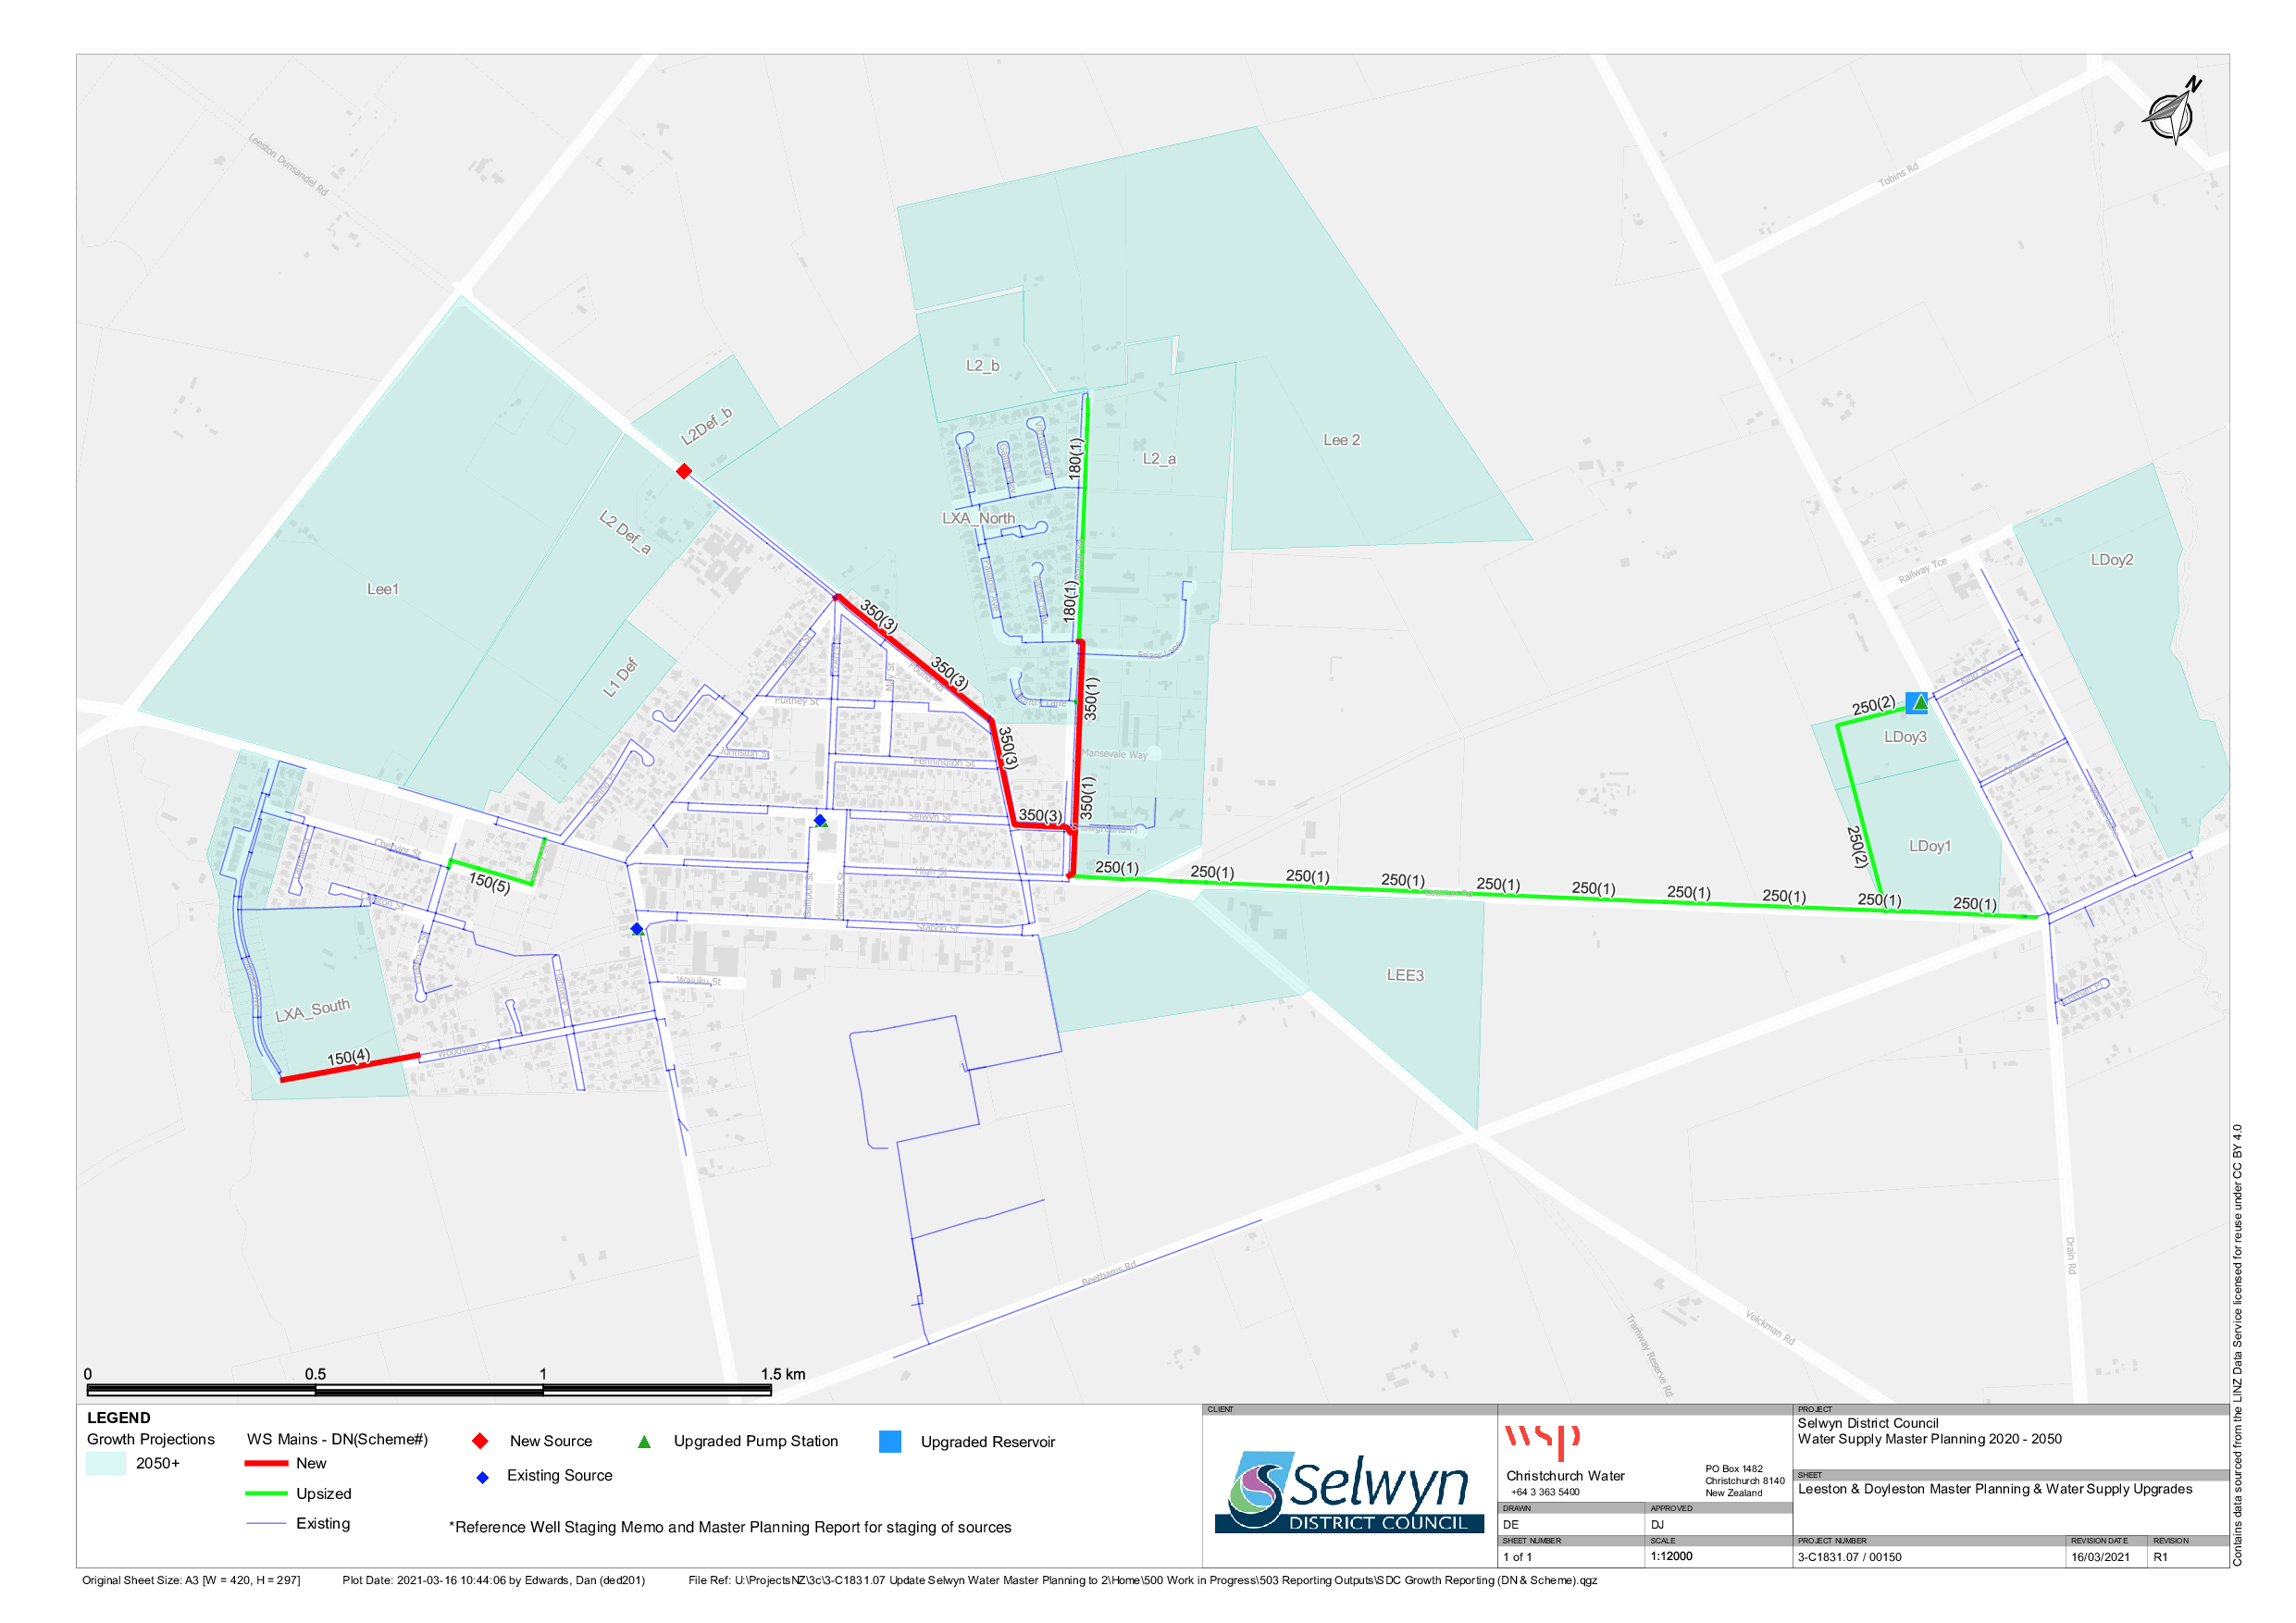
Figure 14‑4 Leeston Master Plan
14.5 Resource Consents
The Leeston water supply has a number of resource consents. Table 14‑4 shows the water take permitted by the resource consents for this scheme.
Table 14‑4 Resource Consents
CRC950937.1
| To take groundwater at or about map reference M36:53550-16049 for public supply. | Gallipoli Street, LEESTON | 12-Feb-10 | 22-Feb-30 | M36/4700
| 40
| 2,016 m3/day
Combined volume with CRC204063 of 623,400 m3 between 1 July - 30 June
|
CRC204063
| To take and use groundwater
| Leeston Dunsandel Road, Gallipoli Street, Leeston Road and Lake Road, Leeston
| 8-Oct-20
| 31-Jan-35 | M36/0670
M36/4700
M36/2746
BX23/0917
| 14
54 (combined with CRC950937.1)
22.7
65
| 816m3/day
2,992m3/day (combined with CRC950937.1)
1,324m3/day
|
14.6 Water Quality
The Leeston water supply made up of three wells which are secure and another well which is not yet classified. At the treatment plant, two wells are sampled weekly and the other is sampled quarterly. In the reticulation zone the sample is taken weekly.
The following details E. coli transgressions for the period 2012 to 2020.
Treatment
There have been no E. coli treatment transgressions during this period.
Zone
There have been four E. coli transgression during this period:
- Two in February 2014;
- Two in November 2019
Chemical Analysis
The following is a summary of the raw water chemical analysis carried out at the Leeston Water Supply.
Table 14‑5 Raw Water Chemical Analysis: Gallipoli Street bore
Total Lead (g/m3)
| 0.01 (Maximum
Acceptable
Value)
| <0.0001
| <0.00011
| <0.00011
| <0.00011
| <0.00011
| 0.000218
| <0.00011
| <0.00011
| ✓
|
pH (pH units)
| 7 - 8.5
(Guideline Value)
| 7.8
| 7.4
| 7.7
| 7.9
| 7.8
| 7.7
| 7.8
| 7.9
| ✓
|
Total Hardness (g/m3 as CaCO3)
| <200
(Guideline Value)
| 36
| 41
| 39
| 41
| 37.8
| 39.2
| 37.2
| 37.7
| ✓
|
Total Calcium (g/m3)
| None
| 11
| 12.1
| 11.7
| 11.9
| 11.13
| 11.71
| 11.00
| 11.12
| ✓
|
Total Iron (g/m3)
| <0.2
(Guideline Value)
| <0.02
| <0.021
| <0.021
| <0.021
| <0.021
| <0.021
| <0.021
| <0.021
| ✓
|
Total Sodium (g/m3)
| <200
(Guideline Value)
| 5.8
| 6.5
| 6.5
| 6.3
| 6.17
| 6.33
| 6.08
| 5.97
| ✓
|
Nitrate - Nitrogen (g/m3)
| 11.3 (Maximum
Acceptable
Value)
| 0.63
| 0.66
| 0.59
| 0.73
| 0.79
| 0.784
| 0.784
| 0.855
| ✓
|
Table 14‑6 Raw Water Chemical Analysis: Leeston and Lake Road bore
Total Lead (g/m3)
| 0.01 (Maximum
Acceptable
Value)
| <0.0001
| <0.00011
| 0.00033
| -
| <0.00011
| <0.001090
| <0.00011
| <0.00011
| ✓
|
pH (pH units)
| 7 - 8.5 (Guideline Value)
| 8
| 7.6
| 7.6
| 7.7
| 7.7
| 7.8
| 7.8
| 7.8
| ✓
|
Total Hardness (g/m3 as CaCO3)
| <200 (Guideline
Value)
| 32
| 41
| 40
| 38
| 44
| 38.7
| 36.0
| 38.5
| ✓
|
Total Calcium (g/m3)
| None
| 9.7
| 12.1
| 12.0
| 11.4
| 12.9
| 11.47
| 10.81
| 11.6
| ✓
|
Total Iron (g/m3)
| <0.2 (Guideline
Value)
| 0.29
| <0.021
| 0.022
| <0.021
| <0.021
| <0.021
| <0.021
| <0.021
| ✓
|
Total Sodium (g/m3)
| <200 (Guideline
Value)
| 5.6
| 6.3
| 6.2
| 5.9
| 6.5
| 6.16
| 5.91
| 6.04
| ✓
|
Nitrate - Nitrogen (g/m3)
| 11.3 (Maximum
Acceptable
Value)
| 0.45
| 0.69
| 0.9
| 0.77
| 1.08
| 1.052
| 0.85
| 1.158
| ✓
|
Table 14‑7 Raw Water Chemical Analysis: Leeston Dunsandel Road bore
Total Lead (g/m3)
| 0.01 (Maximum Acceptable Value)
| <0.00011
| ✓
|
pH (pH units)
| 7 - 8.5 (Guideline Value)
| 7.8
| ✓
|
Total Hardness (g/m3 as CaCO3)
| <200 (Guideline Value)
| 47
| ✓ |
Total Calcium (g/m3)
| None
| 13.5
| ✓
|
Total Iron (g/m3)
| <0.2 (Guideline Value)
| <0.021
| ✓
|
Total Sodium (g/m3)
| <200 (Guideline Value)
| 6.8
| ✓
|
Nitrate - Nitrogen (g/m3)
| 11.3 (Maximum Acceptable Value)
| 1.46
| ✓
|
14.7 Scheme Assets
A summary of material and diameter for pipes in Leeston is shown below in Figure 14-5 and Figure 14-6.
Figure 14-5 Pipe Material – Leeston / Doyleston
Figure 14-6 Pipe Diameter – Leeston / Doyleston
14.8 Operational Management
The water supply is operated and maintained under two maintenance contracts as follows:
- Contract 1241: Water Services Contract. Contract is with SICON who undertakes investigations, conditions inspections, proactive and reactive maintenance and minor asset renewals; and
- Contract 1202: Parks and Reserves Contract. Contract is with SICON who undertakes the maintenance of land scape features related to water services e.g. mowing, gardens etc.
Water quality sampling is completed under an agreement with Food and Health Ltd as required.
14.9 Photos of Main Assets

Photo 1: Gallipoli Street Well Head
|
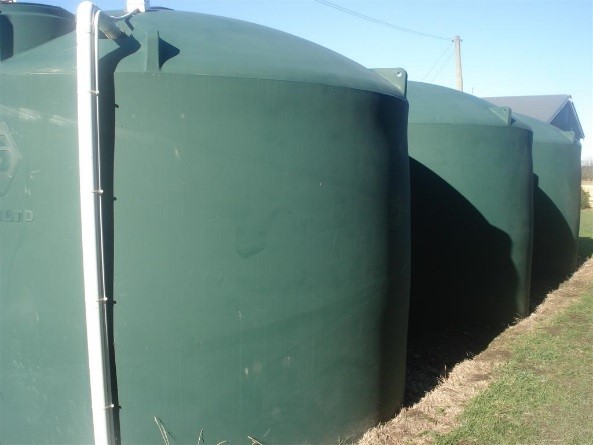
Photo 2: Doyleston Reservoirs
|
14.10 Risk Assessment
A risk assessment has been undertaken for the Leeston/Doyleston scheme. The key output from the risk assessment is the identification of any extreme and high risks which need to be mitigated. In order to mitigate these risks they have been included and budgeted for in the projects within this LTP. Table 14-8 outlines the risk priority rating, Table 14-9 outlines the risks and the list of key projects is found in Table 14-14.
Table 14‑8 Risk Priority Rating
| > 50 | Extreme | Awareness of the event to be reported to Council. Urgent action to eliminate / mitigate / manage the risk. Document risk and action in the AMP. |
| 35-50 | Very High | Risk to be eliminated / mitigated / managed through normal business planning processes with responsibility assigned. |
| 14-35 | High | Manage risk using routine procedures. |
| 3.5-14 | Moderate | Monitor the risk. |
| < 3.5 | Low | Awareness of the event to be reported to Council. Immediate action required to eliminate / mitigate / manage the risk. Document risk and action in the AMP. |
Table 14-9 Risks – Leeston
|
Leeston scheme |
| Leeston pressure is artificially high - risk of leaks and breaks | Review operational pressure set points | 2014 | 45 | 45 | 12 |
| System not operating at optimum | Review operation of Gallopli 2 Well | 2014 | 20 | 20 | 6 |
| Power failure and loss of supply capability | Mobile generator, swap for a fixed one | 2014 | 40 | 7 | 7 |
| Electrical failure due to lightning or network spikes | Install surge diverters | 2014 | 20 | 7 | 7 |
| Failure to meet NES water meter standards | NES Water Meter Compliance | 2014 | 20 | 6 | 6 |
| Inability to collect income from non-metered properties | Install property water meters | 2014 | 27 | 27 | 2.1 |
| Non-consented activities | Renewal of consents | 2014 | 27 | 27 | 6 |
| Inadequate treatment under all conditions | Install UV treatment | 2017 | | 2 | 2 |
| Inadequate capacity into the future | Additional bore | 2017 | | 45 | 6 |
|
Doyleston scheme |
| Health and safety risk due to location of pumps and pipework restricting access to electrical controls | Install new control building for electrical equipment | 2014 | 27 | 2.1 | 2.1 |
| Inadequate system capacity during times of peak demand | Install additional reservoir to increase capacity | 2014 | 27 | 12 | 12 |
| Undetected leaks or over-use | Install new flow meter at inlet to Reservoir | 2014 | 27 | 6 | 6 |
| Electrical failure due to lightning or network spikes | Install surge diverters | 2014 | 10 | 10 | 10 |
| Failure to meet NES water meter standards | NES Water Meter Compliance | 2014 | 20 | 6 | 6 |
| Inability to collect income from non-metered properties | Install property water meters | 2014 | 27 | 0.6 | 0.6 |
| Non-compliance with the DWSNZ | DWSNZ - Age Testing | 2014 | 10 | 0.7 | 0.7 |
| Non-compliance with the DWSNZ | DWSNZ - Bore-head security | 2014 | 10 | 0.2 | 0.2 |
| Non-consented activities | Renewal of consents | 2014 | 27 | 6 | 6 |
The list of district wide risks can be found in 5Waters Activity Management Plan: Volume 1.
14.11 Asset Valuation Details
The total replacement value of assets within the Leeston water scheme is $6,553,418 with further details in Table 14-10 below.
Table 14-10 Replacement Value, Leeston & Doyleston
Plant and Equipment
| $777,808
|
Water Reticulation
| Hydrant | $384,179
|
| Lateral | $192,352
|
| Pipe | $3,857,868
|
| Supply Point | $1,083,153
|
| Valve | $258,059
|
14.12 Renewals
The renewal profile has been taken from the 2019 5 Waters Valuation. A graph showing the renewals for this scheme are shown by Figure 14-7 below. The majority of renewals occur in2022 and 2032/33.
Figure 14-7 Leeston/Doyleston Water Renewal Profile
14.13 Critical Assets
The criticality model for Leeston/Doyleston has been updated for the 2021 AcMP. The methodology of the criticality model can be found in 5Waters Activity Management Plan: Volume 1 and it provides details of how the criticality has been calculated for the reticulation assets. Table 14-11 and Figure 14-8 below show the calculated criticality for all of the assets within this scheme that have a recorded known length.
Table 14‑11 Length of Assets per Criticality Level
5
| Low | 17,032
|
4
| Medium-Low
| 11,300
|
3
| Medium | 7,054
|
2
| Medium-High | 5,374
|
1
| High | 870
|
14.14 Asset Condition
The asset condition model was run for Leeston in 2021. The methodology of the model can be found in 5Waters Activity Management Plan: Volume 1 which provides details of how the model has been calculated for the pipe reticulation assets. Figure 14-9 below shows the level of asset condition for these assets within this scheme that have a recorded known condition.
Table 14-12 provides a description of the condition rating used within the condition model.
Table 14‑12 Asset Condition Grading
| 1.0 | Excellent |
| 2.0 | Good |
| 3.0 | Moderate |
| 4.0 | Poor |
| 5.0+ | Fail |
The number of pipe faults is also measured through the asset management system. Figure 14-10 shows the known historic pipe failures within this scheme.
14.15 Funding Program
The 10 year budgets for Leeston are shown by Table 14-13. Budgets are split into expenditure, renewals, projects and capital projects. Expenditure and renewals have been reported on a district-wide basis in Volume 1.
All figures are ($) not adjusted for CPI “inflation". They are calculated on historical data, and population growth where relevant.
Table 14‑13 Leeston Budget Summary
| 2021/2022 | $23,000
| $800,000
|
| 2022/2023 | $1,000
| $711,875
|
| 2023/2024 | -
| $140,000
|
| 2024/2025 | -
| -
|
| 2025/2026 | -
| -
|
| 2026/2027 | -
| -
|
2027/2028
| -
| -
|
2028/2029
| -
| -
|
2029/2030
| -
| $221,875
|
2030/2031
| -
| -
|
|
Total |
$24,000
|
$1,873,750
|
An explanation of the categories within the budgets are as follows below:
-
Expenditure consists of operation and maintenance costs;
-
Renewals are replacement of assets which are nearing or exceeded their useful life;
-
Projects are investigations, decisions and planning activities which exclude capital works; and
-
Capital projects are activities involving physical works.
There are several major projects for Leeston/Doyleston water scheme in the LTP budget.
Table 14‑14 Key Projects
| Capital Projects | 404490031 | Leeston growth
| $800,000
| $361,875
| -
| $221,875
| 100% G
|
| Capital Projects | TBC
| Second bore
| -
| -
| $140,000
| -
| 100% LoS
|
Capital Projects
| TBC
| Gallipoli reservoir or chlorine contact pipe
| -
| $250,000
| -
| -
| 100% LoS
|
Capital Projects
| TBC
| Additional 4 monitoring sites (pressure/flow/chlorine)
| -
| $100,000
| -
| -
| 100% LoS
|
Projects
| TBC
| Investigations (as-builts, pressure sensors, filtration, scheme operation)
| $23,000
| $1,000
| -
| -
| 100% LoS
|
* Where LoS refers to Level of Service and G refers to Growth
The list of district wide projects can be found in 5Waters Activity Management Plan: Volume 1.
Discussion on Projects
Projects have been determined based on their:
- Relevance to the scheme
- Requirement to be completed under legislation
- Ability to bring the scheme up to or maintain the Level of Service required under council's Asset Management Policy.
Many projects are
jointly funded by more than one scheme and activity. Each scheme pays a pro-rata share only, equivalent to the number of connections.
Discussion on Capital and Projects
Where relevant, Capital (Levels of Service) and Capital (Growth) projects have been included in the scheme financial details.
Levels of Service Projects and growth splits have been provided to ensure the costs of population driven works are clear.
<<
5-Waters Volume 2 - Water Supplies


