<<
5-Waters Volume 2 - Water Supplies
11 Jowers Road Water Supply
11.1 Scheme Summary
| Estimated Population Served | 53
|
Scheme Coverage (1 Jan 2021)
| Full Charges | 18
|
| Half Charges | 0
|
| >1 Charges | 0
|
System Components
| Bores/Intakes (No.) | 1 |
| Treatment/Disinfection | None |
| Reservoirs (No.) | 2 |
| Pump Stations (No.) | 1 |
| Piped (m) | 680
|
| History | Original scheme installation date | 1985 |
Value ($)
| Replacement Cost | $189,054
|
| Depreciated Replacement Cost | $91,779
|
Financial
| Operator cost (scheduled and reactive maintenance) per connection
| $1,474.88/connection
|
Demand (m3) (1 Jan – 31 Dec 2020)
| Average daily | 32.9
|
| Peak daily | 147.8
|
| Minimum daily | -
|
| Average daily per connection | 1.8
|
| Type of Supply | | Unrestricted tank supply |
Target Pressure & Flow at boundary
| Pressure | >150 kPA |
| Flow | >15 L/min |
| Sustainability | Well Security | Unsecure |
11.2 Key Issues
The following key issues are associated with the Jowers water supply. A list of district wide issues are located in 5Waters Activity Management Plan: Volume 1.
Table 11‑1 Jowers Scheme Issues
| The consent for the Jowers Road Water Supply expired in 2017. Council applied for a new consent 6 months prior to the consent expiring. | The water supply operates under consent continuance. Council will review options for connection to other sources e.g. West Melton. Council will review and update its demand management plans to align with resource consent conditions. |
| Some properties have no reasonable onsite storage should water failure occur. | It is the owner's responsibility to provide a minimum of two days storage. Council will continue to educate consumers, including but not limited to the LIM process and property file system. |
| Some connections are via other properties. This poses connection access problems and backflow associated risks. | Council review and confirm options for installation of backflow prevention devices and metering. |
11.3 Overview & History
Jowers Road Water Supply provides untreated groundwater to an 18 section subdivision (see schematics). Although the water supply was originally designed and installed (1985) as an unrestricted supply with all property owners requiring on site storage, the requirement for onsite storage was subsequently not enforced. The scheme was designed with no fire fighting capacity. A fire hydrant located in the reticulation can only be used for flushing of mains.
A new submersible pump was installed in 2006 to address peak demand capacity issues.
In November 2017 the original header tank was removed and replaced with a surface tank and booster pump station
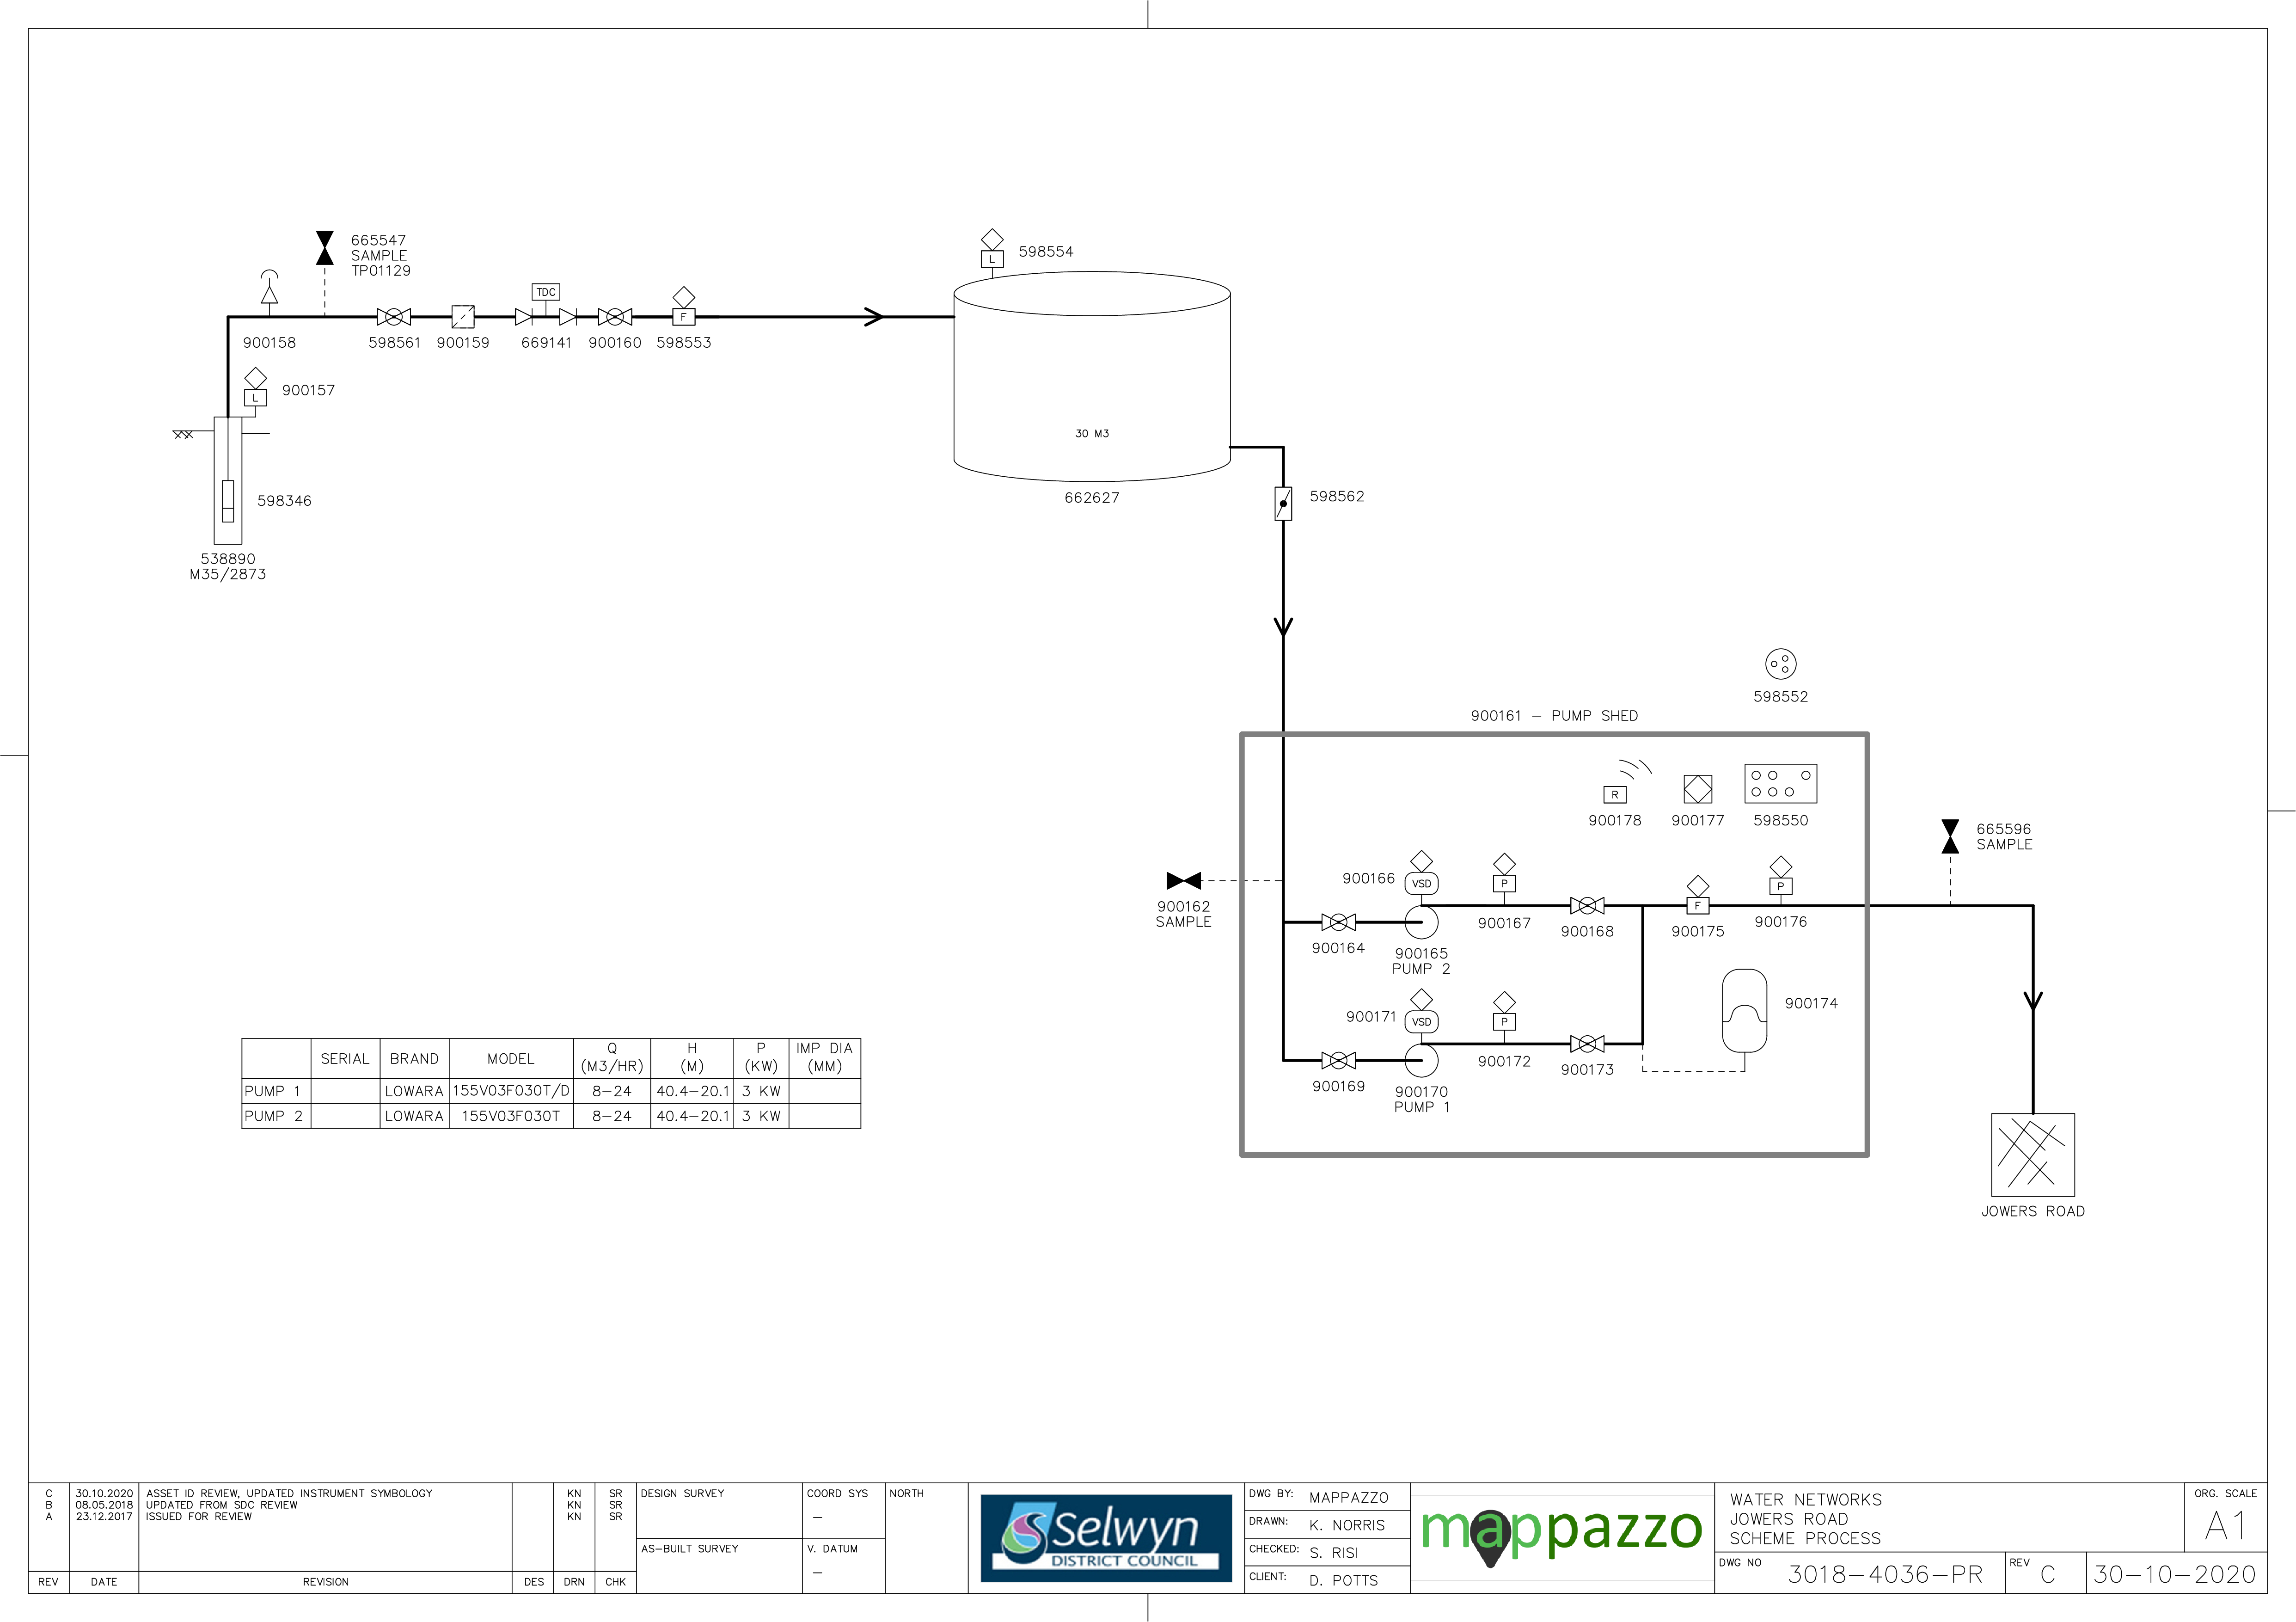
Figure 11‑2 Scheme Schematic
11.4 System Capacity
This water supply was developed to serve the 18 lot rural residential subdivision. All connections have been allocated and are utilised. No additional connections are anticipated. The supply is able to meet current peak demands without the need for water restrictions.
Table 11‑2 Capacity Summary
Abstraction Capacity
| 7.5
| 648
| - | 1 x bore pump (nom capacity) |
| Consented Take | 7.6 | 366 | 54,900 | |
Peak Demand
| - | - | 35,900 | Demand has reduced in recent years |
Bulk meter is manually read
|
11.5 Resource Consents
The Jowers Road water supply has a number of resource consents. Table 11‑3 shows the water take permitted by the resource consents for this scheme.
Table 11‑3 Resource Consents
CRC169801
| To take and use water
| Jowers Road, WEST MELTON | 14-Jun-18
| 14-Jun-38
| 7.6
| 366
(2,562 per 7 days) |
11.6 Water Quality
The Jowers Road water supply is a non-secure source which is currently sampled monthly for both the reticulation and weekly for the treatment plant.
The following details E. coli transgressions for the period 2012 to 2020.
Treatment
There have been two E. coli transgressions during this period, which occurred in April 2015 and April 2016.
Zone
There have been no E. coli transgressions during this period.
Chemical Analysis
The following is a summary of the raw water chemical analysis carried out at the Jowers Road Water Supply.
Table 11‑4 Jowers Road Water Supply Raw Water Chemical Analysis Summary
| Total Lead (g/m3) | 0.01 (Maximum Acceptable Value)
| 0.00063 | 0.000841 | ✓
|
pH (pH units)
| 7-8.5 (Guideline Value)
| 7.7 | 7.5 | ✓ |
| Total Hardness (g/m3 as CaCO3) | <200 (Guideline Value)
| 67 | 61.4 | ✓
|
| Total Calcium (g/m3) | n/v | 22 | 20.21 | ✓
|
| Total Iron (g/m3) | <0.2 (Guideline Value)
| <0.021 | < 0.021 | ✓ |
| Total Sodium (g/m3) | <200 (Guideline Value)
| 6.9 | 5.97
| ✓ |
| Nitrate - Nitrogen (g/m3) | 11.3 (Maximum Acceptable Value)
| 3 | 2.38 | ✓
|
11.7 Scheme Assets
A summary of material and diameter for pipes in Jowers Road is shown below in Figure 11‑3 and Figure 11‑4.
Figure 11‑3 Pipe Material – Jowers Road
Figure 11‑4 Pipe Diameter – Jowers Road
11.8 Operational Management
The water supply is operated and maintained under two maintenance contracts as follows:
- Contract 1241: Water Services Contract. Contract is with SICON who undertakes investigations, conditions inspections, proactive and reactive maintenance and minor asset renewals; and
- Contract 1202: Parks and Reserves Contract. Contract is with SICON who undertakes the maintenance of land scape features related to water services e.g. mowing, gardens etc.
Water quality sampling is completed under an agreement with Food and Health Ltd as required.
11.9 Photos of Main Assets
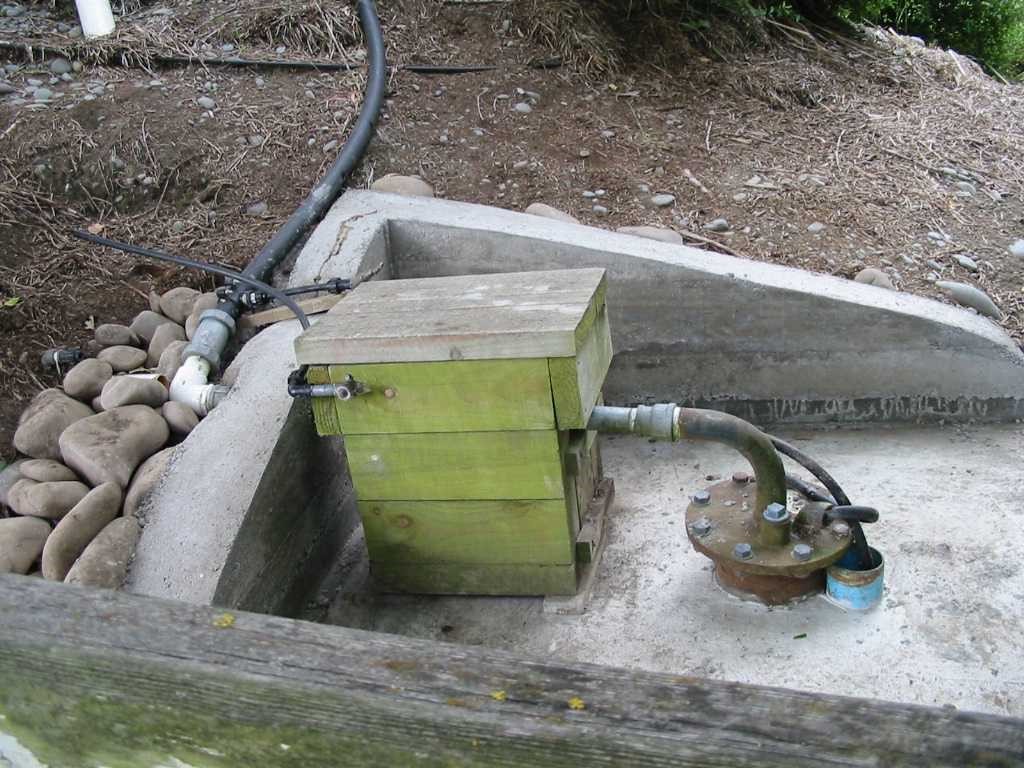
Photo 1: Well head
| 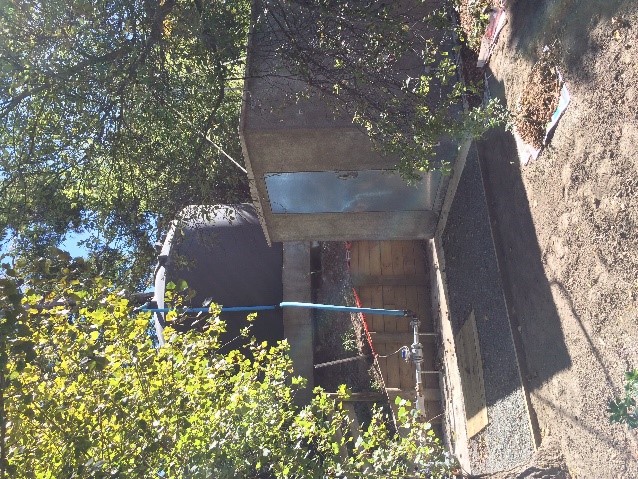
Photo 2: Reservoir and booster pump shed
|
11.10 Risk Assessment
A risk assessment has been undertaken for the Jowers Road scheme. The key output from the risk assessment is the identification of any extreme and high risks which need to be mitigated. In order to mitigate these risks they have been included and budgeted for in the projects within this LTP. Table 11‑5 outlines the risk priority rating, Table 11‑6 outlines the risks and the list of key projects is found in Table 11‑11.
Table 11‑5 Risk Priority Rating
| > 50 | Extreme | Awareness of the event to be reported to Council. Urgent action to eliminate / mitigate / manage the risk. Document risk and action in the AMP. |
| 35-50 | Very High | Risk to be eliminated / mitigated / managed through normal business planning processes with responsibility assigned. |
| 14-35 | High | Manage risk using routine procedures. |
| 3.5-14 | Moderate | Monitor the risk. |
| < 3.5 | Low | Awareness of the event to be reported to Council. Immediate action required to eliminate / mitigate / manage the risk. Document risk and action in the AMP. |
Table 11‑6 Risks – Jowers Road
| Compliance of DWS (Protozoa) | Install a UV unit | 2014 | 27 | 27 | 27 |
| Health and safety issues with tank stand | New reservoir and surface booster pump required | 2014 | 45 | 45 | 2.1 |
| Electrical failure due to lightning or network spikes | Install surge diverters | 2014 | 6 | 6 | 6 |
| Failure to meet NES water meter standards | NES Water Meter Compliance | 2014 | 20 | 20 | 2.1 |
| Inability to collect income from non-metered properties | Install property water meters | 2014 | 27 | 27 | 2.1 |
| Non-consented activities | Renewal of consents | 2014 | 27 | 27 | 6 |
| Inadequate treatment under all conditions | Install filtration | 2017 | | 27 | 2.1 |
The list of district wide risks can be found in 5Waters Activity Management Plan: Volume 1.
11.11 Asset Valuation Details
The total replacement value of assets within the Jowers Road water scheme is $189,054 with further details in Table 11‑7 below.
Table 11‑7 Replacement Value, Jowers Road
Plant and Equipment
| $107,025
|
Water Reticulation
| Hydrant
| $4,620
|
Lateral
| $11,650
|
|
| Pipe | $43,626
|
| Supply Point | $21,498
|
| Valve | $635
|
11.12 Renewals
The renewal profile has been taken from the 2019 5 Waters Valuation. A graph showing the renewals for this scheme are shown by Figure 11‑5 below. The majority of renewals are due now, with further peaks in 2029 and 2033/34.
Figure 11‑5 Jowers Road Water Renewal Profile
11.13 Critical Assets
The criticality model for Jowers Road has been updated for the 2021 AcMP. The methodology of the criticality model can be found in 5Waters Activity Management Plan: Volume 1 and it provides details of how the criticality has been calculated for the reticulation assets. Table 11‑8 and Figure 11‑6 below shows the calculated criticality for all of the assets within this scheme that have a recorded known length.
Table 11‑8 Length of Assets per Criticality Level
5
| Low | 328
|
4
| Medium-Low | 9
|
3
| Medium | 393
|
2
| Medium-High | 0 |
1
| High | 0 |
11.14 Asset Condition
The asset condition model was run for Jowers Road in 2021. The methodology of the model can be found in 5Waters Activity Management Plan: Volume 1 which provides details of how the model has been calculated for the pipe reticulation assets. Figure 11‑7 below shows the level of asset condition for these assets within this scheme that have a recorded known condition.
Table 11‑9 provides a description of the condition rating used within the condition model.
Table 11‑9 Asset Condition Grading
| 1.0 | Excellent |
| 2.0 | Good |
| 3.0 | Moderate |
| 4.0 | Poor |
| 5.0+ | Fail |
The number of pipe faults is also measured through the asset management system. Figure 11‑8 shows the known historic pipe failures within this scheme.
11.15 Funding Program
There are no projects specific to the Jowers Road scheme in the LTP budget. District-wide projects are shown in Volume 1.
<<
5-Waters Volume 2 - Water Supplies


