<<
5-Waters Volume 2 - Water Supplies
26 Te Pirita Water Supply
26.1 Scheme Summary
Estimated Population Served
| 28
|
Scheme Coverage (1 Jan 2021)
| Full Charges | 9
|
| Half Charges | 0 |
| >1 Charges | 1 |
System Components
| Bores/Intakes (No.) | 1
|
| Treatment/Disinfection | 1
|
| Reservoirs (No.) | 2 |
| Pump Stations (No.) | 1 |
| Piped (m) | 23,370.2
|
| History | Original scheme installation date | Unknown
|
Value ($)
| Replacement Cost | $1,952,998.88 |
| Depreciated Replacement Cost | $1,094,175.62 |
| Financial | Operator cost (scheduled and reactive maintenance) per connection
| $2,448.47/connection
|
Demand (m3) (1 Jan – 31 Dec 2020)
| Average daily | 169.9
|
| Peak daily | 365
|
| Minimum daily | 7.3
|
Average daily per connection
| 10.0
|
| Type of Supply | | Unrestricted metered tank supply |
Target Pressure & Flow at boundary
| Pressure | >150kPa
|
| Flow | ±10% maric size |
| Sustainability | Well Security | Secure |
26.2 Key Issues
The following key issues are associated with the Te Pirita water supply. A list of district wide issues are located in 5Waters Activity Management Plan: Volume 1.
Table 26‑1 Te Pirita Scheme Issues
| The change in farming practice, especially from sheep and cattle to dairying has increased the demand for water. Dairy farming is more labour intensive and requires high quality water for cleaning of milking equipment. | Council will review the metering data and the associated impacts of demand. This will assist in identifying any capacity constraints that may exist. Metering will assist in ensuring that equitable payment for water use is made. |
| The Te Pirita scheme pipes were used for conveyance of river water prior to commissioning of the deep well in 1999. Repair reports in 2011 identified that they were not flushed prior to this change over. The silt has coagulated in the base of the pipes, and could affect water quality. | Initial flushing has occurred. Investigate options for silt removal. Proceed with silt removal and a methodology for maintenance of high quality water delivery including removal of silt is to be prepared by Council.
|
Catchment management
| To encompass a holistic view of the drinking water supply improved liaison with ECan and study of groundwater quality within the water supply protection zones are being investigated.
|
26.3 Overview & History
The Te Pirita Water Supply provides untreated groundwater to a rural area of 2719ha. Water is obtained from a single deep well in the community. The bore has been demonstrated as a source of secure groundwater. All connections within this scheme for domestic and stock use currently have a double check valves (backflow prevention device).
The area was originally served by the Snowden Water Race System (operated by the then Malvern County Council). Due to the inability of the water race scheme to give a reliable supply the Ellesmere County Council installed a piped supply to serve the Ellesmere area served by the then Snowden supply.
The scheme was designed as a restricted supply for stock use only. Restrictors were never installed and consequently the scheme operates as an on demand scheme directly into tanks and stock troughs, except for Robindale Lodge which is supplied directly.
Initially the water was chlorinated at the pump station. This was never satisfactory as water quality varied significantly (supplied from Ellesmere Stock Water Race).
In 1998 the scheme intake was replaced by a deep well and associated variable speed submersible pump.
Installation of water meters on each individual connection occurred in 2005/06, and per cubic metre charging was initiated.
A single bore pump delivers water to 5 x 30m3 tanks, from which two pumps provide water to consumers’ tanks (no restrictors).
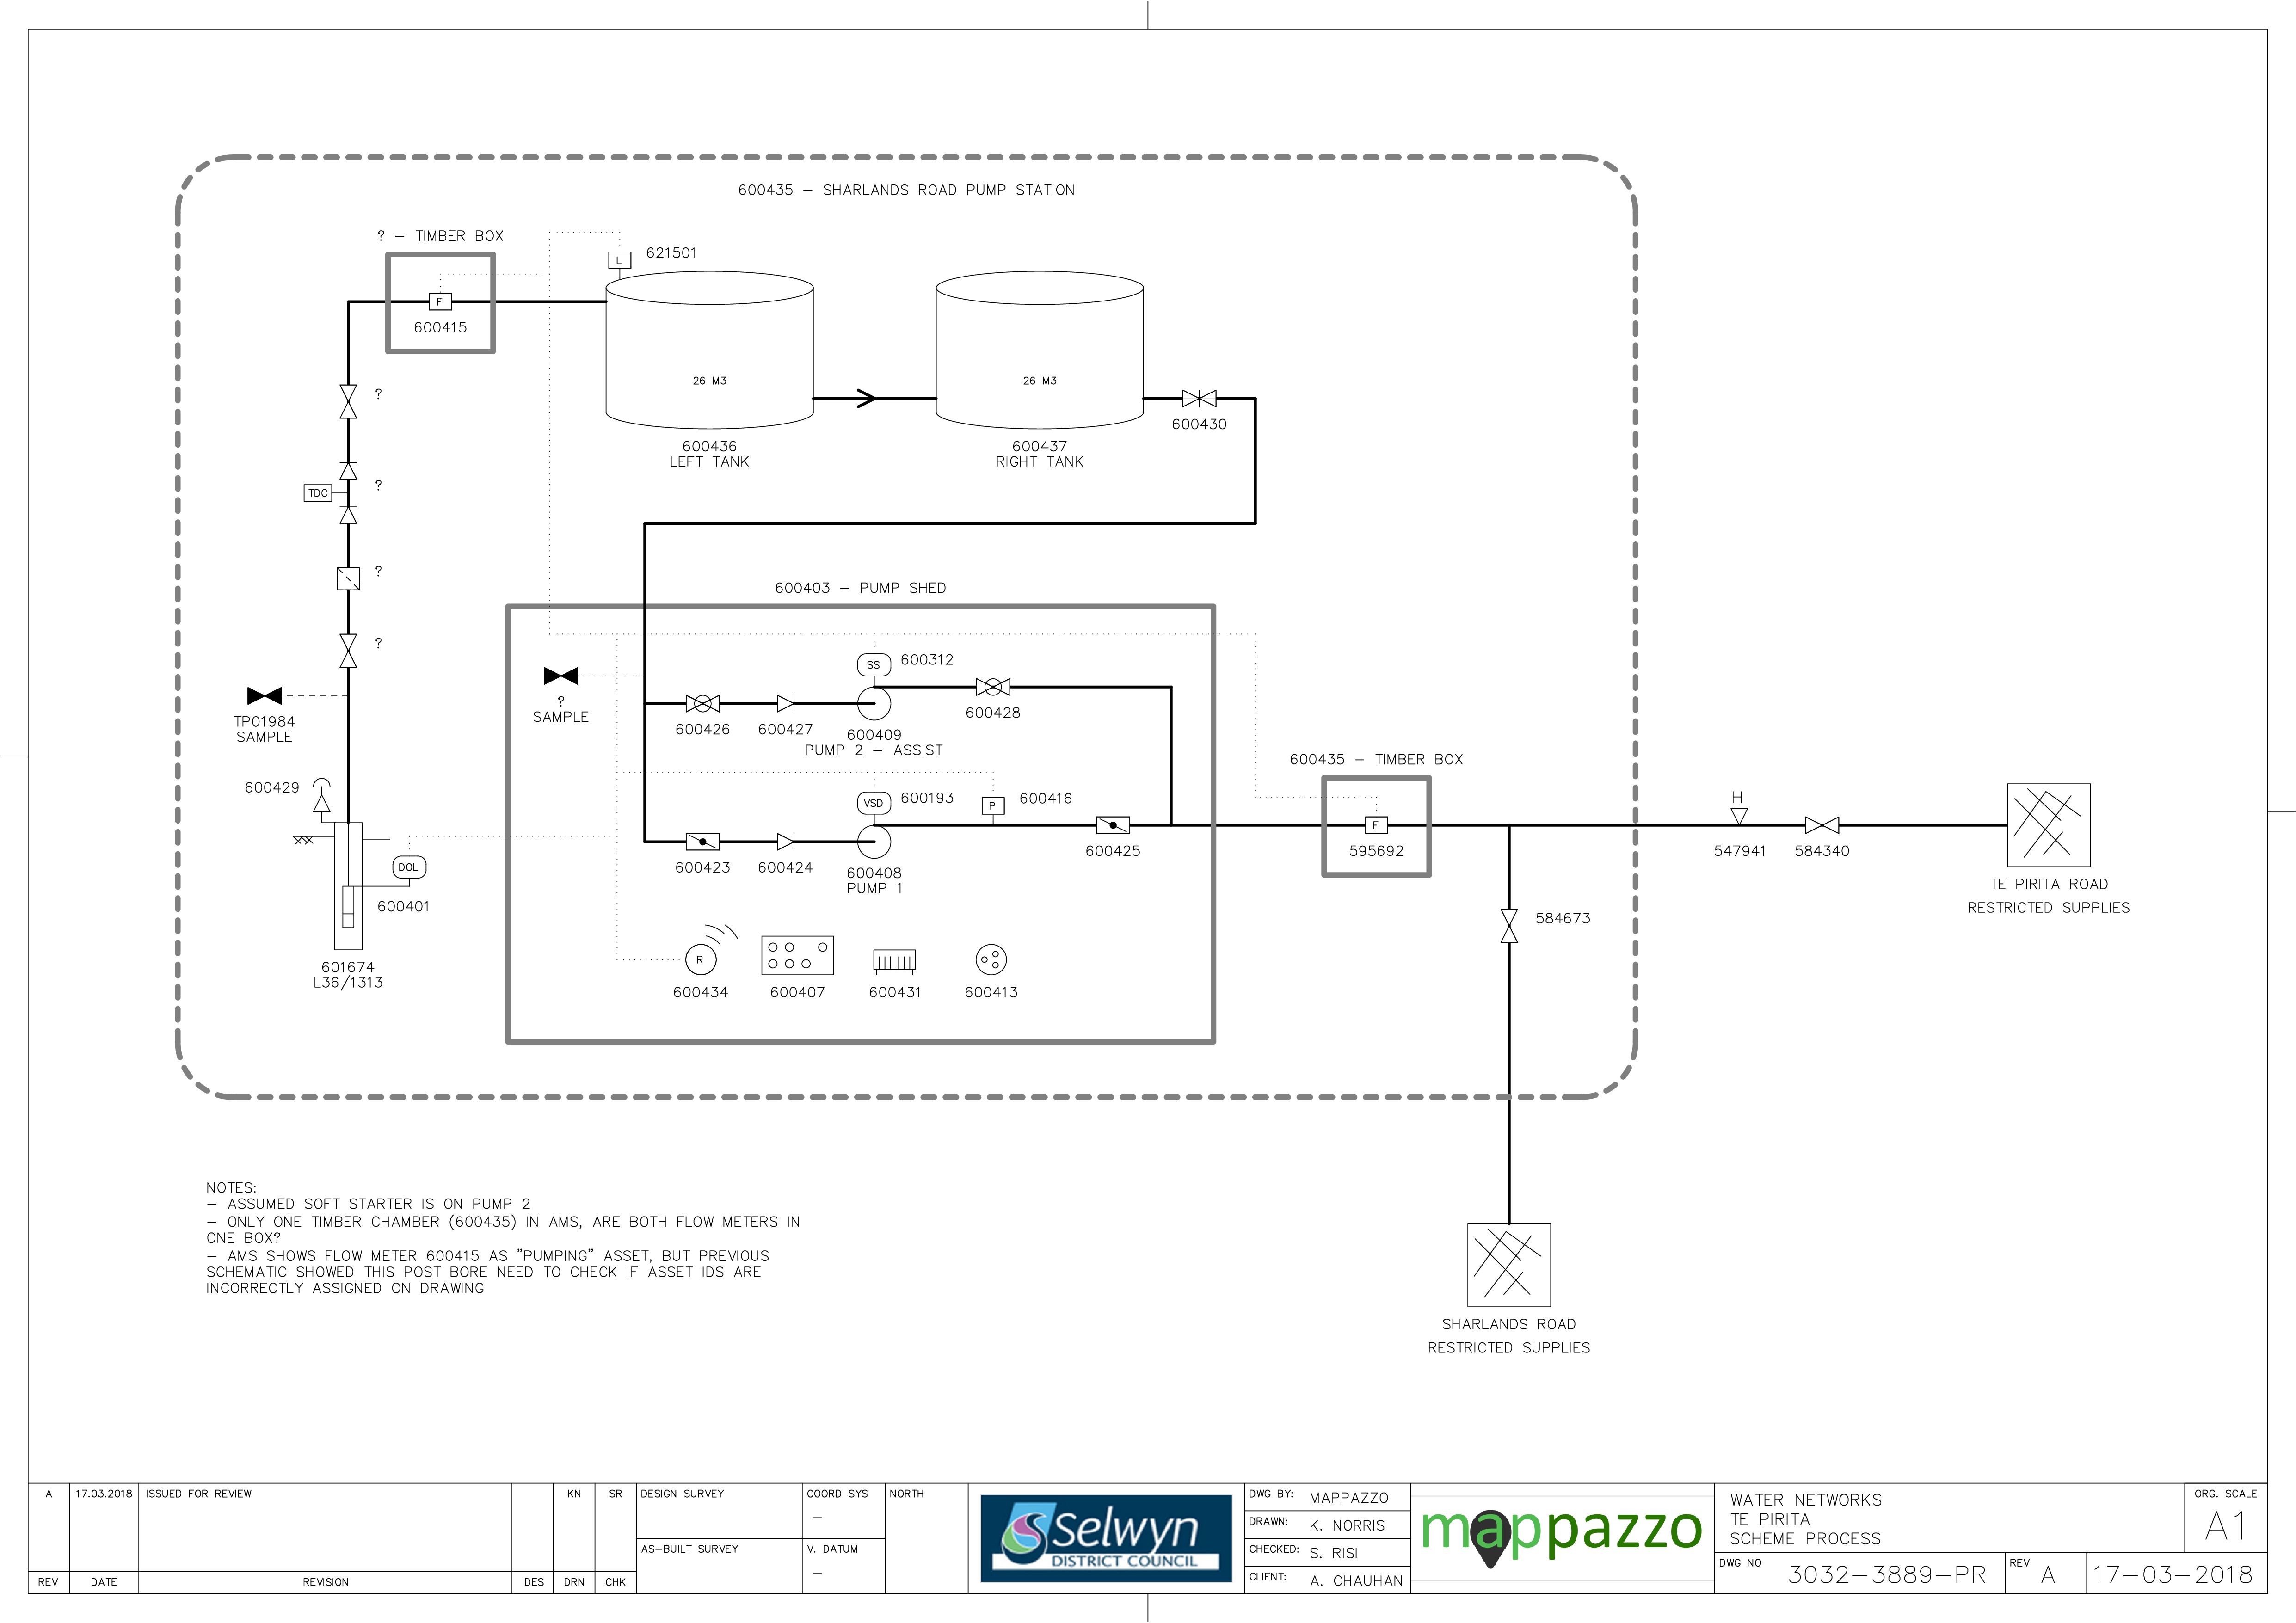
Figure 26‑2 Scheme Schematic
26.4 System Capacity
This rural water supply was developed to serve 10 rural properties, supplying water for domestic and agricultural use. All connections have been allocated and are utilised. No additional connections are allowed for. Demand has increased over recent years reflecting changing land use and additional farm dwellings, and will need to be managed within the constraints of the supply/consent.
Table 26‑2 Capacity Summary
| Abstraction Capacity | 6
| -
| -
| Limited by submersible bore pump capacity
|
| Consented Take | 10
| 450 | 67,500 | -
|
Treatment capacity
| 9.3
| -
| -
| Max flow at 90% UVT
|
Peak Demand
| - | 365*
| 67,936**
| Unrestricted tank supply |
* 2020 ** 2014
26.5 Resource Consents
Table 26‑3 shows the water take permitted by the resource consent for this scheme.
Table 26‑3 Resource Consents
CRC991530.1
| To take groundwater via bore L36/1313, at or about map reference NZMS 260 L36:2075-2981 for public water supply. | cnr Te Pirita & Sharland Roads, HORORATA | 12-Feb-10 | 9-Apr-34
| 10
| 450
|
26.6 Water Quality
The Te Pirita water supply is a secure source and is currently sampled quarterly at the treatment plant and reticulation zone.
The following details E. coli transgressions for the period 2012 to 2020.
Treatment
There has been no E. coli transgressions during this period.
Zone
There have been three E. coli transgressions during this period. These occurred in April 2015 and two occurred in May 2015.
Chemical Analysis
The following is a summary of the raw water chemical analysis carried out at the Te Pirita Water Supply.
Table 26‑4 Te Pirita Water Supply Raw Water Chemical Analysis Summary
| Total Lead (g/m3) | 0.01 (Maximum Acceptable Value)
| <0.0001
| <0.00011
| <0.00011
| 0.00041
| 0.00019 | <0.00011
| <0.00011
| 0.000388
| ✓
|
| pH (pH units) | 7-8.5 (Guideline Value)
| 7.5
| 7.4
| 7.6
| 7.8
| 7.7
| 7.7
| 7.7
| 7.8
| ✓ |
| Total Hardness (g/m3 as CaCO3) | <200 (Guideline Value)
| 49
| 56
| 52
| 54
| 47.0
| 54.5
| 57.4
| 57.2
| ✓
|
| Total Calcium (g/m3) | n/v | 16
| 19
| 17.5
| 18.1
| 16.0
| 18.3
| 19.31
| 19.36
| ✓
|
| Total Iron (g/m3) | <0.2 (Guideline Value)
| <0.02
| <0.021
| <0.021
| 0.083
| <0.021 | <0.021
| <0.021
| <0.021
| ✓
|
| Total Sodium (g/m3) | <200 (Guideline Value)
| 4.4
| 4.8
| 5.0
| 4.9
| 4.4 | 5.0
| 4.99
| 5.05
| ✓ |
Nitrate - Nitrogen (g/m3)
| 11.3 (Maximum Acceptable Value)
| 2.1
| 3.2
| 3.1
| 3.8
| 2.3
| 3.99
| 4.13
| 4.33
| ✓
|
26.7 Scheme Assets
A summary of material and diameter for pipes in Te Pirita is shown below in Figure 26‑3 and Figure 26‑4.
Figure 26‑3 Pipe Material – Te Pirita
Figure 26‑4 Pipe Diameter – Te Pirita
26.8 Operational Management
The water supply is operated and maintained under two maintenance contracts as follows:
- Contract 1241: Water Services Contract. Contract is with SICON who undertakes investigations, conditions inspections, proactive and reactive maintenance and minor asset renewals; and
- Contract 1202: Parks and Reserves Contract. Contract is with SICON who undertakes the maintenance of land scape features related to water services e.g. mowing, gardens etc.
Water quality sampling is completed under an agreement with Food and Health Ltd as required.
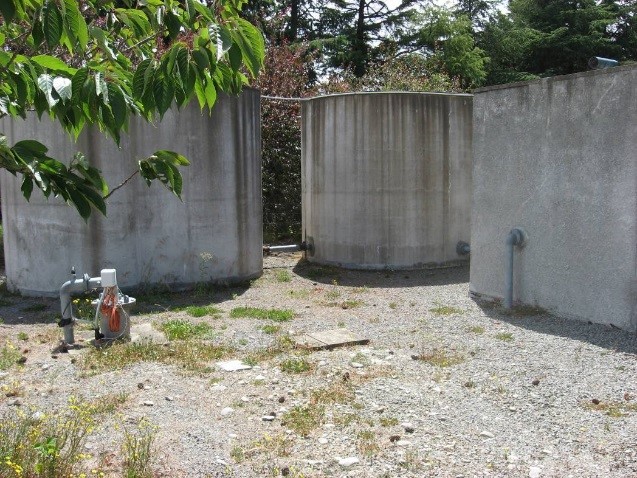
26.9 Photos of Main Assets
|
26.10 Risk Assessment
A risk assessment has been undertaken for the Te Pirita scheme. The key output from the risk assessment is the identification of any extreme and high risks which need to be mitigated. In order to mitigate these risks they have been included and budgeted for in the projects within this LTP. Table 26‑5 details the risk priority rating, Table 25‑6 outlines the risks and the list of key projects is found in Table 26‑11.
Table 26‑5 Risk Priority Rating
| > 50 | Extreme | Awareness of the event to be reported to Council. Urgent action to eliminate / mitigate / manage the risk. Document risk and action in the AMP. |
| 35-50 | Very High | Risk to be eliminated / mitigated / managed through normal business planning processes with responsibility assigned. |
| 14-35 | High | Manage risk using routine procedures. |
| 3.5-14 | Moderate | Monitor the risk. |
| < 3.5 | Low | Awareness of the event to be reported to Council. Immediate action required to eliminate / mitigate / manage the risk. Document risk and action in the AMP. |
Table 26‑6 Risks – Te Pirita
| Electrical failure due to lightning or network spikes | Install surge diverters | 2014 | 6 | 6 | 6 |
| Failure to meet NES water meter standards | NES Water Meter Compliance | 2014 | 20 | 6 | 6 |
| Inability to collect income from non-metered properties | Install property water meters | 2014 | 27 | 0.6 | 0.6 |
| Non-compliance with the DWSNZ | DWSNZ - Age Testing | 2014 | 6 | 0.7 | 0.7 |
| Non-compliance with the DWSNZ | DWSNZ - Bore-head security | 2014 | 6 | 6 | 6 |
| Non-consented activities | Renewal of consents | 2014 | 27 | 27 | 6 |
| Inadequate treatment under all conditions | UV treatment | 2017 | | 1 | 1 |
The list of district wide risks can be found in 5Waters Activity Management Plan: Volume 1.
26.11 Asset Valuation Details
The total replacement value of assets within the Te Pirita water scheme is $2,093,313 with further details in Table 26‑7 below.
Table 26‑7 Replacement Value, Te Pirita
|
Plant and Equipment | $290,842
|
Water Reticulation
| Hydrant | $2,310
|
| Lateral | $3,723
|
| Pipe | $1,774,292
|
| Supply Point | $19,850
|
| Valve | $2,296
|
26.12 Renewals
The renewal profile has been taken from the 2019 5 Waters Valuation. A graph showing the renewals for this scheme is shown by Figure 26‑5 below. The majority of renewals occur in 2025.
Figure 26‑5 Te Pirita Water Renewal Profile
26.13 Critical Assets
The criticality model for Te Pirita has been updated for the 2021 AcMP. The methodology of the criticality model can be found in 5Waters Activity Management Plan: Volume 1 and it provides details of how the criticality has been calculated for the reticulation assets. Table 26‑8 and Figure 26‑6 below shows the calculated criticality for all of the assets within this scheme that have a recorded known length.
Table 26‑8 Length of Assets per Criticality Level
5
| Low | 12,240
|
4
| Medium-Low | 10,579
|
3
| Medium | 0
|
2
| Medium-High | 0 |
1
| High | 0 |
26.14 Asset Condition
The asset condition model was run for Te Pirita in 2021. The methodology of the model can be found in 5Waters Activity Management Plan: Volume 1 which provides details of how the model has been calculated for the pipe reticulation assets. Figure 26‑7 below shows the level of asset condition for these assets within this scheme that have a recorded known condition.
Table 26‑9 provides a description of the condition rating used within the condition model.
Table 26‑9 Asset Condition Grading
| 1.0 | Excellent |
| 2.0 | Good |
| 3.0 | Moderate |
| 4.0 | Poor |
| 5.0+ | Fail |
The number of pipe faults is also measured through the asset management system. Figure 26‑8 shows the known historic pipe failures within this scheme.
26.15 Funding Program
The 10 year budgets are shown by Table 26-10. Budgets are split into expenditure, renewals, projects and capital projects. Expenditure and renewals have been reported on a district-wide basis in Volume 1.
All figures are ($) not adjusted for CPI “inflation". They are calculated on historical data, and population growth where relevant.
Table 26-10 Budget Summary
| 2021/2022 | $15,000
| $130,000
|
2022/2023
| -
| -
|
| 2023/2024 | -
| -
|
| 2024/2025 | -
| -
|
| 2025/2026 | -
| -
|
| 2026/2027 | -
| $400,000
|
| 2027/2028 | -
| - |
2028/2029
| -
| -
|
2029/2030
| -
| -
|
2031/2032
| -
| -
|
| Total | $15,000
| $530,000
|
An explanation of the categories within the budgets are as follows below:
-
Expenditure consists of operation and maintenance costs;
-
Renewals are replacement of assets which are nearing or exceeded their useful life;
-
Projects are investigations, decisions and planning activities which exclude capital works; and
-
Capital projects are activities involving physical works.
Table 26-11 Key Projects
Capital Projects
| -
| Spare pump
| $30,000
| -
| -
| -
| 100% LoS
|
Capital Projects
| -
| Extra source and storage
| -
| -
| -
| $400,000
| TBC
|
Capital Projects
| -
| Consent renewal
| $100,000
| -
| -
| -
| 100% LoS
|
Projects
| -
| Model connection to Hororata
| $15,000
| -
| -
| -
| 100% LoS
|
* Where LoS refers to Level of Service and G refers to Growth
The list of district wide projects can be found in 5Waters Activity Management Plan: Volume 1.
Discussion on Projects
Projects have been determined based on their:
- Relevance to the scheme
- Requirement to be completed under legislation
- Ability to bring the scheme up to or maintain the Level of Service required under council's Asset Management Policy.
Many projects are jointly funded by more than one scheme and activity. Each scheme pays a pro-rata share only, equivalent to the number of connections.
Discussion on Capital and Projects
Where relevant, Capital (Levels of Service) and Capital (Growth) projects have been included in the scheme financial details.
Levels of Service Projects and growth splits have been provided to ensure the costs of population driven works are clear.
<<
5-Waters Volume 2 - Water Supplies


