<<
5-Waters-Volume-3-Wastewater
6 Eastern Selwyn Sewerage Scheme
6.1 Scheme Summary
Estimated Population Served
| 39,895 population equivalents (PE)
|
Scheme Coverage
(1 Jan 2021) | Full Charges | Serves Lincoln, Rolleston, Prebbleton, Springston and West Melton. Burnham Military Camp will connect in 2021 (included in population estimate above). |
| System Components |
Piped (m) | 35,890
|
Manholes (No.)
| 55
|
Pump Stations (No.)
|
4 (Allendale Lane, Selwyn Road, Burnham School, Prebbleton Terminal) |
| Treatment | 45,000 PE with planned upgrades to 60,000PE |
| Disposal | Irrigated area 188.9ha, planned upgrades to 258.8ha |
History
| Original scheme installation date | 2012-2013 |
|
Value ($) |
Replacement Cost |
$66,919,041.49 |
|
Depreciated Replacement Cost |
$51,207,826.83 |
|
Financial | Operator cost (scheduled and reactive maintenance) per connection | $119.29/connection
|
Demand
(1 Jan - 31 Dec 2020)
| Annually (m3) | 2,628,239
|
Average daily (m3)
| 7,201
|
Peak daily (m3)
| 9,789
|
| Minimum daily (m3) | 5,139
|
|
Infiltration |
N/A, pressurised pipeline scheme |
|
Sustainability |
Ultimate discharge point |
Treated effluent discharged via land irrigation |
6.2 Key Issues
The following key issues are associated with the Eastern Selwyn Sewerage Scheme. A list of district wide issues are located in 5Waters Activity Management Plan: Volume 1.
Table 6‑1 Eastern Selwyn Sewerage Scheme Issues
Rapid growth will put pressure on the plant's capacity and conveyance capacity
| Put in place a program for progressive upgrade works |
| Plant capacity to buffer trade waste discharges | Manage trade waste discharge through trade waste consents |
6.3 Overview & History
The Eastern Selwyn Sewerage Scheme (ESSS) was developed to meet the existing and future needs of the towns of Prebbleton, Lincoln, Springston, Rolleston and West Melton. The purpose of this scheme is to ensure a staged and managed approach to the development of wastewater bulk conveyance, treatment and disposal infrastructure while providing equality in the scheme costs for existing residents, new developments and future generations.
The Pines I WWTP was designed as a modular plant so that additional treatment works can be added in stages to service future demand with an ultimate capacity (permitted by resource consent) of 22,000 population equivalents, with disposal to an 80 ha irrigation area. The original plant had a capacity of 6,000 population equivalents.
The Pines II WWTP was completed in March 2013. The plant now has a treatment capacity of nominally 30,000 PE, with the exception of some process units (e.g. inlet screen, grit traps and clarifiers) which have greater capacities. A staged upgrade approach (Pines III, IV and V) was selected to incrementally increase capacity to the WWTP and allow deferment of capital expenditure and Pines III was completed in October 2019.
The treated effluent disposal capacity has been progressively upgraded since completion of the Pines II WWTP. The installation of the Western pivot area has increased the average daily (m3) flow disposal rate to 123 L/s (accounting for stand down areas), which is equivalent to 42,500PE. The proposal is for future expansion to keep pace with population growth.
Due to the unprecedented growth rates experienced within the Selwyn District, flow and loads to the WWTP have increased at a much faster rate than predicted. A study for the treatment process requirements to treat a population in excess of 60,000 PE has been undertaken. This study has indicated that the future WWTP configuration should include primary sedimentation and anaerobic digestion, amongst other process upgrades within the current plant.
The WWTP is controlled by a SCADA system with a central PLC controlling the plant functions except for the nominated equipment packages which have individual controllers (inlet works, blowers, UV disinfection, dewatering centrifuges, and solar drying).
The structures of the existing plant were used to form the first stage of the solids treatment stream, converted into aerated sludge digester and gravity thickener prior to transferring of the digested sludge through to the centrifuges. This made use of the existing blowers for the aeration system and used the configuration of the tank to provide the dual purposes of sludge aeration and gravity thickening.
There is significant investment required in the establishment of the redevelopment of the Pines WWTP. Each element within the plant has been considered on basis of design for the expected life of the structures and to meet the criteria of the resource consents obtained. The design life for the civil works is in excess of 50 years and this has been taken into consideration when defining the scope of the design. Also, any future staging at the site is not to compromise the operation of the WWTP, which means that space is to be allowed whether within structures for future mechanical plant, within major pipelines for future flows, or adjacent to facilities for future civil construction.
Also incorporated into the design was process resilience without compromising the capital investment in the plant. The major process elements (inlet/bioreactors/clarifiers/UV) were established with a dual stream process to allow for one bank to be out of operation while still maintaining, at least, ADWF treatment.
The WWTP consists of the following components:
- Liquids Stream
- Inlet Works:
- Inlet screening
- Grit removal
- Activated sludge bioreactors with biological nitrogen removal (4 stage Bardenpho)
- Clarifiers
- UV Disinfection
- Irrigation of treated wastewater onto dedicated land
- Solids Treatment and Handling:
- Gravity thickening
- Aerobic digestion
- Dewatering
- Solar drying
A diagram of the plant layout is provided below in Figure 6.1.
The treatment process consistently reduces nitrogen to levels at and below 7mg/L.
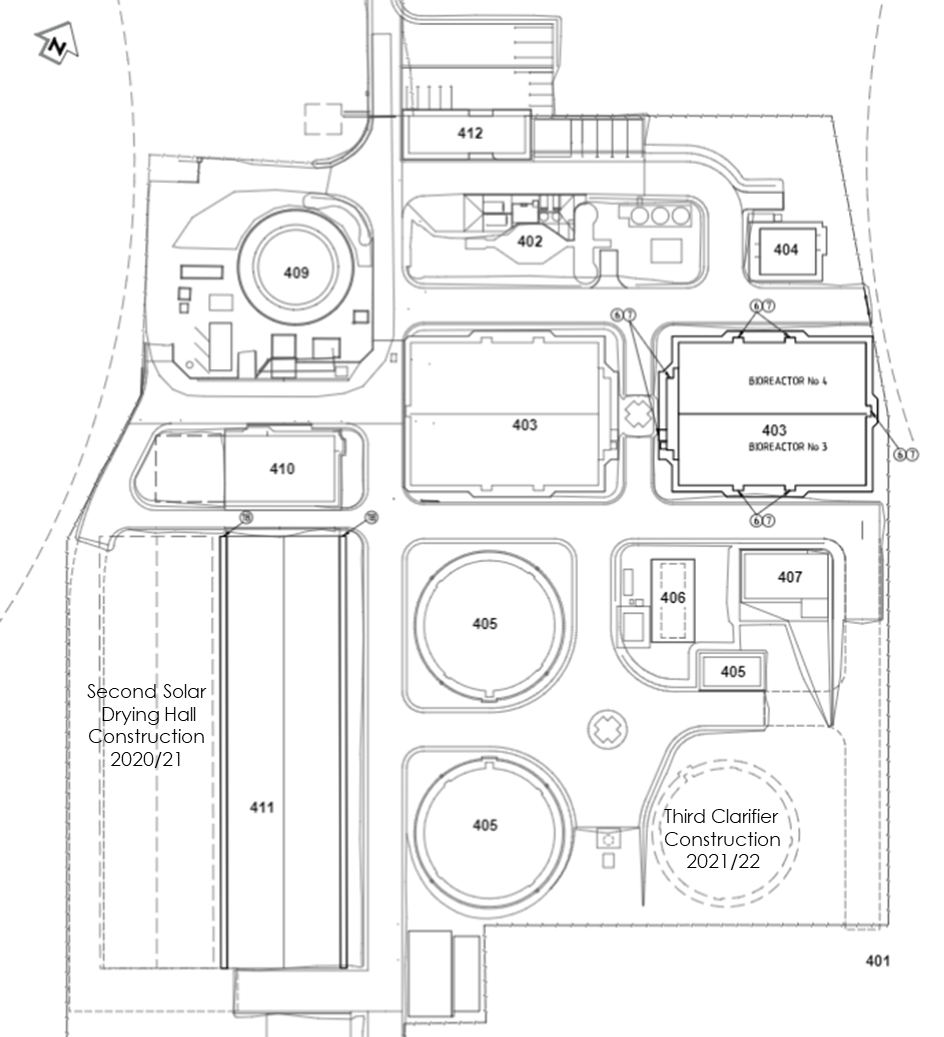
Figure 6‑1 Staging at Pines WWTP
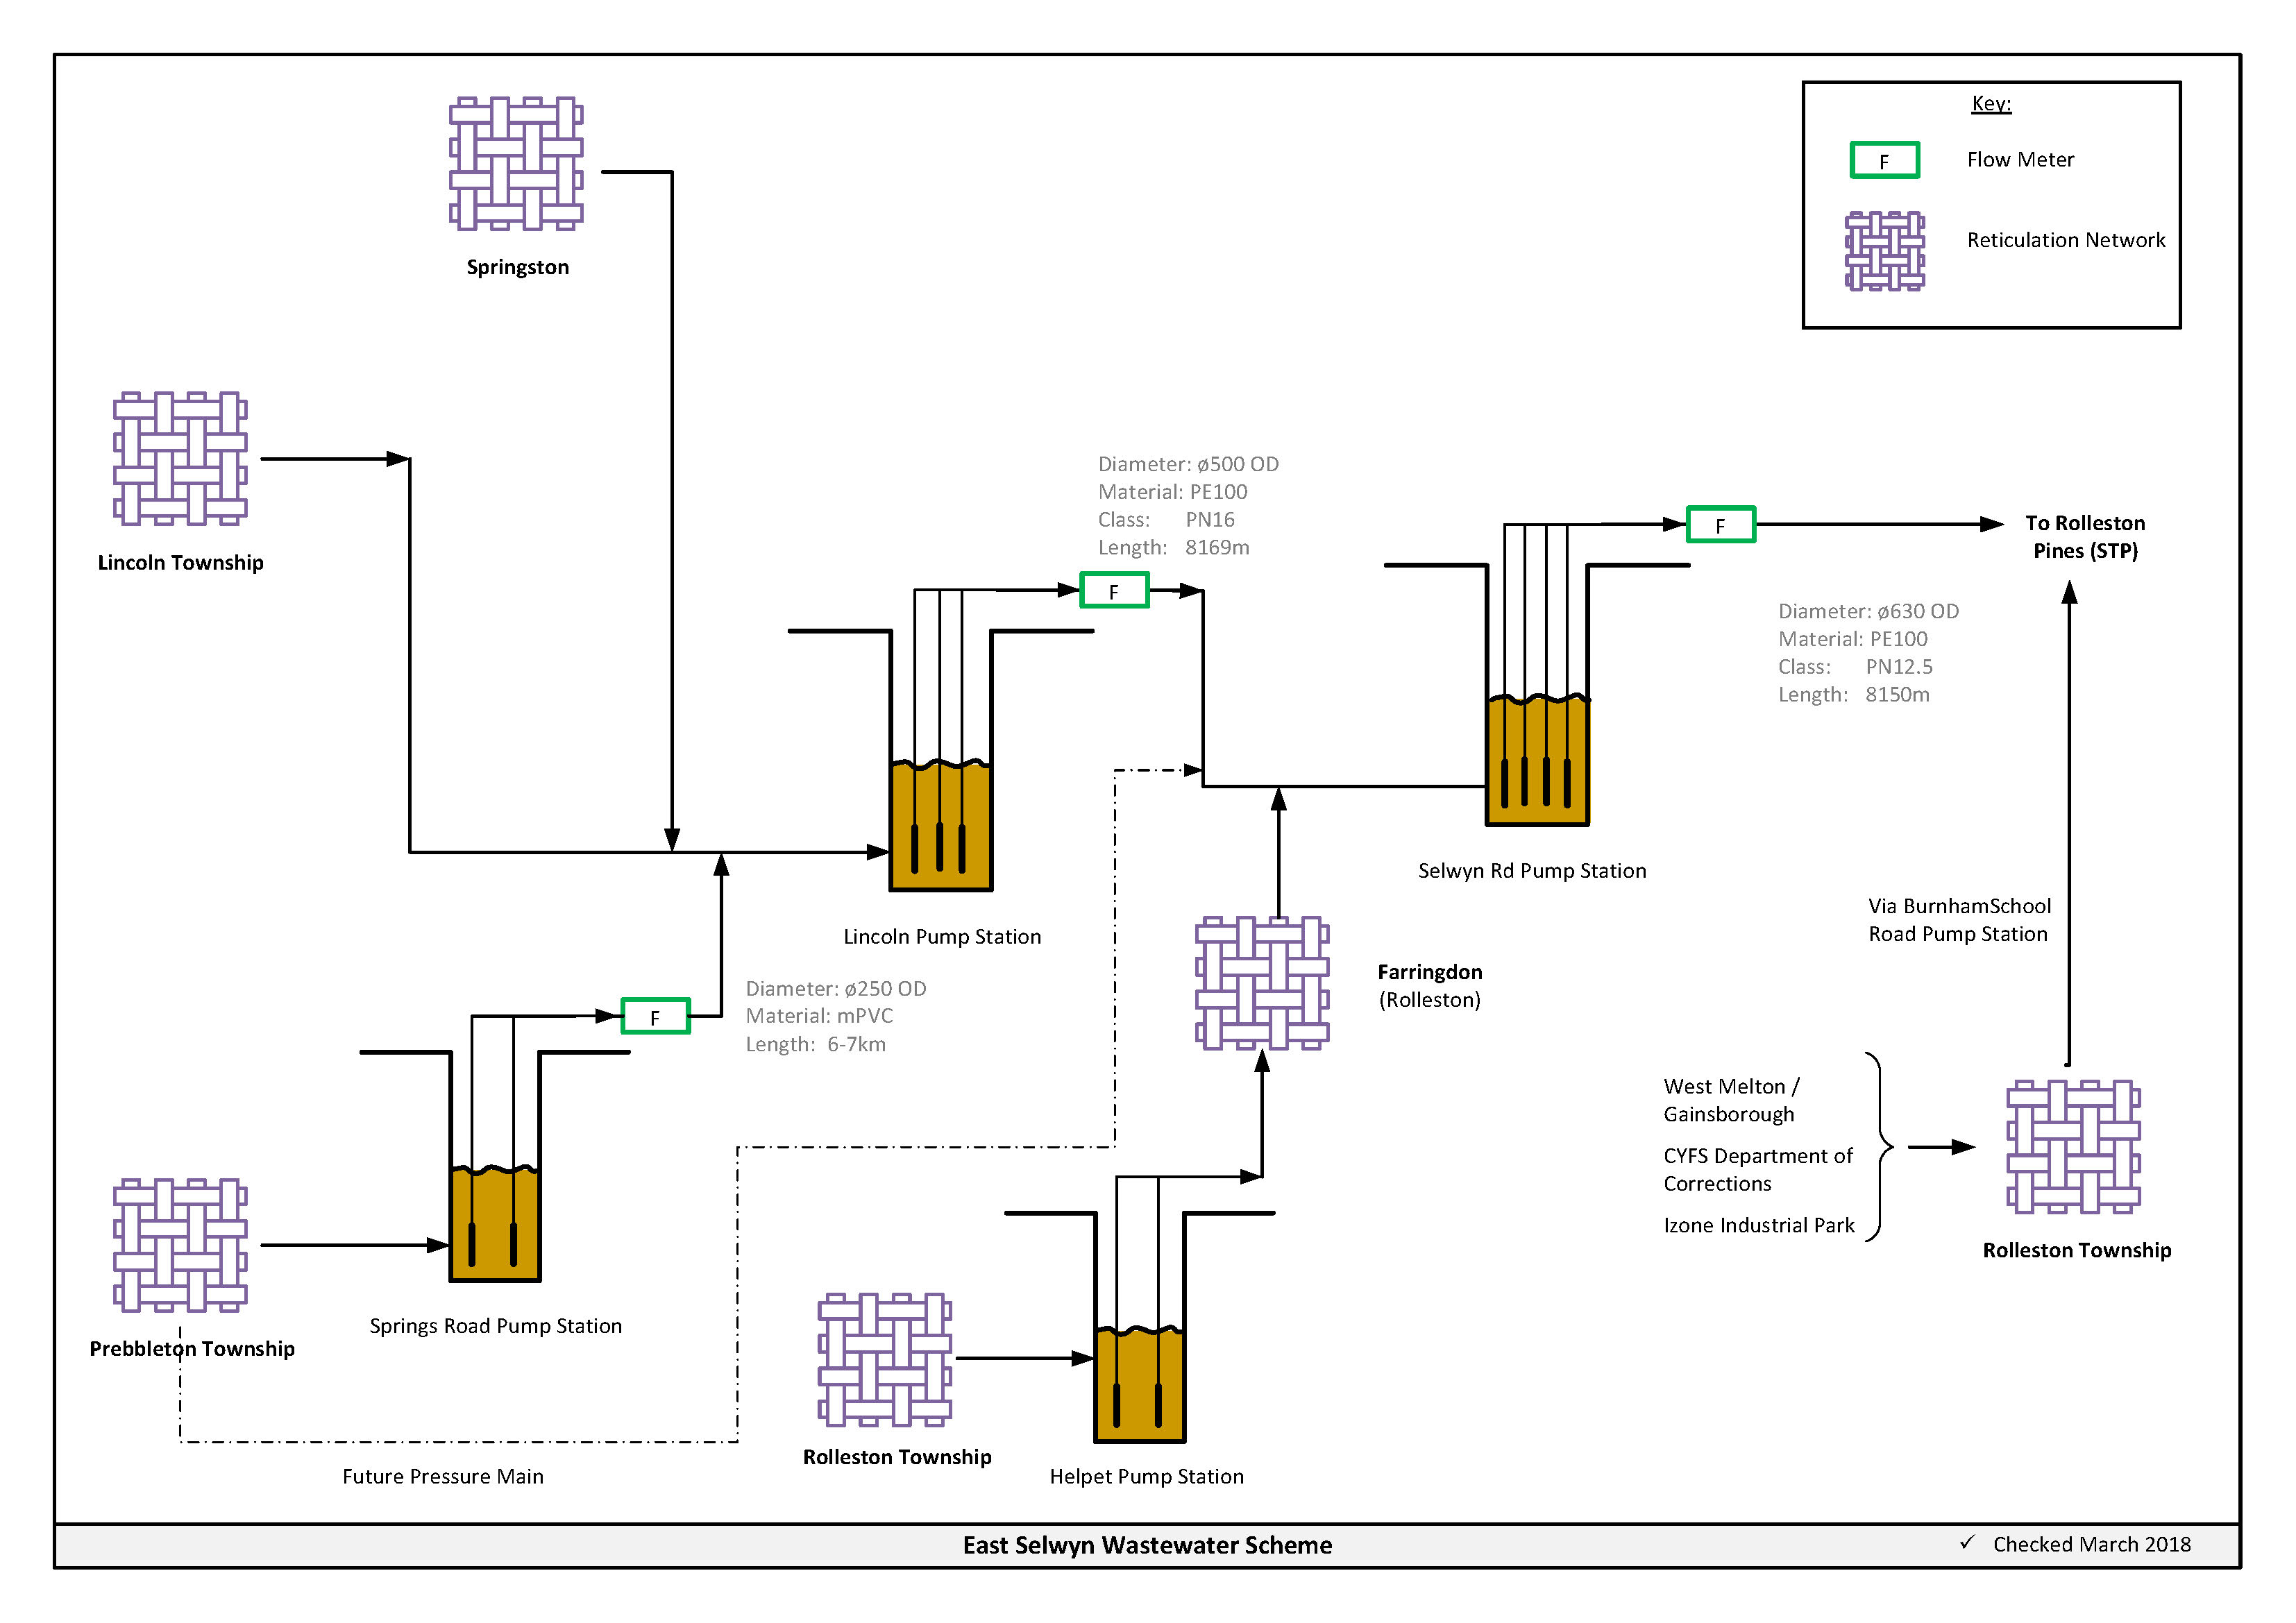

Figure 6‑3 Scheme Schematic - Network
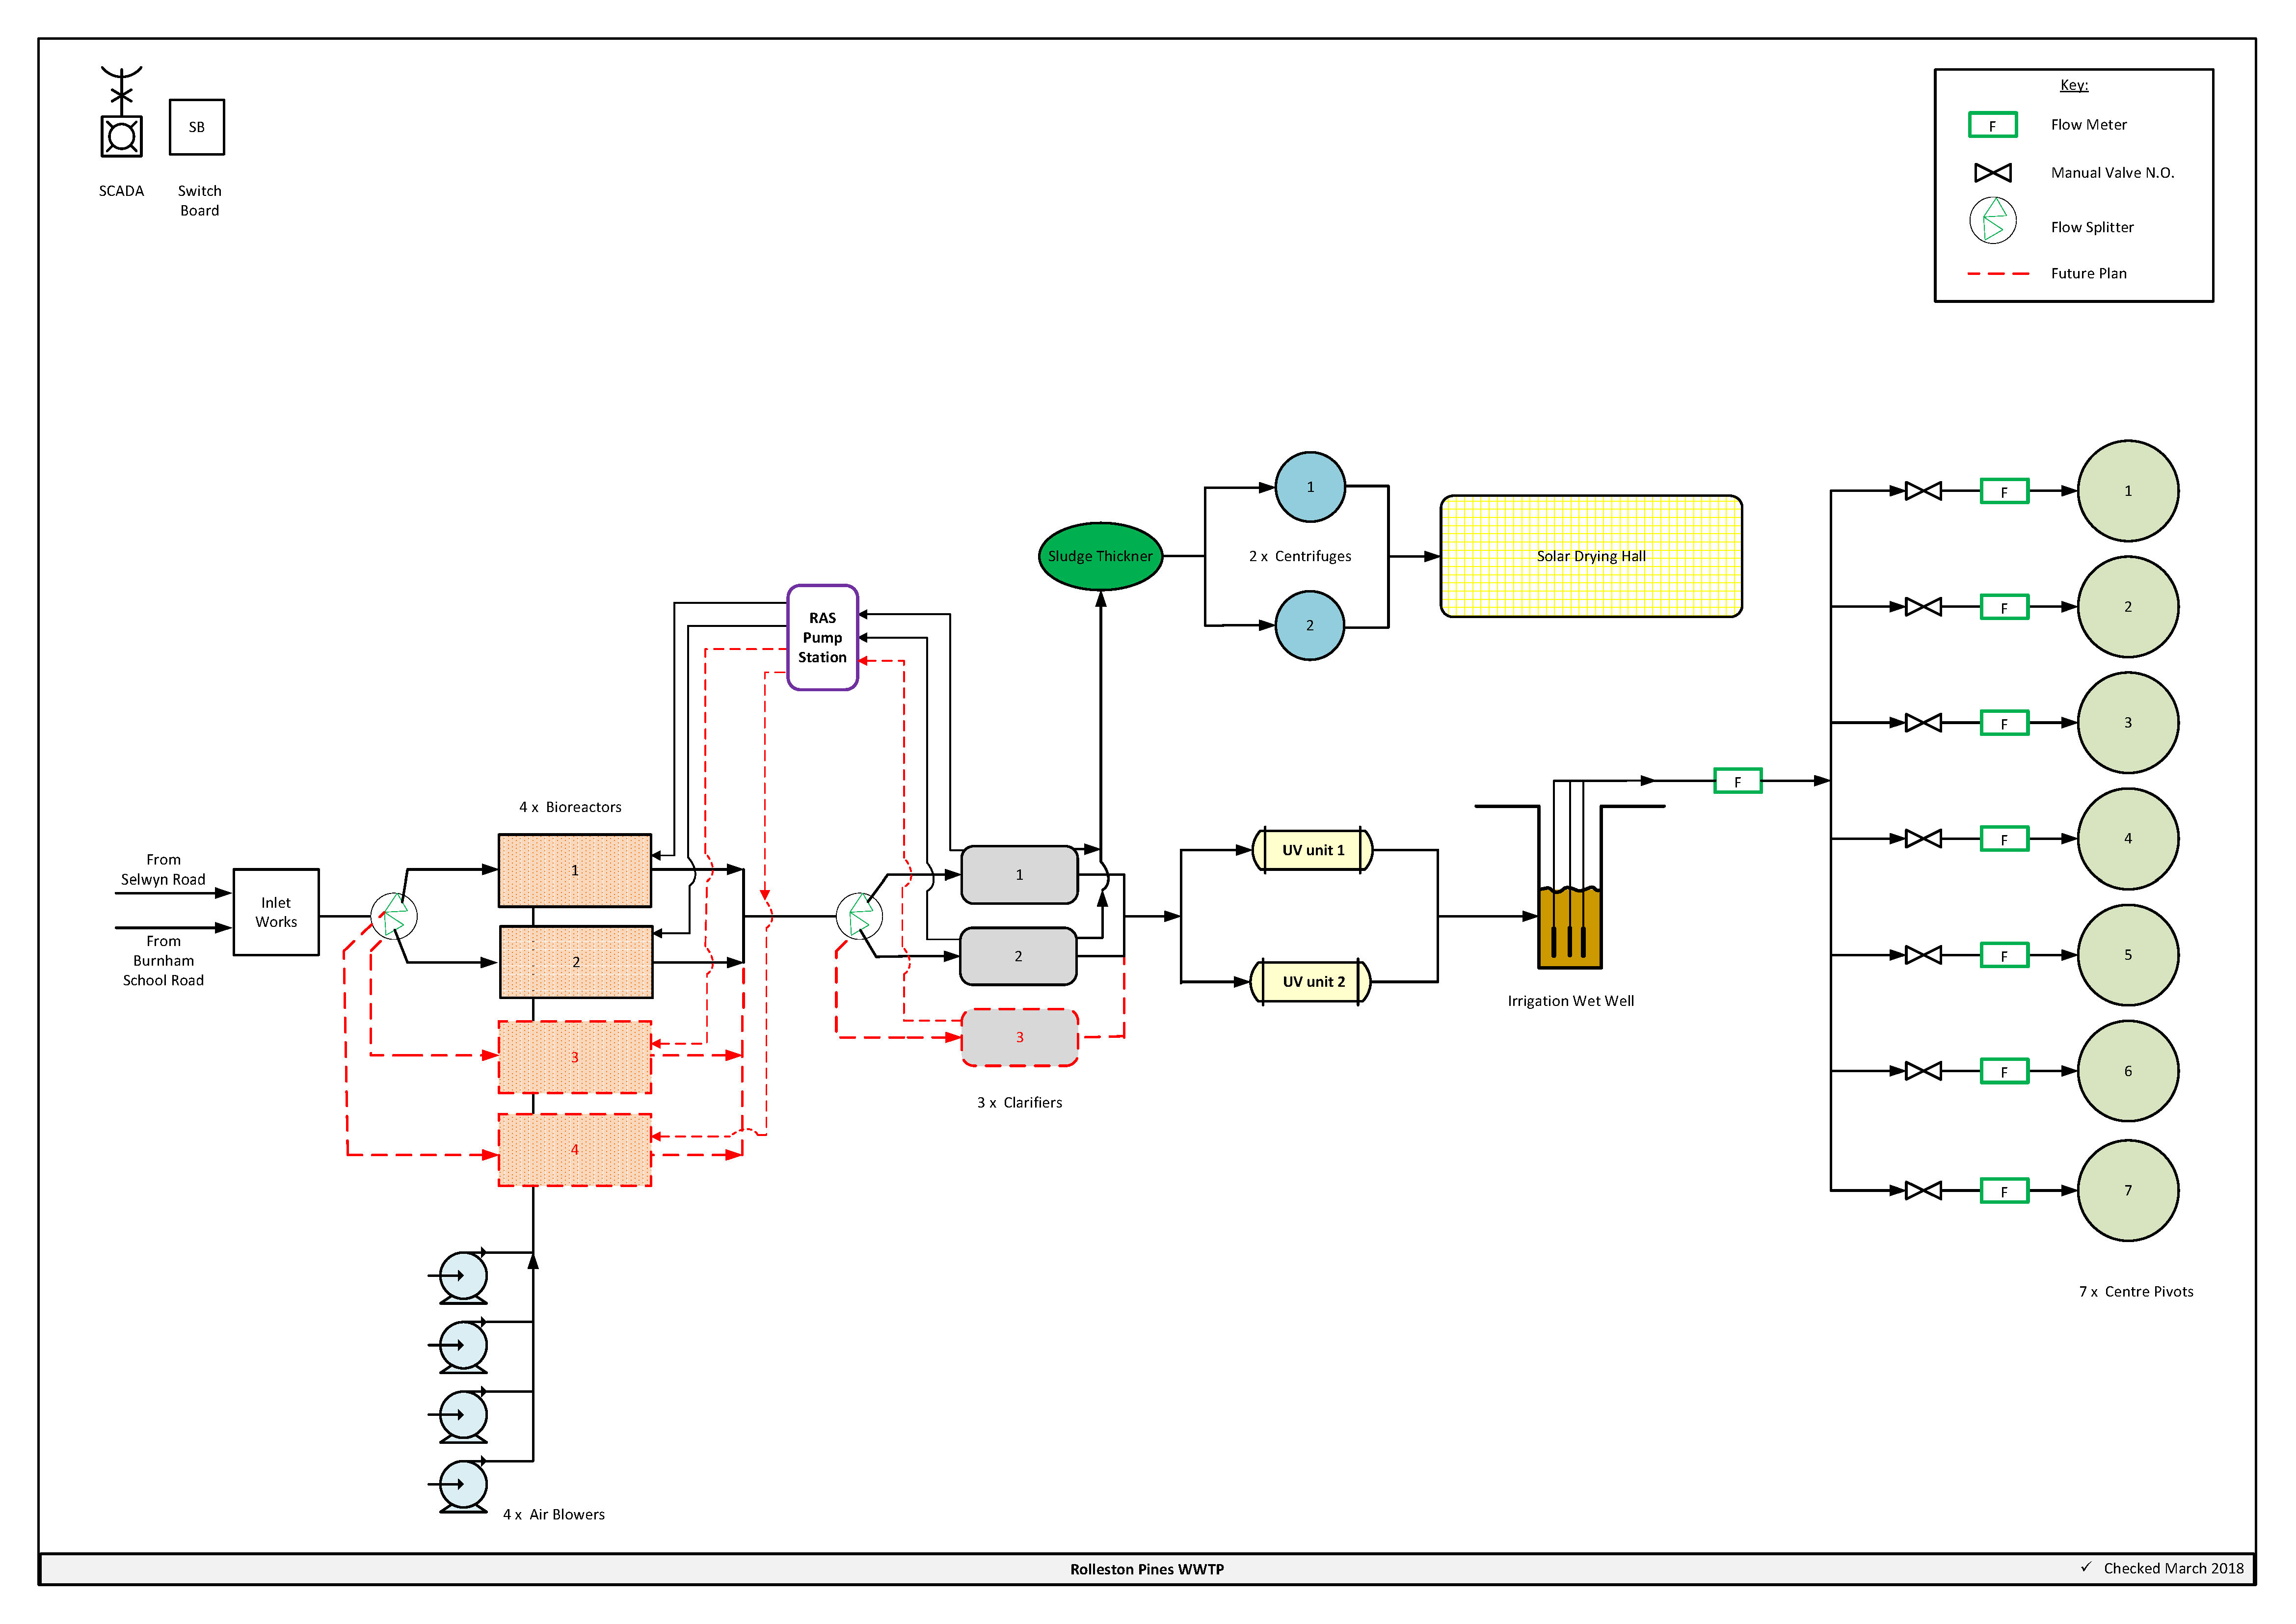
Figure 6‑4 Scheme Schematic - Treatment
6.4 System Capacity
The fundamental criterion for the scheme was the ability to dispose of wastewater from a rapidly growing population. There was no spare capacity under the existing discharge agreements with CCC to meet the growth predictions for either Prebbleton or Lincoln. Options to increase the allocation were formally discussed with CCC staff throughout the options development stage and through to completion of the consenting of the irrigation block at the Pines WWTP. Limitations within the downstream network and the timing of future upgrades meant the discharge volumes could not be increased and therefore SDC needed to provide an alternative solution.
Discharge of treated wastewater via waterways was not considered viable due the water quality requirements and the cultural sensitivity of the ultimate receiving environment (Lake Ellesmere / Te Waihora). Therefore, two viable solutions were considered, Land Disposal and Ocean Outfall Disposal.
6.4.1 Projected populations
The projected populations for each of the communities need to be defined to assess the capacity required of the ESSS infrastructure and the timing of any staged development. Where the development of the infrastructure within the individual communities cannot be staged due to the commitments stated under the Land Use Recovery Plan (LURP), the balance of the ESSS (the Pines WWTP and bulk conveyance) can be staged in accordance with the projected growth rates. Population projections have been determined by SDC.
The growth projections for catchments within the ESSS have been revised regularly since 2010/11. Figure 6-5 shows the total population equivalent (residential, commercial and industrial) that will be serviced by the Pines WWTP. Generally, growth within catchments is expected to be linear, but step changes in the actual flow and load reeived to the Pines WWTP will occur when currently unconnected catchments are connected to Pines WWTP. These currently unconnected catchments could include Burnham Military Camp, Darfield and Kirwee and the Ellesmere Sewerage Scheme. The latest population modelling (PwC, January 2021) predicts that by 2050 the Pines WWTP could be servicing a population equivalent in excess of 100,000.
This is significantly higher than the 70,000 PE that had been previously modelled (without connection of the additional community catchments) and requires consideration of the proposed upgrade strategy for the ESSS.
Table 6-2 presents the upgrade strategy for the Pines WWTP to take it through to 120,000 population equivalents.
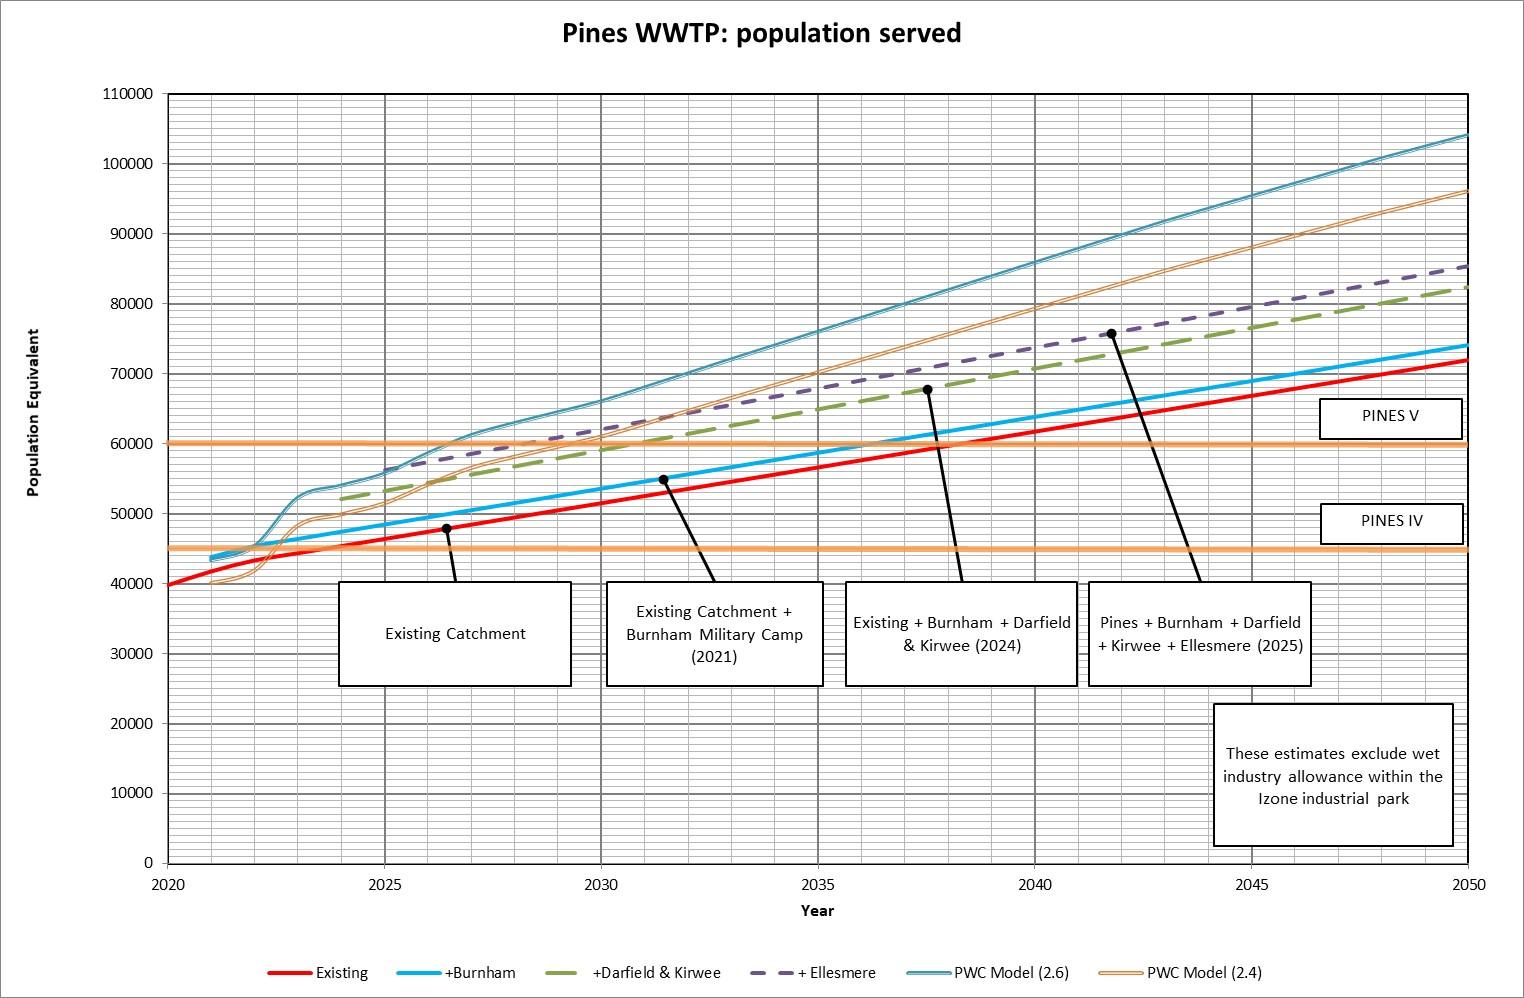
Figure 6-5 Predicted population served by Pines WWTP
6.4.2 Growth Master Plan
A masterplan has been developed for the treatment plant to see what it would take to expand the ultimate treatment capacity to 120,000 PE. Indicative plant layouts are shown in Appendix F.
Two options were considered for “Pines 120" (i.e. upgrading Pines WWTP to serve 120,000 PE), as summarised in Table 6-2.
- Option 1 Fully aerobic system (similar to current plant)
- Option 2 Primary treatment + anaerobic digestion
Table 6-2 Options considered for the future of Pines WWTP (Pines 120)
| Capital Cost | $38.3M | $33.4M |
Operations
| Higher operational cost. More aeration (blowers, diffusers) required. Ongoing MBR replacement costs. Ongoing MBR power requirements. | Lower operational cost. Opportunities for income from resource recovery. Anaerobic digestion produces methane and power / heat for reuse within the WWTP. Improved sludge digestion and removal. Reduced exposure to fluctuations in the cost of power. |
| Sludge | Sludge quantities increasing proportionally to existing status quo (ignores improvements through proposed new thickener). | Anaerobic digestion reduces the amount of sludge generated and requiring disposal. |
| Effluent quality | Lower solids in treated wastewater due to membrane separation. | Solids quality meets existing treatment requirements.
|
Aerobic (option 1) has less up-front cost (up to 80,000 PE), but is more expensive in the long run. Council staff recommend proceeding with Option 2 (anaerobic), as this is less costly in the long term and creates a number of opportunities for resource recovery.
The figures below provide a current view of the Pines WWPT and an indication of what the plant may look like in the future.
Financial modelling is underway by PricewaterhouseCoopers to confirm the overall scheme cost to existing ratepayers and developers, for each of these options. The Development contributions required are detailed in the Development Contribution Policy Document.
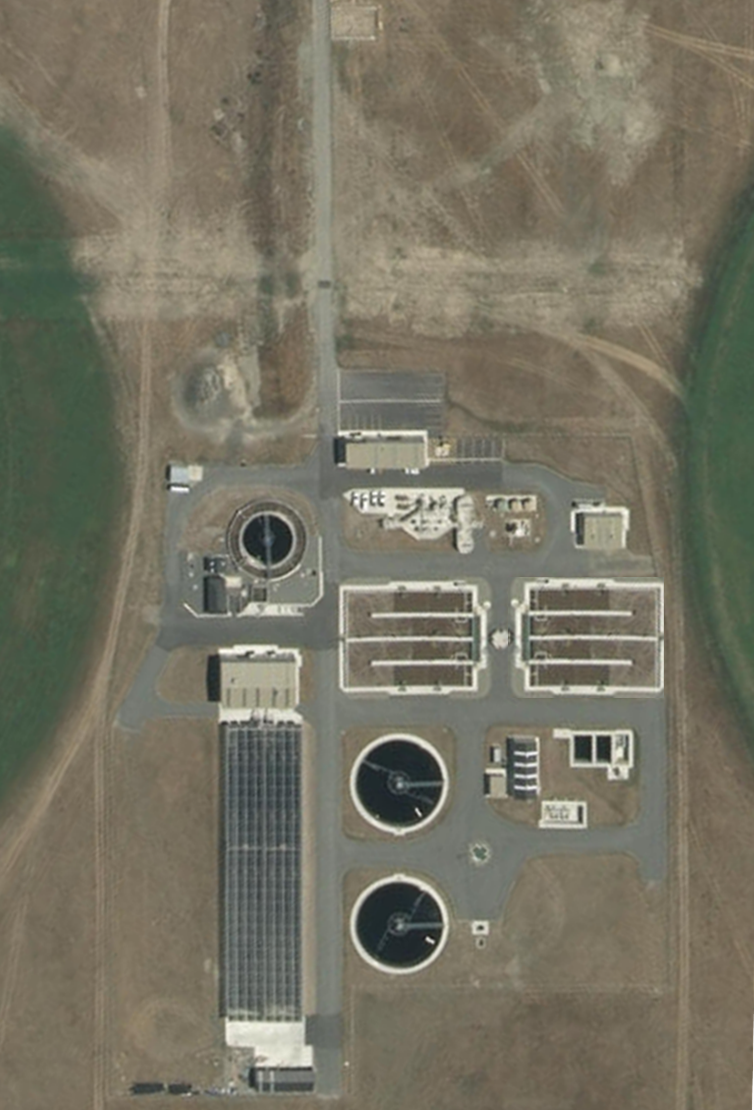
Figure 6-6 Pines 60 (Existing Layout)
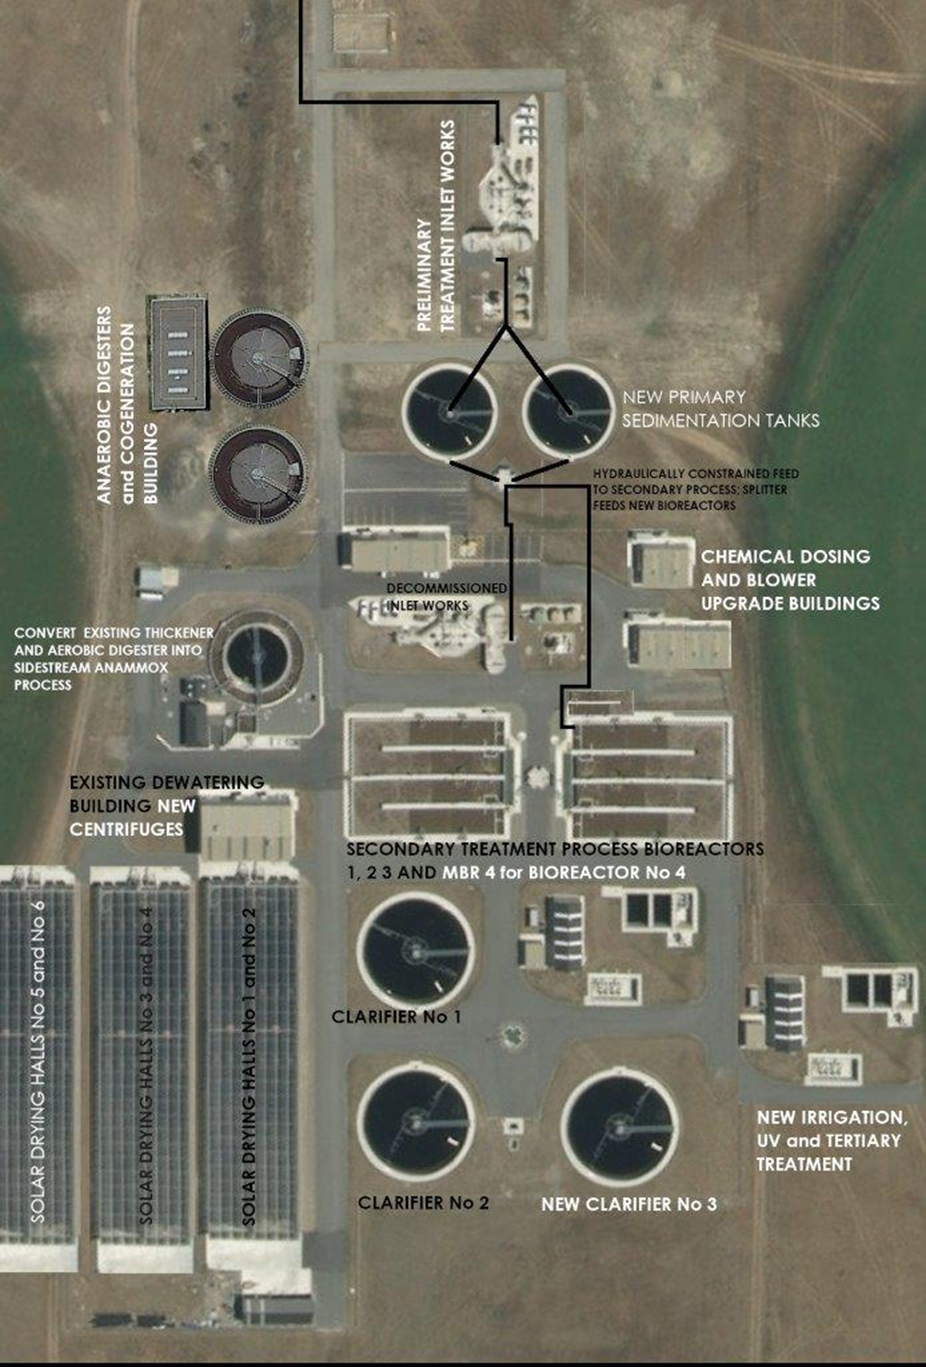
Figure 6-7 Pines 120 (Addition of Primary Treatment: Primary Sediment Tank - PST)
Table 6-3 presents the upgrade strategy for the Pines WWTP to take it through to 120,000 population equivalents.
Table 6-3 Cost estimate, by Process Unit
Screens
| | $490,000
| | $10,070,000
| | $2,520,000
|
|
2x PST
|
| | | | $6,060,000
| $6,060,000
| |
Primary PS
|
|
|
|
| $620,000
|
|
|
Mechanical Thickener
|
|
| |
| | $2,250,000
|
|
Bio 4 - Mechanical
| | | | $780,000
| $680,000
| |
|
Clarifier
| | $3,530,000
|
| | | | |
RAS Pumps
|
| $290,000
| | | | | |
Bio 4 (membranes)
|
| | | | | | $4,580,000
|
Carbon + Alkalinity
| | | | | $450,000
| | |
Deammonification Tank
|
| | | | $450,000
| | |
Cogeneration Plant
|
| | | |
| $9,710,000
| |
UV Disinfection
|
| | | | | $1,900,000
| |
Irrigation PS pumps
| | | $150,000
| | | | |
Field Irrigators
|
| | $320,000
| | | | |
Mechanical Thickener
| | $1,060,000
| | | | | $2,110,000
|
Convertible Aerobic Digester
| | | $4,680,000
| | | $4,670,000
|
|
Conversion to Anaerobic
|
| | | | | $1,350,000
| |
Centrifuge
| | | | $880,000
| | | $820,000
|
Solar Drying Hall Capacity Upgrade
| $6,697,000
|
| | $2,700,000
| |
| $8,140,000
|
TOTAL
|
$6,697,000
|
$5,370,000
|
$5,150,000
|
$14,430,000
|
$8,260,000
|
$28,460,000
|
$15,650,000
|
The development of the Izone Business Park has brought an increased diversity to the district in the type of wastewater generated. Such operators as currently known have been incorporated in this assessment. However, should any trade waste user be added to the scheme or any current connection wish to increase their discharge (by volume or contaminant load), then the staging of treatment and wastewater conveyance will need to be reassessed.
Council will have to decide whether the additional trade waste flows can be accommodated within the tolerances of the population projections or, in the event that the projected loads are far in excess of normal residential loading rates, what restrictions may need to be applied. Large, untreated trade waste flows may have a significant effect on the staging of components within the ESSS scheme.
There are a number of steps that can be undertaken to improve the treatment process and/or reduce operational costs:
- Reduce peak influent flows – managing incoming peak flows
- Blower control – control blowers based on influent loading (s::can probe) values;
- DO setpoints – reduce the DO setpoints to reduce airflow requirements and improve transfer efficiency;
- A-recycle ratios – reduce pumping power requirements,
- RAS recycle ratios – reduce pumping power requirements and thereby improve performance of anaerobic selector.
6.5 Resource Consents
The ESSS has multiple resource consents. Table 6‑4 shows the discharge permitted by the resource consents for this scheme.
Table 6-4 Resource Consents
CRC040100.1
Issued - Active | To discharge contaminants to air from the treatment of raw sewage and sludges. | Burnham School Road, ROLLESTON
| 21-Dec-10 | 15-Dec-38 | N/A (discharge to air consent)
|
CRC210644
Issued - Active | To discharge contaminants to land | Burnham School Road, ROLLESTON | 23-Oct-20
| 20-Dec-38 | 7,760 m3/day
Monthly average hydraulic loading rate ≤ 8mm/day
|
CRC101111
Issued - Active | To store contaminants. | Burnham School Road, Main South Road & Brookside Road, ROLLESTON | 21-Dec-10 | 17-Dec-45 | N/A
|
CRC060964 Issued - Active
| To discharge domestic sewage tank effluent into ground | Burnham School Road, ROLLESTON | 28-Sep-05 | None
| 2m3/day from an individual property
|
CRC153952
Issued - Active | To discharge contaminants to land and to air | Burnham School Road, Main South Road & Brookside Road, Rolleston | 6-Mar-15 | 17-Dec-45 | Combined with CRC210644, not more than 25,614 m3/day
|
6.6 Scheme Assets
6.6.1 Reticulation Overview
A summary of material and diameter for pipes is shown in Figure 6‑8 and Figure 6‑9.
Figure 6‑8 Pipe Material – Eastern Selwyn Sewerage Scheme
Figure 6‑9 Pipe Diameter – Eastern Selwyn Sewerage Scheme
6.6.2 Treatment and Disposal
6.6.2.1 Liquid Stream
The liquid stream treatment consists of three 4-stage, activated sludge, biological nutrient removal (BNR) reactors with anaerobic selectors. Wastewater enters the inlet works and passes through screening and grit removal before entering into the BNR anaerobic selector and mixing with the return activated sludge (RAS) from the clarifiers. The mixed liquor then moves into the primary anoxic zones where recycled nitrate is converted into nitrogen gas and released from the process (denitrification). The activated sludge is then aerated: organics are broken down by the microorganisms in the biomass and converted into additional biomass, carbon dioxide and water; ammonia is converted into nitrates (nitrification). A second denitrification step then removes more nitrogen before the activated sludge is re-aerated and sent to clarification.
The activated sludge biomass from both bioreactors is combined before being sent to two clarifiers.
Mixed liquor enters in the centre of the clarifiers and solids are allowed to settle to the bottom of the clarifier while a slowly rotating scraper moves settled solids to the centre pump-well where they are returned as RAS to the front of the BNR reactors. The clarified and treated wastewater overflows into clarifier launders where it is then collected and passed through an ultra-violet (UV) treatment reactor for disinfection. The disinfected treated wastewater is then stored in the irrigation wet well before being sprayed by pivot irrigators onto the irrigation fields.
Inlet Works
The influent wastewater is pumped via community based pumping stations into a reception chamber and it then flows into screening channels. Two screening channels operate in duty/assist. A third channel exists for installation of a future screen. An emergency bypass channel with a high level overflow entry weir and manually raked bar screen is available if there is a complete failure of the inlet screens. The screens are automatically cleaned and the screenings washed and compacted, and then stored in a covered screenings skip/bin.
Screened wastewater then flows to one of two vortex grit chambers. The grit is settled in the grit hopper at the bottom of the chamber and periodically pumped out and delivered to the grit classifier for washing and dewatering. Dewatered grit is stored in a covered grit skip/bin.
Secondary Treatment
The screened and degritted wastewater from the inlet works, under normal operation, is evenly split between three activated sludge bioreactors which operate in parallel. The flow splitter includes overflow weirs and connections for the future third and fourth bioreactors. The bioreactors comprise anoxic and aerobic zones and provide BOD and nitrogen removal.
The mixed liquor from the bioreactors flows to the clarifiers where the suspended solids are separated and pumped back to the inlet of the bioreactors. Surface scum is automatically removed from the surface of the clarifiers. Clarified water overflows the vee-notch weir and gravitates to the Ultra Violet (UV) disinfection system and irrigation pump station.
Tertiary Treatment
The UV disinfection plant reduces pathogens via inactivation by UV light. The treated wastewater then flows into the irrigation pump station and is pumped to centre pivot irrigators for disposal to land. Irrigation areas are provided below in hectares.
Table 6-5 Irrigation Areas at Pines WWTP
12.19 ha
| 12.19 ha
| 12.67 ha
| 12.57 ha
| 15.62 ha
| 15.62 ha
| 116.76 ha
|
6.6.2.2 Solids Stream
To control the biomass inventory of the BNR process it is necessary to remove the surplus activated sludge generated by the biological processes. Waste Activated Sludge (WAS) pumps send a fraction of the biomass through to the gravity thickener where the solids are thickened.
In the thickener, solids settle to the bottom and are intermittently pumped to the digester. Supernatant from the thickener is then collected and pumped back to the inlet works for further treatment via the supernatant pump station.
The digester is broken down into four-stages that have alternating unaerated/aerated cycles. Volatile solids are further broken down as they pass through the digester.
The centrifuge receives the digested sludge, and dewaters it further with the liquid centrate being recycled back to the inlet works for further treatment.
The dewatered solids are taken via conveyor to the solar drying halls where automated sludge managers shift and till the sludge around the hall allowing it to dry out within the glass -house environs.
A large portion of the operating cost of the original Pines WWTP was the handling and disposal of sludge. The waste sludge was carted off from the site and disposed of. The intention of the solids stream is to substantially reduce the volume of material that is required to be taken from the site. Part of this process is the thickening of the sludge through the sludge digester and dewatering via the centrifuges. An addition to these elements is a solar air drying hall into which the sludge at approximately 14 to 18% dry solids is placed and then turned over slowly by an automated process.
Sludge Stabilisation
Waste Activated Sludge (WAS) is removed from the bioreactors to maintain a target Solids Retention Time (SRT) of 10 to 15 days in the bioreactors. WAS is pumped from the bioreactors into a Gravity Thickener (GT) where solids settle to between 1.0 and 1.5% Dry Solids (DS). The thickened WAS (TWAS) is periodically pumped from the bottom of the GT into the inlet of the Aerobic Digester (AD). Supernatant from the GT flows over the vee-notch weir and then by gravity to the supernatant pump station, which returns the supernatant to the inlet works for treatment.
The TWAS is stabilised in the AD over 8 to 10 days. The AD provides volatile solids destruction and nitrogen removal. Alternating aeration and mixing is used to provide aerobic and anoxic conditions for nitrogen reduction.
Solids Dewatering
The digested TWAS is transferred to the centrifuge feed tank. The centrifuge feed pumps draws from the feed tank into one of two centrifuges, where the digested TWAS (biosolids) is dewatered to a target of between 18 and 20% DS. Centrate from this process is collected and pumped to the inlet works for treatment.
Solids Drying
Dewatered biosolids is transferred to the solar drying halls via screw conveyors. Once in the drying halls, the dewatered biosolids is automatically turned and transported along the length of the structure. The two solar halls operate in parallel and further stabilise and dry the biosolids as it moves through the hall. Dried biosolids is manually loaded into trucks for disposal off site.
The drying hall makes the best use of the natural climate in Canterbury to increase the moisture removal rate, provide a residence time for the removal of pathogens, and minimise the volume to be removed from site. A 70% dry solids content is targeted as an output of this process, providing a significant decrease in the volumes of biosolids to be removed from site. The surrounding land has been consented for the disposal of biosolids that meet heavy metal and Class Aa requirements. Testing will prove whether the pathogen and metal content of the biosolids can achieve this standard. If so, further savings will be made with disposal on adjacent pasture land.
6.6.3 Design
The civil and mechanical infrastructure for the ESSS was designed to international and New Zealand engineering design guidelines/standards. Design for the civil structures at the Pines WWTP and for the Allendale Lane and Selwyn Road Pump Stations was underway at the time of the February 2011 Canterbury Earthquake. The structural designs were revised prior to issuing of tender documentation to be compliant with the new engineering code of practice for seismic design in the Canterbury area.
The civil and mechanical plant items, including the irrigation disposal areas, have been built or planned to the built to meet the design flows and loads in Table 6‑6, to meet the treated wastewater quality parameters as consented and as summarised in Table 6‑7.
Table 6‑6 Design Flows and Loads for Pines WWTP
| Design Population | PE | 30,000 | 45,000 | 60,000 |
|
Flow: |
| ADWF | m3/d | 7,150 | 10,830 | 14,580 |
| PDWF | L/s | 175 | 265 | 355 |
| MDF | m3/d | 17,160 | 25,990 | 34,990 |
| PIF | L/s | 250 | 375 | 510 |
| Design (Incl. Recycles) | L/s | 350 | 450 | 610 |
| Pipe Flushing Flow | L/s | 310 | 310 | 310 |
|
Load: |
| COD | kg/d | 3,940 | 5,100 | 7,796 |
| BOD | kg/d | 1,970 | 2,550 | 3,898 |
| TSS | kg/d | 2,120 | 2,750 | 4,204 |
| TKN | kg/d | 390 | 510 | 780 |
Table 6‑7 Treated Wastewater Quality Parameters for Pines WWTP
| Biochemical Oxygen Demand (BOD) | 15 | 60 |
| Suspended Solids | 20 | 90 |
| Total Nitrogen | 7 | 35 |
| Faecal Coliforms (cfu/100ml) | 500 | 1,000 |
*All values are expressed in grams per cubic meter, except faecal coliforms which are expressed colony forming units per 100 milliliters.
These can be compared to the original design flows and loads for Pines II of
- Average Dry Weather Flow (ADWF) 10,830 m³/d;
- TSS load 2,750 kg/d; and
- COD load 5,100 kg/d.
Both TSS and COD are measured by spectrolyser located at the inlet works (shown in Figure 6-10), it should be noted that this does include loadings from recycle streams and this is discussed later. The nitrogen load to the plant is not currently measured.
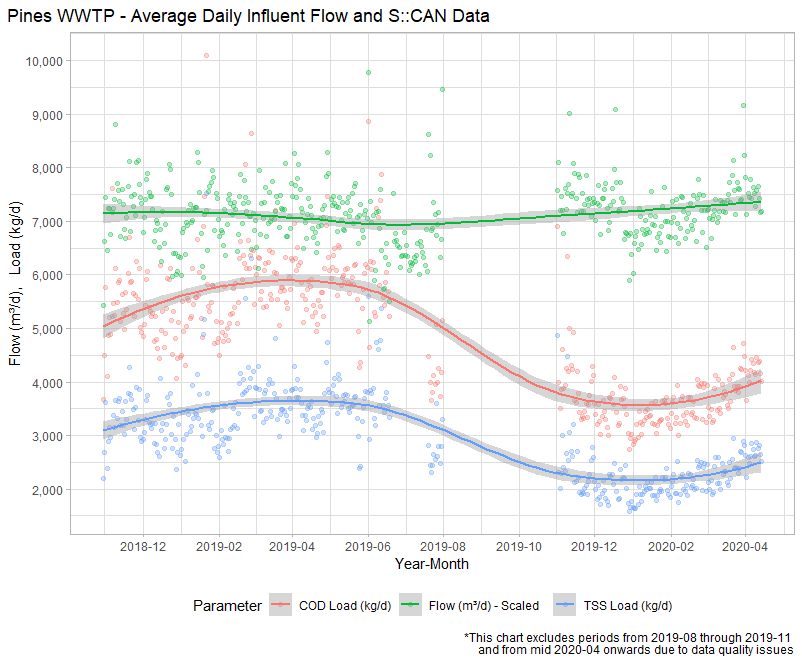
Figure 6-10 Pines WWTP Influent Flow and Load
Population equivalent (PE) loading of these historical flows and loads has been assessed through use of standard per capita loading rates. Figure 6‑11 shows the equivalent population serviced by the WWTP. There appears to be a seasonal trend to this which increases at the start of spring and is likely related to the operation of the Westland dairy factory and their discharge to the WWTP.
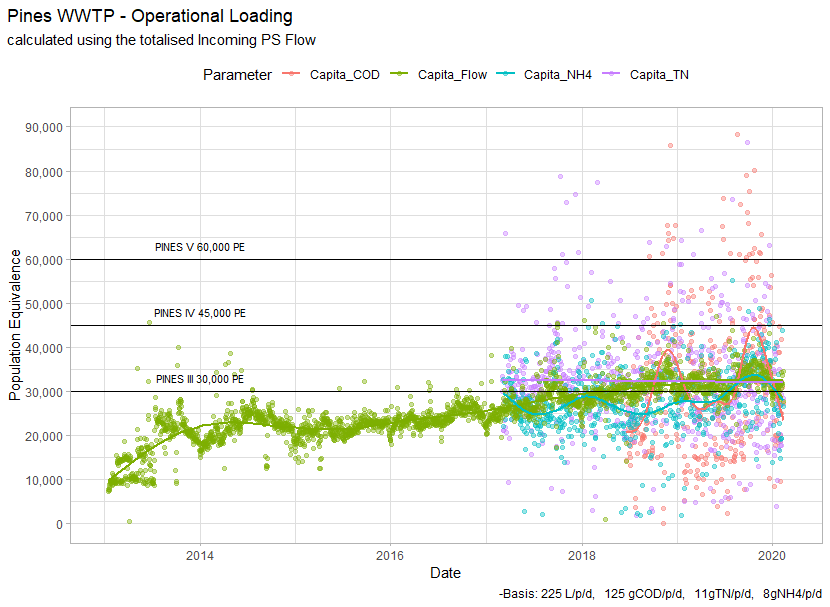
Figure 6‑11 Pines WWTP – Population Equivalents Serviced
The ESSS pump stations (at Allendale Lane, Selwyn Road, Burnham School Road and Prebbleton Terminal) have been designed to allow incremental increase in design flows to meet the growth of the communities. The projected design flows of the ESSS pump stations are outlined in Table 6‑8.
Table 6‑8 Design Flows for ESSS Pump Stations
| Prebbleton to Selwyn Road | 84
| 84
|
Allendale Lane to Selwyn Road
| 213
| 107
|
| Selwyn Road to Pines WWTP | 474
| 368
|
6.6.4 Pump Stations
Each of the pump stations within the ESSS has been designed to meet the incoming flows and the expected quality of influent. This means that the infrastructure has been designed with the possibility of septic sewage within the conveyance mains and material selected for construction accordingly. At each of the main pump stations sites odour treatment units with positive air displacement have been installed.
Allendale Lane Pump Station
Allendale Lane PS has an existing pump capacity of 165 L/s. The design capacity of the pump station is defined by the maximum day average flow rates where the peak flows are stored within the basins on site.
Allendale Lane PS's pump capacity of 165 L/s is expected to meet the incoming flows from the Lincoln community to beyond 2060.
Possible upgrades to provide further pumping capacity include additional pumps, replacement higher duty pumps, additional storage and/or changes to the operational regime in order to provide attenuation and reduce the reliance on peak pumping capacity equalling or exceeding peak inflow.
The DN500 HDPE pipeline has an ultimate capacity of 200l/s. This is not expected to be exceeded before 2060. If the design philosophy is altered to pump peak flows then the capacity of the pipeline would be expected to be exceeded before 2049/50.
Selwyn Road Pump Station
Selwyn Road pump station has an existing pump capacity of 335l/s. According to growth projections this is expected to be exceeded before 2041.
Possible upgrades at that time will include additional pumps, replacement higher duty pumps, additional storage and changes to the operating philosophy.
The DN630 HDPE pipeline has an ultimate capacity of 445l/s. This is expected to be exceeded before 2060.
Possible upgrades thereafter include additional pipeline capacity, additional pump station storage, and changes to the operating philosophy.
Pump stations where the standby / assist pump is predicted to start have been highlighted in yellow and red for those that experience a peak wet weather response.
Yellow Pumps are can convey the peak flow without backing up the system
Red Pumps are unable to convey the peak flow causing the system to back up
Table 6‑9 Pump Station Overview
ESSS (S) Allendale Ln PS
|
8000 x 5000 |
3 |
Grundfos S2.100.200.1600.4.70.H.C.430 GND |
165 |
150 |
23.7 |
173.0 | 223.4
|
|
ESSS (S) Burnham School Rd PS |
3500 x 3000 |
3 |
Flygt 3202 180 HT450 |
93 |
94 |
6.1 |
13.1 |
13.1 |
|
ESSS (S) Selwyn Rd PS |
9000 x 7000 |
4 |
Grundfos S2.110.200.1600.4.70.M.C.441.GND |
240 |
244 |
48.3 |
217.7 |
253.5 |
Table 6‑10 Pump Station Storage Time Analysis
| ESSS (S) Allendale Ln PS | 0.9 | 1.0 | 610420 |
| ESSS (S) Burnham School Rd PS | 6.7 | 8.2 | 547609 |
| ESSS (S) Selwyn Rd PS | 1.4 | 1.5 | 621237 |
*This does not include offline, installed catchment storage such as the Helpet and Lincoln pond emergency storage basins
6.6.5 Rising Mains
Table 6‑11 Rising Main Overview
ESSS (S)
Allendale Ln PS | Lincoln | 8,166 | 1,062.0 | 23.7 | 12.4 | 0.0 | 12.4 | 555 | 500 |
ESSS (S)
Burnham School Rd PS
| Rolleston | 2,896 | 183.3 | 6.1
| 3.5 | 0.0 | 3.5 | 340 | 130 - 240 |
ESSS (S)
Selwyn Rd PS
| Rolleston
| 7,696
| 1,735.0
| 48.3
| 10..0
| 0.0
| 10.0
| 395
| 335 - 360
|
ESSS (S)
Prebbleton
| Prebbleton
|
|
|
|
|
|
|
|
|
6.7 Operational Management
The wastewater schemes are operated and maintained under contract 1241 with SICON, who undertakes investigations, conditions inspections, proactive and reactive maintenance and minor asset renewals.
Wastewater sampling is completed under an agreement with Food and Health Ltd as required.
6.8 Photos of Main Assets
.png)
Photo 1: Pines WWTP (Rolleston)
|
.png)
Photo 2: Allendale Lane PS (Lincoln)
|

Photo 3: Selwyn Road PS (Rolleston)
| 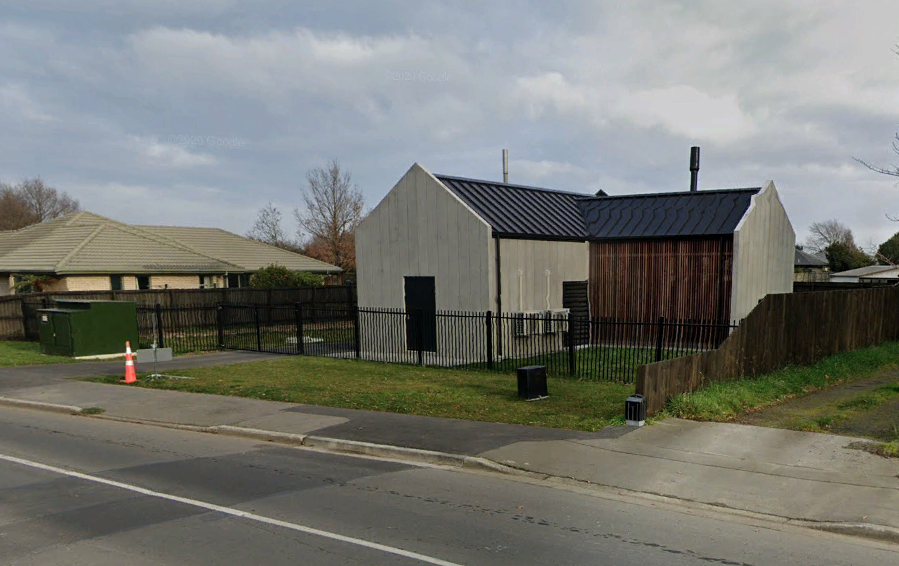
Photo 4: Prebbleton Terminal PS (Prebbleton) |
Video 1: ESSS Treatment Plant
6.9 Risk Assessment
A risk assessment has been undertaken for the ESSS. The key output from the risk assessment is the identification of any extreme and high risks which need to be mitigated. In order to mitigate these risks they have been included and budgeted for in the projects within this LTP. Table 6‑12 details the risk priority rating, Table 6‑13 outlines the risks and the list of key projects is found in Table 6‑18.
Table 6‑12 Risk Priority Rating
| > 50 | Extreme | Awareness of the event to be reported to Council. Urgent action to eliminate / mitigate / manage the risk. Document risk and action in the AMP. |
| 35-50 | Very High | Risk to be eliminated / mitigated / managed through normal business planning processes with responsibility assigned. |
| 14-35 | High | Manage risk using routine procedures. |
| 3.5-14 | Moderate | Monitor the risk. |
< 3.5
| Low
| Awareness of the event to be reported to Council. Immediate action required to eliminate / mitigate / manage the risk. Document risk and action in the AMP. |
Table 6‑13 Risks – Eastern Selwyn Sewerage Scheme
| Non-consented activities | Renewal of consents | 2014 | 27 | 27 | 6 |
| Inadequate septage facilities | Provide septage facilities | 2017 | | 27
| 4 |
| Plant capacity inadequate | Irrigation Pump | 2017 | | 20 | 6 |
| Irrigation Pump H&S | Irrigation Pump gantry | 2017 | | 45 | 6 |
| Lincoln pond odour risk | Lincoln pond aeration | 2017 | | 4 | 4 |
| Complex network is not run with efficiency | Develop hydraulic models to optimise operation, renewals and criticality assessment | 2014 | 12 | 2.1 | 2.1 |
| Disposal capacity via current irrigators is exceeded | Upgrade no. 5&6 central pivots (extend 150m) | 2014 | 27 | 27 | 2.1 |
| New treatment plant does not meet design criteria | Review plant operations | 2014 | 27 | 27 | 2.1 |
| Sewage generating gases and potential for odour within pressure mains | Review adequacy of odour control | 2014 | 27 | 27 | 2.1 |
| Sludge does not meet AA grade for disposal onsite | Install a sludge blending facility to mix organic waste from recovery park | 2014 | 27 | 27 | 45 |
The list of district wide risks can be found in 5Waters Activity Management Plan: Volume 1.
6.10 Asset Valuation Details
The total replacement value of assets within the Eastern Selwyn Sewerage Scheme is $62,919,041 as detailed in Table 6‑14 below.
Table 6‑14 Replacement Values by Asset Types
Plant & equipment (includes treatment infrastructure, instrumentation, telemetry, etc.)
| $33,405,399
|
Reticulation/conveyance (pipes, valves, manholes)
| $19,946,911
|
Buildings
| $9,566,730
|
6.11 Renewals
The renewal profile has been taken from the 2019 5Waters Valuation.
6.12 Critical Assets
The criticality model for ESSS has been updated for the 2021 AcMP. The methodology of the criticality model can be found in 5Waters Activity Management Plan: Volume 1 and it provides details of how the criticality has been calculated for the reticulation assets. Table 6‑15 and Figure 6‑12 below shows the calculated criticality for all of the assets within this scheme that have a recorded known length.
Table 6‑15 Length of Assets per Criticality Level
5
| Low
| 1,639 |
4
| Medium-Low | 9,318 |
3
| Medium | 2,144 |
2
| Medium-High | 4,053 |
1
| High | 18,717
|
6.13 Asset Condition
The asset condition model was run for Eastern Selwyn Sewerage Scheme in 2021. The methodology of the model can be found in 5Waters Activity Management Plan: Volume 1 and it provides details of how the model has been calculated for the reticulation assets (particularly pipes). Figure 6‑13 below shows the level of asset condition for all of the assets within this scheme that have a recorded known condition.
Table 6‑16 provides a description of the condition rating used within the condition model.
Table 6‑16 Asset Condition Grading
| 1.0 | Excellent |
| 2.0 | Good |
| 3.0 | Moderate |
| 4.0 | Poor |
| 5.0+ | Fail |
6.14 Funding Program
The 10 year budgets are shown by Table 4‑7. Budgets are split into expenditure, renewals, projects and capital projects. Expenditure and renewals have been reported on a district-wide basis in Volume 1.
All figures are ($) not adjusted for CPI “inflation". They are calculated on historical data, and population growth where relevant.
Table 6‑17 Eastern Selwyn Sewerage Budget Summary
2021/2022
| $30,000
| $450,000
|
2022/2023
| $30,000
| $6,570,000
|
2023/2024
| $30,000
| $14,030,000
|
2024/2025
| $30,000
| $300,000
|
2025/2026
| $30,000
| $2,400,000
|
2026/2027
| $30,000
| $8,160,000
|
2027/2028
| $30,000
| $300,000
|
2028/2029
| $30,000
| $300,000
|
2029/2030
| $30,000
| $1,288,000
|
2030/2031
| $30,000
| $300,000
|
| Total | $300,000
| $34,098,000
|
An explanation of the categories within the budgets are as follows below:
- Expenditure consists of operation and maintenance costs;
- Renewals are replacement of assets which are nearing or exceeded their useful life;
- Projects are investigations, decisions and planning activities which exclude capital works; and
- Capital projects are activities involving physical works.
There are a number of major projects for Eastern Selwyn Sewerage scheme in the LTP budget.
Table 6‑18 Key Projects
Capital Projects
|
466790028
|
Pines 60
|
$250,000
|
$5,600,000
| $13,730,000
| -
| 100% G
|
|---|
Capital Projects
|
466790085
|
Pines 120
|
-
|
-
| -
| $8,260,000
| 100% G
|
|---|
Capital Projects
|
466790031
|
Conveyance and pumping
|
$200,000
|
$970,000
| $300,000
| $4,788,000
| 100% G
|
|---|
* G refers to Growth
The list of district wide projects can be found in 5Waters Activity Management Plan: Volume 1.
Discussion on Projects
Projects have been determined based on their:
- Relevance to the scheme
- Requirement to be completed under legislation
- Ability to bring the scheme up to or maintain the Level of Service required under council's Asset Management Policy.
Many projects are
jointly funded by more than one scheme and activity. Each scheme pays a pro-rata share only, equivalent to the number of connections.
Discussion on Capital and Projects
Where relevant, Capital (Levels of Service) and Capital (Growth) projects have been included in the scheme financial details.
Levels of Service Projects and growth splits have been provided to ensure the costs of population driven works are clear.
<<
5-Waters-Volume-3-Wastewater


