<<
5-Waters Volume 1
5 Levels of Service
The Levels of Service for the 5Waters Activities are defined in this section and the performance measures by which the service levels will be assessed. The levels of service are aimed at supporting the community outcomes and meeting the strategic goals. This section also holds information on the customer surveys undertaken and the legislative requirements adhered to in arriving at the service levels.
Figure 5‑1 below outlines the linkages between the current legislation, community objectives, 5Waters objectives and key performance indicators.
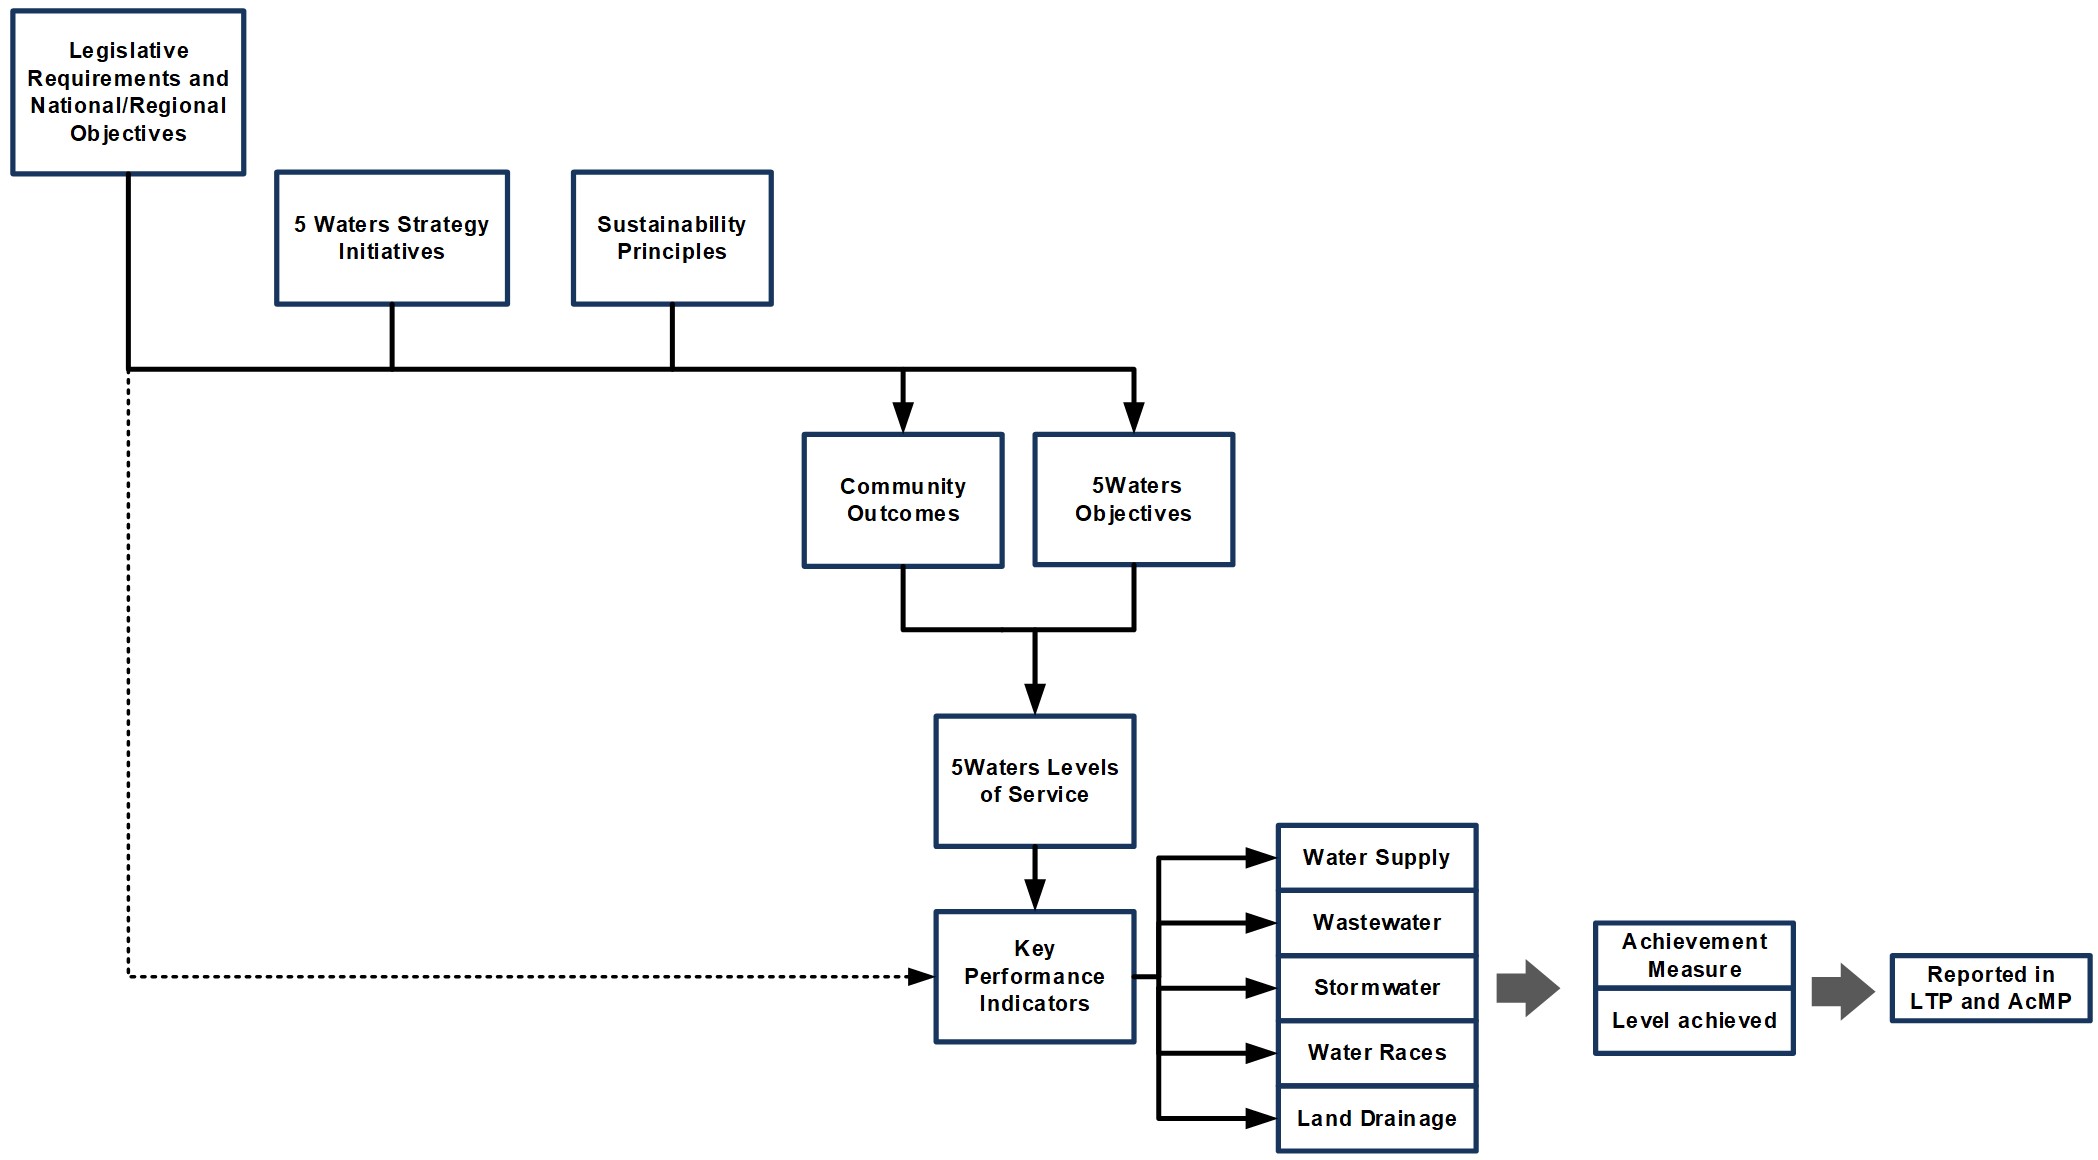
Figure 5‑1 Influences in Key Performance Indicators
5.1 Objectives
Objectives and levels of service are developed to reflect the expectations of the community and regulators. Targets are established which indicate the standard that should be met. Objectives are relevant to all of the 5Waters, while Levels of Service statements are more specific.
The objectives of water services are cited below. The generic wording of these objectives is intentional so they are applicable across the 5Waters. This ensures that they can be used to evaluate and prioritise the benefits of any proposed projects or improvement measures, across the 5Waters Activity. This is a key step towards integrated management of the five water services.
Table 5‑1 5Waters Objectives
1
| The community is provided with water services to a standard that protects their health and property
|
2
| Customers are provided with and fairly charged for water services that meet their reasonable needs |
| 3 | Nuisance effects of water services are minimised |
4
| Water services are provided in a cost effective manner |
| 5 | Problems with water services are addressed in a timely manner and prioritised according to risk and need |
| 6 | Service capacity is provided to accommodate growing communities, where this growth is sustainable |
| 7 | Adverse effects of water services on cultural and heritage values are minimised |
8
| Adverse effects of water services on the environment are minimised. |
9
| Greenhouse gas emissions from the provision of water services are minimised. |
Level of service statements are more specific than the objectives and may apply to one or more of the 5Waters activities. These statements are written in a manner that can be understood by non-technical readers, but are often linked with more technical definition.
Levels of service must be measurable. The performance measures that have been attributed to each level of service have been specified to ensure:
- They can be benchmarked to other utilities wherever possible; and
- They are mutually independent of each other.
5.2 Community Outcomes
Community outcomes are the outcomes that a local authority aims to achieve in meeting the current and future needs of communities for good-quality local infrastructure, local public services, and performance of regulatory functions. They represent the Council's overall vision for the District, and they guide the Council as it makes its plans and delivers its services.
The community outcomes were initially developed in 2006 based on a range of information sources and consultation processes. They were further developed in 2009 as part of the preparation of the Selwyn Community Plan 2009/19 and further refined as part of the preparation of the 2012/22 and 2015/25 LTPs, see Table 5‑2 below.
Table 5‑2 Community Outcomes
Environment
| A clean environment | Air, land, water and general environment to be kept in a healthy condition. |
| A rural district | A living environment where the rural identity of Selwyn is maintained. |
Social
| A healthy community
| We have appropriate health, social and community services & they are accessible to all residents of the district.
|
| We have access to drinking water that helps protect their health. |
A safe place in which to live, work and play
| We are safe at home and in the community. |
We maintain a coordinated and effective response to, and recover from, emergency and disaster events.
|
An educated community
| Our district provides a range of quality, lifelong education and training opportunities.
|
Economic
| A prosperous community | Selwyn has a strong economy which fits within and complements the environmental, social and cultural environment of the district. |
| Culture | A community which values its culture and heritage | Our district provides a range of arts and cultural experiences and facilities. Local history and heritage is preserved, shared and promoted.
|
Key Community Outcomes and how they relate to the 5Waters Activity are detailed below in Table 5‑3.
Table 5‑3 Community Outcomes and 5Water Services
| Air, land, water and general environment to be kept in a healthy condition. | Manage the 5 Waters activities in a way that minimises their potential adverse impact on the environment.
|
| A living environment where the rural identity of Selwyn is maintained. | Provide water races and land drainage systems that are part of the rural landscape and contribute to the ability to use rural land for agriculture.
|
We have appropriate health, social and community services & they are accessible to all residents of the district.
| Provide water, wastewater and drainage services necessary to support community and public health services. There is potential to provide for recreational opportunities in conjunction with stormwater management strategies.
|
| We have access to drinking water that helps protect their health. | Provide safe drinking water for all water schemes within the Selwyn district.
|
| We are safe at home and in the community. | Provide safe drinking water and effective wastewater removal and disposal as well as removal of stormwater and excess groundwater (via land drainage).
|
We maintain a coordinated and effective response to, and recover from, emergency and disaster events.
| Respond to emergency events by providing safe drinking water and effective wastewater removal and disposal as well as removal of stormwater and excess groundwater (via land drainage).
|
| Our district provides a range of quality, lifelong education and training opportunities. | Provide water, wastewater and drainage services necessary to support education facilities.
|
Selwyn has a strong economy which fits within and complements the environmental, social and cultural environment of the district.
| Provide business with water, wastewater and drainage services, sometimes to a higher standard or with a higher level of reliability than regular domestic services. Effective water races and land drainage systems are essential for productive use of land.
|
Our district provides a range of arts and cultural experiences and facilities. Local history and heritage is preserved, shared and promoted.
| Provide water, wastewater and drainage services for cultural activities. All 5Waters activities can impact on the cultural and heritage values and need to be managed to minimise adverse effects.
|
The achievement of community outcomes can be assisted through the delivery of levels of service. The levels of service have been reviewed to ensure that they adequately cover those adopted previously and align with the community outcomes.
5.3 5Waters Level of Service
Community outcomes are achieved by providing a level of service to the community. Levels of service provided by the Council are also driven by:
- Customer expectations of the quality of service;
- The price customers are willing to pay for the service;
- Legislative requirements;
- Strategic objectives of the Council;
- Availability of resources; and
- Financial constraints.
This section outlines the current level of service and performance measures identified for each.
5.3.1 Current Level of Service
The levels of service for 5Waters activities are shown below in Table 5‑4. The level of service is linked to the 5Waters objectives.
Table 5‑4 5Waters Level of Service
Land Drainage
| To minimise nuisance effects from water services.
| Customer Satisfaction
The land drainage network is managed to give a good quality service.
|
Water services are provided in a cost effective manner.
|
Operating Costs The land drainage network is provided at a reasonable cost. |
Stormwater
| Adverse effects of water services on the environment are minimised. |
Discharge Compliance The stormwater network is managed in accordance with resource consents conditions. |
To minimise nuisance effects from water services.
| Customer Satisfaction
The stormwater network is managed to give a good quality service. |
| Problems with water services are addressed in a timely manner and prioritised according to risk and need. |
Response Times Flooding events are attended promptly by contractors and/or staff. |
| The community is provided with water services to a standard that protects their health and property. |
System Adequacy The stormwater system is maintained adequately and minimises flooding. |
| Water services are provided in a cost effective manner. |
Operating Costs The stormwater network is provided at a reasonable cost. |
Wastewater
| Adverse effects of water services on the environment are minimised. |
Discharge Compliance The wastewater network is managed in accordance with resource consent conditions. |
Nuisance effects of water services are minimised.
| Customer Satisfaction
The wastewater network is managed to give a good quality service.
|
| Problems with water services are addressed in a timely manner and prioritised according to risk and need. |
Fault Response Times Wastewater system faults or problems are attended to promptly by contractors and/or staff. |
| Service capacity is provided to accommodate growing communities, where this growth is sustainable. |
Serviced Area The wastewater network is provided to growing communities, where this growth is sustainable. |
The community is provided with water services to a standard that protects their health and property.
|
System Adequacy The wastewater network is managed to give a good quality service. |
| Water services are provided in a cost effective manner. |
Operating Costs Wastewater services are provided at a reasonable cost. |
Water Supply
| Adverse effects of water services on the environment are minimised.
|
Water Take Compliance The water supply network is managed in accordance with resource conditions. |
Nuisance effects of water services are minimised.
| Customer Satisfaction
The water supply network is managed to give a good quality service.
|
Problems with water services are addressed in a timely manner and prioritised according to risk and need.
|
Fault Response Times Water system faults or problems are attended to promptly by contractors and/or staff. |
Service capacity is provided to accommodate growing communities, where this growth is sustainable.
|
Serviced Area The water supply network is provided to growing communities, where this growth is sustainable. |
Maintenance of the Reticulation Network The water supply network is managed to minimise the leakage or loss from the system.
|
Demand Management There is enough water supplied to meet customer needs.
|
Safety of Drinking Water Water is safe to drink and complies with the Drinking Water Standards of New Zealand. |
| Water services are provided in a cost effective manner. |
Operating Costs The water supply is provided at a reasonable cost. |
Water Races
| Nuisance effects of water services are minimised.
| Customer Service
The water race network is managed to give a good quality service.
|
| Problems with water services are addressed in a timely manner and prioritised according to risk and need. |
Fault Response Times Water race system faults or problems are attended to promptly by contractors and/or staff. |
| Water services are provided in a cost effective manner. |
Operating Costs The water race network is provided at a reasonable cost. |
| Adverse effects of water services on the environment are minimised. |
Water Take Compliance The water race network is managed in accordance with resource consent conditions. |
5.3.2 Risks associated with Level of Service
Consideration has been given to any risks associated with not meeting the levels of performance measures. The 5Waters level of service relate to critical services and the performance targets adopted show a continuance of existing levels of service.
The following risks have been identified and considered:
- Levels of service targets are not met. Unless budgets are reduced, the risk is low as targets are strongly linked to population growth and also funded from development contributions.
- Changes to community expectations. The risk is medium. The level of service has improved over the past ten years but as residents move from Christchurch City to Selwyn townships they expect the same level of service to be provided. This is not always feasible especially in towns such as West Melton, where the infrastructure upgrades have not kept up with population growth.
5.3.3 Key Performance Indicators
The key performance indicators for 2021-2031 have been derived from the mandatory non-financial performance measures and existing measures. The non-financial measures only focus on stormwater, wastewater and water supply therefore some of these measures have also been applied to the other two waters, land drainage and water races, for consistency. A customer satisfaction measure across the 5Waters has also been added.
5.3.3.1 Legislative Requirements
The legislation applicable to the management of assets covered in this activity management plan is outlined in Section 2.0. It is noted in this section that significant changes to the LGA were made in 2014. Within these the Secretary for Local Government was required to make rules specifying non-financial measures for local authorities to use when reporting to their communities. The Department of Internal Affairs states that:
The aim was to help the public to contribute to discussions on future levels of service for their communities and to participate more easily in their local authority's decision-making processes.
The performance measures will do this through providing better information about the levels of service for five groups of activities carried out by local authorities – stormwater drainage, wastewater and the disposal of wastewater, flood protection and control works, water supply, and the provision of footpaths and roads. Local authorities will be required to use a standard set of performance measures for these five activities when reporting to their communities.
These mandatory performance measures are cited below.
Performance Measure 1 – safety of drinking water
The extent to which Council's water supply complies with:
a) Part 4 of the drinking water standards (bacteria compliance criteria)
b) Part 5 of the drinking water standards (protozoa compliance criteria)
Performance Measure 2 – maintenance of the reticulation network
The percentage of real water loss from Council's networked reticulation system (including a description of the methodology used to calculate this)
Performance Measure 3 – fault response times
Where Council attends to a call-out in response to a fault or unplanned interruption to its networked reticulation system, the following median response times measured:
a) Attendance for urgent call outs: from the time that Council receives notification to the time that service personnel reach the site, and
b) Resolution of urgent call outs: from the time that Council receives notification to the time that service personnel confirm resolution of the fault or interruption
c) Attendance for non urgent call outs: from the time that Council receives notification to the time that service personnel reach the site, and
d) Resolution of non urgent call outs: from the time that Council receives notification to the time that service personnel confirm resolution of the fault or interruption
Performance Measure 4 – customer satisfaction
The total number of complaints received by Council about any of the following:
a) Drinking water clarity
b) Drinking water taste
c) Drinking water odour
d) Drinking water pressure
e) Continuity of supply
f) Council's response to any of these issues
Performance Measure 5 – demand management
The average consumption of drinking water per day per resident within the district.
The rules came into force on 30 July 2014 and Council was required to incorporate these performance measures in the 2015-2025 LTP onwards.
5.3.3.2 2021-2031 Key Performance Indicators
The key performance indicators assess the level of service achieved within the 5Waters activities, these are listed below in Table 5‑5 - Table 5‑9 below. Targets for the next ten years have been set and where these targets are changing over time shows the improvements to the level of service that the Council is aiming to achieve. The levels of service and performance targets are generic across the 5Waters schemes, however it is recognised that there are different level of service in urban areas in comparison to rural areas.
Table 5‑5 Land Drainage Performance Measures for 2021-2031
|
5Waters Objectives |
Level of Service |
Key Performance Indicators |
Target Year 1 |
Target Year 2 |
Target Year 3 |
Target Year 4 to 10 |
| Nuisance effects from water services are minimised. | Customer Satisfaction
The land drainage network is managed to give a good quality service.
| The number of complaints received about the performance of the Land Drainage system, expressed per 1000 rated properties. | Less than 10 | Less than 10
| Less than 10
| Less than 10
|
| Water services are provided in a cost effective manner. |
Operating Costs The land drainage network is provided at a reasonable cost. | Total average operating cost per serviced property for Land Drainage. | ≤$150
| ≤$160
| ≤$170
| ≤$180
|
Table 5‑6 Stormwater Performance Measures for 2021-2031
|
5Waters Objectives |
Level of Service |
Key Performance Indicators |
Target Year 1 |
Target Year 2 |
Target Year 3 |
Target Year 4 to 10 |
| Adverse effects of water services on the environment are minimised. |
Discharge Compliance The stormwater network is managed in accordance with resource consents conditions. | Compliance with resource consents for discharge from the stormwater system measured by the number of: a) abatement notices; b) infringement notices c) enforcement orders; and d) convictions. Received from Environment Canterbury. | a) Nil b) Nil c) Nil d) Nil
| a) Nil b) Nil c) Nil d) Nil
| a) Nil b) Nil c) Nil
d) Nil
| a) Nil b) Nil c) Nil d) Nil
|
| Nuisance effects of water services are minimised. | Customer Satisfaction
The stormwater network is managed to give a good quality service. | The number of complaints received about the performance of the stormwater system, expressed per 1000 rated properties. | Less than 20
| Less than 20
| Less than 20
| Less than 20
|
| Problems with water services are addressed in a timely manner and prioritised according to risk and need. |
Response Times Flooding events are attended promptly by contractors and/or staff. | The median response time to attend a flooding event measured from the time that personnel receives notification to the time that service personnel reach the site. (Mandatory Performance Measure)
| Less than 1 hour for urgent flooding events | Less than 1 hour for urgent flooding events | Less than 1 hour for urgent flooding events | Less than 1 hour for urgent flooding events |
The community is provided with water services to a standard that protects their health and property.
|
System Adequacy The stormwater system is maintained adequately and minimises flooding.
| The number of flooding events that occur as a result of overflow from the stormwater system that enters a habitable floor. (Mandatory Performance Measure)
| Nil in less than 50 year storm events | Nil in less than 50 year storm events | Nil in less than 50 year storm events | Nil in less than 50 year storm events |
For each flooding event, the number of habitable floors affected, expressed per 1000 properties connected to the stormwater system. (Mandatory Performance Measure)
| Nil per 1000 connected properties in less than 50 year storm events | Nil per 1000 connected properties in less than 50 year storm events | Nil per 1000 connected properties in less than 50 year storm events | Nil per 1000 connected properties in less than 50 year storm events |
| Water services are provided in a cost effective manner. |
Operating Costs The stormwater network is provided at a reasonable cost. | Total average rate per serviced property for Stormwater. | ≤$100
| ≤$105
| ≤$110
| ≤$115
|
Table 5‑7 Wastewater Performance Measures for 2021-2031
|
5Waters Objectives |
Level of Service |
Key Performance Indicators |
Target Year 1 |
Target Year 2 |
Target Year 3 |
Target Year 4 to 10 |
| Adverse effects of water services on the environment are minimised. |
Discharge Compliance The wastewater network is managed in accordance with resource consent conditions. | Compliance with resource consents for discharge from the wastewater system measured by the number of: a) abatement notices; b) infringement notices c) enforcement orders; and d) convictions. Received from Environment Canterbury.
Received from Environment Canterbury. (Mandatory Performance Measure)
| a) Nil b) Nil c) Nil d) Nil
| a) Nil b) Nil c) Nil d) Nil
| a) Nil b) Nil c) Nil d) Nil
| a) Nil b) Nil c) Nil d) Nil
|
| Nuisance effects of water services are minimised. | Customer Satisfaction
The wastewater network is managed to give a good quality service. | The total number of complaints received about wastewater odour, blockages and system faults, expressed per 1000 rated properties. (Mandatory Performance Measure)
| Less than 8
| Less than 8 | Less than 8
| Less than 8
|
| Problems with water services are addressed in a timely manner and prioritised according to risk and need. |
Fault Response Times Wastewater system faults or problems are attended to promptly by contractors and/or staff. | Where personnel attend wastewater overflows resulting from a blockage or other fault in the wastewater system. The median response time measures the: a) attendance time: from the time that the personnel receives notification to the time that service personnel reach the site; b) resolution time: from the time that the personnel receives notification to the time that service personnel confirm resolution of the blockage or other fault. | a) Less than 1 hour b) Less than 24 hours | a) Less than 1 hour b) Less than 24 hours | a) Less than 1 hour b) Less than 24 hours | a) Less than 1 hour b) Less than 24 hours |
| Service capacity is provided to accommodate growing communities, where this growth is sustainable. |
Serviced Area The wastewater network is provided to growing communities, where this growth is sustainable. | The proportion of residential properties serviced by wastewater services within the district expressed as a percentage of total residential properties. | ≥60%
| ≥60% | ≥60% | ≥60% |
| The community is provided with water services to a standard that protects their health and property. |
System Adequacy The wastewater network is managed to give a good quality service. | The number of wet and dry weather wastewater overflows from the wastewater system, expressed per 1000 rated properties. (Mandatory Performance Measure)
| Less than 1.4 overflow/1000 rated properties
| Less than 1.4 overflow/1000 rated properties
| Less than 1.4 overflow/1000 rated properties
| Less than 1.4 overflow/1000 rated properties
|
| Water services are provided in a cost effective manner. |
Operating Costs Wastewater services are provided at a reasonable cost. | Total average rate per serviced property for wastewater. | ≤$550
| ≤$550
| ≤$555
| ≤$560
|
Table 5‑8 Water Supply Performance Measures for 2021-2031
|
5Waters Objectives |
Level of Service |
Key Performance Indicators |
Target Year 1 |
Target Year 2 |
Target Year 3 |
Target Year 4 to 10 |
| Adverse effects of water services on the environment are minimised. |
Water Take Compliance The water supply network is managed in accordance with resource conditions. | Compliance with resource consents for surface water takes for water supplies measured by the number of: a) abatement notices; b) infringement notices c) enforcement orders; and d) convictions. Received from Environment Canterbury. | a) Nil b) Nil c) Nil d) Nil
| a) Nil b) Nil c) Nil d) Nil
| a) Nil b) Nil c) Nil d) Nil
| a) Nil b) Nil c) Nil d) Nil
|
| Nuisance effects of water services are minimised. | Customer Satisfaction
The water supply network is managed to give a good quality service. | The total number of complaints received about drinking water clarity, continuity of supply, odour, taste, pressure and flow, expressed per 1000 rated properties. | Less than 20
| Less than 20
| Less than 20
| Less than 20
|
Problems with water services are addressed in a timely manner and prioritised according to risk and need.
|
Fault Response Times Water system faults or problems are attended to promptly by contractors and/or staff.
| Where personnel attend a non-urgent call-out in response to a fault or unplanned interruption in the reticulation system. The median response times measures the: a) attendance time: from the time that personnel receive notification to the time that service personnel reach the site; b) resolution time: from the time that personnel receive notification to the time that service personnel confirm resolution of the fault or interruption. | a) Less than 24 hours
b) Less than 120 hours | a) Less than 24 hours
b) Less than 120 hours | a) Less than 24 hours
b) Less than 120 hours | a) Less than 24 hours b) Less than 120 hours |
Where personnel attend an urgent call-out in response to a fault or unplanned interruption in the reticulation system. The median response times measures the: a) attendance time: from the time that personnel receive notification to the time that service personnel reach the site; b) resolution time: from the time that personnel receive notification to the time that service personnel confirm resolution of the fault or interruption. | a) Less than 4 hours b) Less than 48 hours
| a) Less than 4 hours b) Less than 48 hours
| a) Less than 4 hours b) Less than 48 hours
| a) Less than 4 hours b) Less than 48 hours
|
Service capacity is provided to accommodate growing communities, where this growth is sustainable.
|
Serviced Area The water supply network is provided to growing communities, where this growth is sustainable. | The proportion of residential properties serviced by water supplies within the district expressed as a percentage of total residential properties. | ≥80% | ≥80% | ≥80% | ≥80% |
Maintenance of the Reticulation Network The water supply network is managed to minimise the leakage or loss from the system. | The percentage of real water loss from the water reticulation system in urban schemes. | 20% | 20% | 19% | 18% |
Demand Management There is enough water supplied to meet customer needs. | The average consumption of drinking water per day per resident. | Less than 0.5m3 per person per day within urban schemes | Less than 0.49m3 per person per day within urban schemes | Less than 0.48m3 per person per day within urban schemes | Less than 0.47m3 per person per day within urban schemes |
Safety of Drinking Water Water is safe to drink and complies with the Drinking Water Standards of New Zealand.
| The extent to which the drinking water supplies comply with the drinking water standards for bacteria compliance. | 99.9% of monitoring samples comply, at both the treatment plant and within the reticulation, across the district | 99.9% of monitoring samples comply, at both the treatment plant and within the reticulation, across the district | 99.9% of monitoring samples comply, at both the treatment plant and within the reticulation, across the district | 99.9% of monitoring samples comply, at both the treatment plant and within the reticulation, across the district |
| The extent to which the drinking water supplies comply with the drinking water standards for protozoal compliance. | 80% of the treatment plant sites are compliant across the district | 85% of the treatment plant sites are compliant across the district | 85% of the treatment plant sites are compliant across the district | 90% of the treatment plant sites are compliant across the district |
| Water services are provided in a cost effective manner. |
Operating Costs The water supply is provided at a reasonable cost. | Total cost to provide 200m3 of water to an 'on demand' serviced property.
| ≤$400
| ≤$440
| ≤$484
| ≤$532
|
Table 5‑9 Water Race Performance Measures for 2021-2031
|
5Waters Objectives |
Level of Service |
Key Performance Indicators |
Target Year 1 |
Target Year 2 |
Target Year 3 |
Target Year 4 to 10 |
| Nuisance effects of water services are minimised. | Customer Satisfaction
The water race network is managed to give a good quality service. | The total number of complaints received about continuity of supply, expressed per 1000 rated properties. | Less than 50
| Less than 50 | Less than 50 | Less than 50 |
Problems with water services are addressed in a timely manner and prioritised according to risk and need.
|
Fault Response Times Water race system faults or problems are attended to promptly by contractors and/or staff. | Where personnel attends an urgent blockage or other fault in the water race system. The median response times measures the: a) Attendance time: from the time that personnel receives notification to the time that service personnel reach the site; b) Resolution time: the time that personnel receives notification to the time that service personnel confirm the resolution of the blockage or other fault. | a) Less than 4 hours
b) Less than 48 hours
| a) Less than 4 hours
b) Less than 48 hours
| a) Less than 4 hours
b) Less than 48 hours
| a) Less than 4 hours
b) Less than 48 hours
|
| Water services are provided in a cost effective manner. |
Operating Costs The water race network is provided at a reasonable cost. | Total average operating cost per serviced property for water races. | ≤$200 | ≤$200 | ≤$200 | ≤$200 |
| Adverse effects of water services on the environment are minimised. |
Water Take Compliance The water race network is managed in accordance with resource consent conditions.
| Compliance with resource consents for surface water takes for water supplies measured by the number of: a) abatement notices; b) infringement notices c) enforcement orders; and d) convictions. Received from Environment Canterbury. | a) Nil b) Nil c) Nil d) Nil
| a) Nil b) Nil c) Nil d) Nil
| a) Nil b) Nil c) Nil d) Nil
| a) Nil b) Nil c) Nil d) Nil
|
5.3.3.3 Past Performance
The Annual Reports show the level of achievement across the key performance indicators and therefore the level of service. This section outlines the past performance of Council for some of the key performance indicators. Due to the recent implementation of mandatory performance measures, past performance is not available for all measures.
Drinking Water Compliance
For a number of years drinking water compliance has been measured and reported for the zone and treatment plant. The results and the targets for the past eight years are shown below in Figure 5‑2.
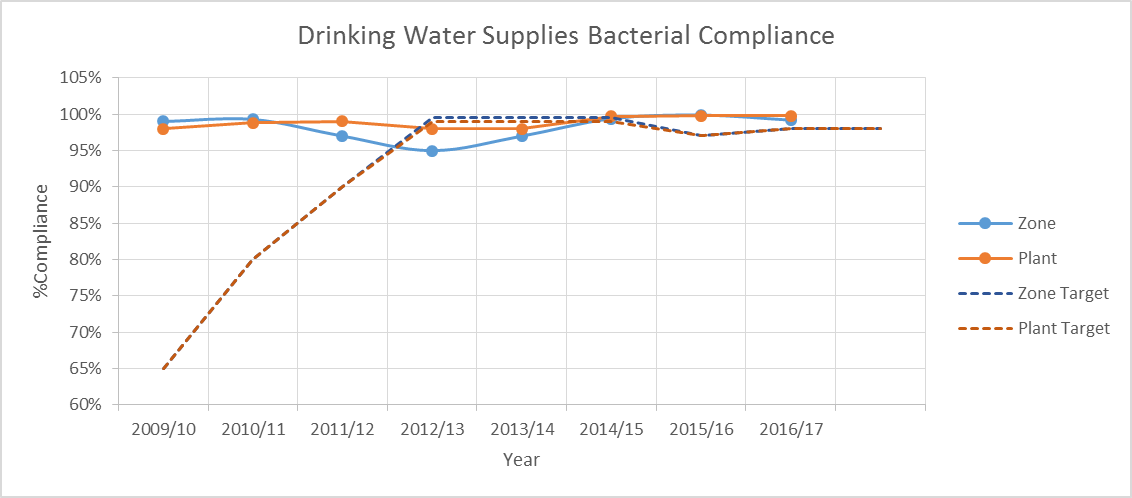
Figure 5‑2 Drinking Water Bacterial Compliance Past Performance
Properties Serviced with the District
For a number of years the proportion of residential properties serviced by water and wastewater services within the district has been measured. This measure shows the immense growth the district has undergone. The results and the targets for the past 8 years are shown below in Figure 5‑3.
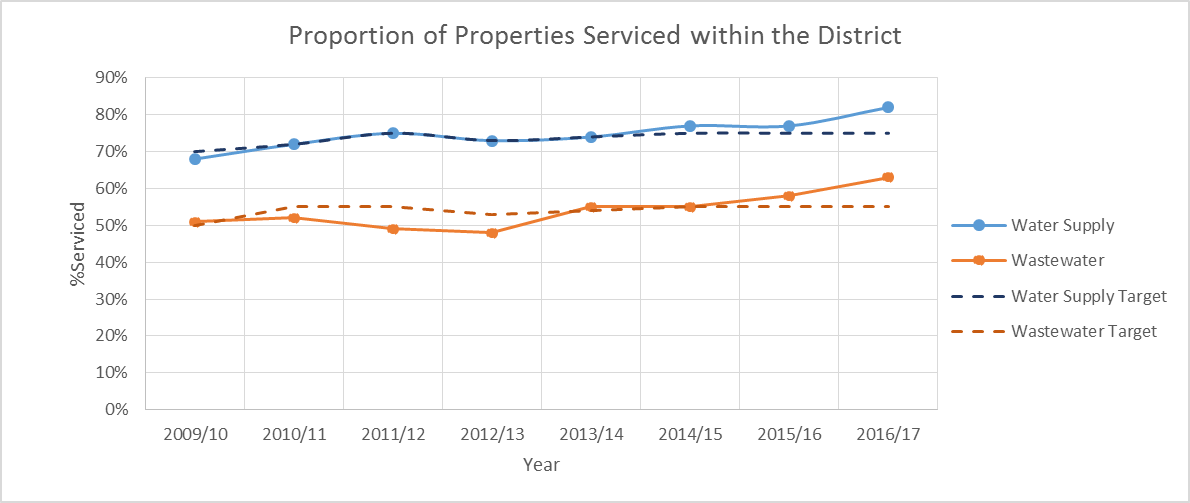
Figure 5‑3 Serviced Properties Past Performance
All other measures
Table 5‑10 below shows the achievement of the key performance indicators in recent years. The data for these measures in captured in the AMS system. The capture and reporting of this data is continually being refined, therefore this is listed as an improvement item.
Table 5‑10 Key Performance Indicator Performance
Land Drainage
|
|
5Waters Objectives |
Level of Service |
Key Performance Indicators | Achievement
| Target 2019/20
|
Achievement |
Target 2018/19 |
| Nuisance effects from water services are minimised. | The land drainage network is managed to give a good quality service.
| The number of complaints received about the performance of the Land Drainage system, expressed per 1000 rated properties. | Not achieved
8.19
| Less than 8
| Achieved
2.82
| Less than 10
|
| Water services are provided in a cost effective manner. |
Operating Costs The land drainage network is provided at a reasonable cost. | Total average operating cost per serviced property for Land Drainage.
| Not achieved
$122.48
| ≤$100
| Not achieved
$135
| ≤$100
|
Stormwater
|
|
5Waters Objectives |
Level of Service |
Key Performance Indicators | Achievement
| Target 2019/20
|
Achievement |
Target 2018/19 |
Adverse effects of water services on the environment are minimised.
|
Discharge Compliance The stormwater network is managed in accordance with resource consents conditions.
| Compliance with resource consents for discharge from the stormwater system measured by the number of: a) abatement notices; b) infringement notices c) enforcement orders; and d) convictions. Received from Environment Canterbury. | a) Achieved b) Achieved c) Achieved d) Achieved
| a) Nil b) Nil c) Nil d) Nil
| a) Achieved b) Achieved c) Achieved d) Achieved | a) Nil b) Nil c) Nil d) Nil |
| Nuisance effects of water services are minimised. | Customer Satisfaction
The stormwater network is managed to give a good quality service. | The number of complaints received about the performance of the stormwater system, expressed per 1000 rated properties. | Not achieved
10.13
| Less than 8
| Achieved 2.91
| Less than 10 |
| Problems with water services are addressed in a timely manner and prioritised according to risk and need. |
Response Times Flooding events are attended promptly by contractors and/or staff. | The median response time to attend a flooding event measured from the time that personnel receives notification to the time that service personnel reach the site. | Achieved
Nil
| Less than 1 hour for urgent flooding events
| Achieved Nil
| Less than 1 hour for urgent flooding events |
The community is provided with water services to a standard that protects their health and property.
|
System Adequacy The stormwater system is maintained adequately and minimises flooding.
| The number of flooding events that occur as a result of overflow from the stormwater system that enters a habitable floor. | Achieved Nil
| Nil in less than 50 year storm events
| Achieved Nil
| Nil in less than 50 year storm events |
| For each flooding event, the number of habitable floors affected, expressed per 1000 properties connected to the stormwater system. | Achieved Nil
| Nil per 1000 connected properties in less than 50 year storm events
| Achieved Nil | Nil per 1000 connected properties in less than 50 year storm events |
| Water services are provided in a cost effective manner. |
Operating Costs The stormwater network is provided at a reasonable cost. | Total average operating cost per serviced property for Stormwater. | Achieved
$63.20
| ≤$85
| Achieved $66
| ≤$85
|
Wastewater
|
|
5Waters Objectives |
Level of Service |
Key Performance Indicators | Achievement
| Target 2019/20
|
Achievement |
Target 2018/19 |
| Adverse effects of water services on the environment are minimised. |
Discharge Compliance The wastewater network is managed in accordance with resource consent conditions. | Compliance with resource consents for discharge from the wastewater system measured by the number of: a) abatement notices;
b) infringement notices c) enforcement orders; and d) convictions.
Received from Environment Canterbury.
| a) Achieved b) Achieved c) Achieved d) Achieved
| a) Nil b) Nil c) Nil d) Nil
| a) Achieved b) Achieved c) Achieved d) Achieved
| a) Nil b) Nil c) Nil d) Nil
|
| Nuisance effects of water services are minimised. | Customer Satisfaction
The wastewater network is managed to give a good quality service. | The total number of complaints received about wastewater odour, blockages and system faults, expressed per 1000 rated properties. | Achieved 2.18
| Less than 8
| Achieved 3.16
| Less than 10
|
| Problems with water services are addressed in a timely manner and prioritised according to risk and need. |
Fault Response Times Wastewater system faults or problems are attended to promptly by contractors and/or staff. | Where personnel attend wastewater overflows resulting from a blockage or other fault in the wastewater system. The median response time measures the: a) attendance time: from the time that the personnel receives notification to the time that service personnel reach the site;
b) resolution time: from the time that the personnel receives notification to the time that service personnel confirm resolution of the blockage or other fault. | a) Achieved 50 minutes b) Achieved 21 hours 51 minutes
| a) Less than 1 hour b) Less than 24 hours
| a) Achieved 30 minutes b) Achieved 5 hours 18 minutes | a) Less than 1 hour
b) Less than 24 hours |
| Service capacity is provided to accommodate growing communities, where this growth is sustainable. |
Serviced Area The wastewater network is provided to growing communities, where this growth is sustainable. | The proportion of residential properties serviced by wastewater services within the district expressed as a percentage of total residential properties. | Achieved
62%
| ≥60%
| Achieved 65% | ≥60% |
| The community is provided with water services to a standard that protects their health and property. |
System Adequacy The wastewater network is managed to give a good quality service. | The number of dry weather wastewater overflows from the wastewater system, expressed per 1000 rated properties.
| Achieved 0.4
| Less than 1.5 overflow
| Achieved 0.6
| Less than 1.5
overflow |
Water services are provided in a cost effective manner.
|
Operating Costs Wastewater services are provided at a reasonable cost. | Total average operating cost per serviced property for wastewater.
| Not achieved $383.46
| ≤$360
| Achieved $355
| ≤$360
|
Water Supply
|
|
5Waters Objectives |
Level of Service |
Key Performance Indicators | Achievement
| Target 2019/20
|
Achievement |
Target 2018/19 |
| Adverse effects of water services on the environment are minimised. |
Water Take Compliance The water supply network is managed in accordance with resource conditions. | Compliance with resource consents for surface water takes for water supplies measured by the number of: a) abatement notices;
b) infringement notices c) enforcement orders; and d) convictions.
Received from Environment Canterbury. | a) Achieved b) Achieved c) Achieved d) Achieved
| a) Nil b) Nil c) Nil d) Nil
| a) Achieved b) Achieved c) Achieved d) Achieved
| a) Nil b) Nil c) Nil d) Nil
|
| Nuisance effects of water services are minimised. | Customer Satisfaction
The water supply network is managed to give a good quality service. | The total number of complaints received about drinking water clarity, continuity of supply, odour, taste, pressure and flow, expressed per 1000 rated properties. | Not achieved
16.96
| Less than 15
| Not achieved19.16
| Less than 15
|
Problems with water services are addressed in a timely manner and prioritised according to risk and need.
|
Fault Response Times Water system faults or problems are attended to promptly by contractors and/or staff.
| Where personnel attend a non-urgent call-out in response to a fault or unplanned interruption in the reticulation system. The median response times measures the: a) attendance time: from the time that personnel receive notification to the time that service personnel reach the site; b) resolution time: from the time that personnel receive notification to the time that service personnel confirm resolution of the fault or interruption. | a) Achieved 1 hour 26 minutes b) Achieved 3 hours 30 minutes
| a) Less than 24 hours b) Less than 120 hours
| a) Achieved 1 hour 47 minutes
b) Achieved 6 hours 13 minutes | a) Less than 24 hours
b) Less than 120 hours |
Where personnel attend an urgent call-out in response to a fault or unplanned interruption in the reticulation system. The median response times measures the: a) attendance time: from the time that personnel receive notification to the time that service personnel reach the site; b) resolution time: from the time that personnel receive notification to the time that service personnel confirm resolution of the fault or interruption. | a) Achieved 46 minutes b) Achieved 2 hours 2 minutes
| a) Less than 4 hours b) Less than 48 hours
| a)Achieved 59 minutes b) Achieved 2 hours 12 minutes | a) Less than 4 hours b) Less than 48 hours |
Service capacity is provided to accommodate growing communities, where this growth is sustainable.
|
Serviced Area The water supply network is provided to growing communities, where this growth is sustainable. | The proportion of residential properties serviced by water supplies within the district expressed as a percentage of total residential properties.
| Not achieved 78%
| ≥80%
| Achieved 81%
| ≥80% |
Maintenance of the Reticulation Network The water supply network is managed to minimise the leakage or loss from the system. | The percentage of real water loss from the water reticulation system in urban schemes. | Achieved
17.1%
| ≤22%
| Achieved
13.5% | ≤24%
|
Demand Management There is enough water supplied to meet customer needs. | The average consumption of drinking water per day per resident. | Achieved
0.498m3 per person per day
| Less than 0.5m3 per person per day within urban schemes | Achieved 0.342m3 per person per day | Less than 0.6m3 per person per day within urban schemes |
Safety of Drinking Water Water is safe to drink and complies with the Drinking Water Standards of New Zealand.
| The extent to which the drinking water supplies comply with the drinking water standards for bacteria compliance. | Achieved Treatment: 99.96% Reticulation: 99.72%
| ≥99% of monitoring samples comply, at both the treatment plant and within the reticulation, across the district
| Achieved Treatment: 99.98% Reticulation: 99.83%
| ≥99% of monitoring samples comply, at both the treatment plant and within the reticulation, across the district |
| The extent to which the drinking water supplies comply with the drinking water standards for protozoal compliance. | Not achieved
72.92%
| ≥80% of the
treatment
plant sites
are compliant
across the
district.
| Achieved 70%
| ≥70% of the treatment plant sites are compliant across the district.
|
| Water services are provided in a cost effective manner. |
Operating Costs The water supply is provided at a reasonable cost. | Total average operating cost per serviced property for water supply. | Achieved $328.60
| ≤$330
| Achieved $289
| ≤$330 |
Water Races
|
|
5Waters Objectives |
Level of Service |
Key Performance Indicators | Achievement
| Target 2019/20
|
Achievement |
Target 2018/19 |
| Nuisance effects of water services are minimised. | Customer Satisfaction
The water race network is managed to give a good quality service. | The total number of complaints received about continuity of supply, expressed per 1000 rated properties. | Achieved 14.77
| Less than 50
| Achieved 14.33
| Less than 50
|
| Problems with water services are addressed in a timely manner and prioritised according to risk and need. |
Fault Response Times Water race system faults or problems are attended to promptly by contractors and/or staff. | Where personnel attends an urgent blockage or other fault in the water race system. The median response times measures the: a) Attendance time: from the time that personnel receives notification to the time that service personnel reach the site; b) Resolution time: the time that personnel receives notification to the time that service personnel confirm the resolution of the blockage or other fault. | a) Achieved 33 minutes b) Achieved 2 hours 43 minutes
| a) Less than 4 hours b) Less than 48 hours
| a) Achieved 2 hours 7 minutes b) Achieved 2 hours 54 minutes | a) Less than 4 hours b) Less than 48 hours |
| Water services are provided in a cost effective manner. |
Operating Costs The water race network is provided at a reasonable cost. | Total average operating cost per serviced property for water races. | Achieved
$96.87
| ≤$200 | Achieved
$195
| ≤$200
|
| Adverse effects of water services on the environment are minimised. |
Water Take Compliance The water race network is managed in accordance with resource consent conditions. | Compliance with resource consents for surface water takes for water supplies measured by the number of: a) abatement notices; b) infringement notices c) enforcement orders; and d) convictions. Received from Environment Canterbury. | a) Achieved (Nil) b) Achieved (Nil)
c) Achieved (Nil)
d) Achieved(Nil)
| a) Nil b) Nil c) Nil d) Nil
| a) Achieved (Nil)
b) Achieved (Nil)
c) Achieved (Nil)
d) Achieved(Nil)
| a) Nil b) Nil c) Nil d) Nil
|
5.3.4 Service Level Improvement Plan
Service level improvements occur when projects are undertaken that enhance the existing network or provide a new service. Projects identified in this plan will be prioritised according to urgency and importance.
As part of the long term process all known asset requirements are identified and assessed for inclusion in the plan. The budget is allocated to the most appropriate year from the best available information. The capital works program is approved by the Councillors and the executive team and then goes through a submissions process before finally being adopted. Projects that have been approved for funding from previous years are reviewed as part of this process and may be dropped if priorities or funding levels change.
Some capital works projects are 100% service level improvements since they provide a new service or are solely to increase in an existing level of service. Others, especially where there is a growth element involved, can be a mixture of renewals, growth and service level improvement.
5.3.5 Adoption of Levels of Service
The adoption of the LoS by Council is via Councils LTP program where any primary LoS changes are considered (no significant primary changes have occurred).
5.4 Improvement Planning
Throughout this section a number of specific actions to improve the way in which the Council identifies and manages its level of service associated with the 5Waters activity. These actions are summarised below in Table 5‑11.
Table 5‑11 AM Improvement Items – Levels of Service
5.3.4
| Continue to refine key performance measure targets
| Medium
| Every 3 years |
| 5.3.4.3 | Continue to improve capture of key performance indicator information within our AMS system | Medium | Ongoing
|
View citations

