<<
5-Waters-Volume-3-Wastewater
18.1 Scheme Summary
Estimated Population Served
| 2,434
|
Scheme Coverage (1 Jan 2021)
| Full Charges | 692
|
| Half Charges | 136
|
| >1 Charges | 9
|
System Components
| Piped (m) | 25261.22
|
| Manholes (No.) | 252 |
| Pump Stations (No.) | 2 |
| Treatment | N/A (to Pines WWTP) |
| Disposal | N/A (to Pines WWTP) |
| History | Original scheme installation date | 2007 |
Value ($)
| Replacement Cost | $10,661,568
|
Depreciated Replacement Cost,
| $9,820,617
|
| Financial | Operator cost (scheduled and reactive maintenance) per connection
| $76.10/connection
|
Demand
(1 Jan - 31 Dec 2020)
| Annually (m3) | 130,421
|
| Average daily (m3) | 357
|
| Peak daily (m3) | 704
|
| Minimum daily (m3) | 7
|
| Infiltration | No |
| Sustainability | Ultimate discharge point | To Pines WWTP |
18.2 Key Issues
The following key issues are associated with the West Melton Wastewater Scheme. A list of district wide issues are located in 5Waters Activity Management Plan: Volume 1.
Table 18‑1 West Melton Scheme Issues
| System discharge capacity is limited by Rolleston reticulation | All future development shall be required to assess remaining capacity and mitigate peak flows. |
18.3 Overview & History
Prior to 2010, the established area of West Melton relied on individual household on-site treatment systems (septic tanks).
A sewage system was developed to serve the Gainsborough subdivision and future developments. Untreated sewage is pumped via a rising/gravity main to Council's Eastern Sewerage Scheme, the Pines Treatment Plant. As a result of significant earthquake damage to septic tanks and Preston Downs development, connection to the reticulated sewerage scheme by the majority of the township has now occurred.
The PE rising main crosses the main slip/shear fault rupture line produced by the September 2010 Greendale earthquakes. Potholing did not reveal any damage to this pipe.

Figure 18‑2 Scheme Schematic
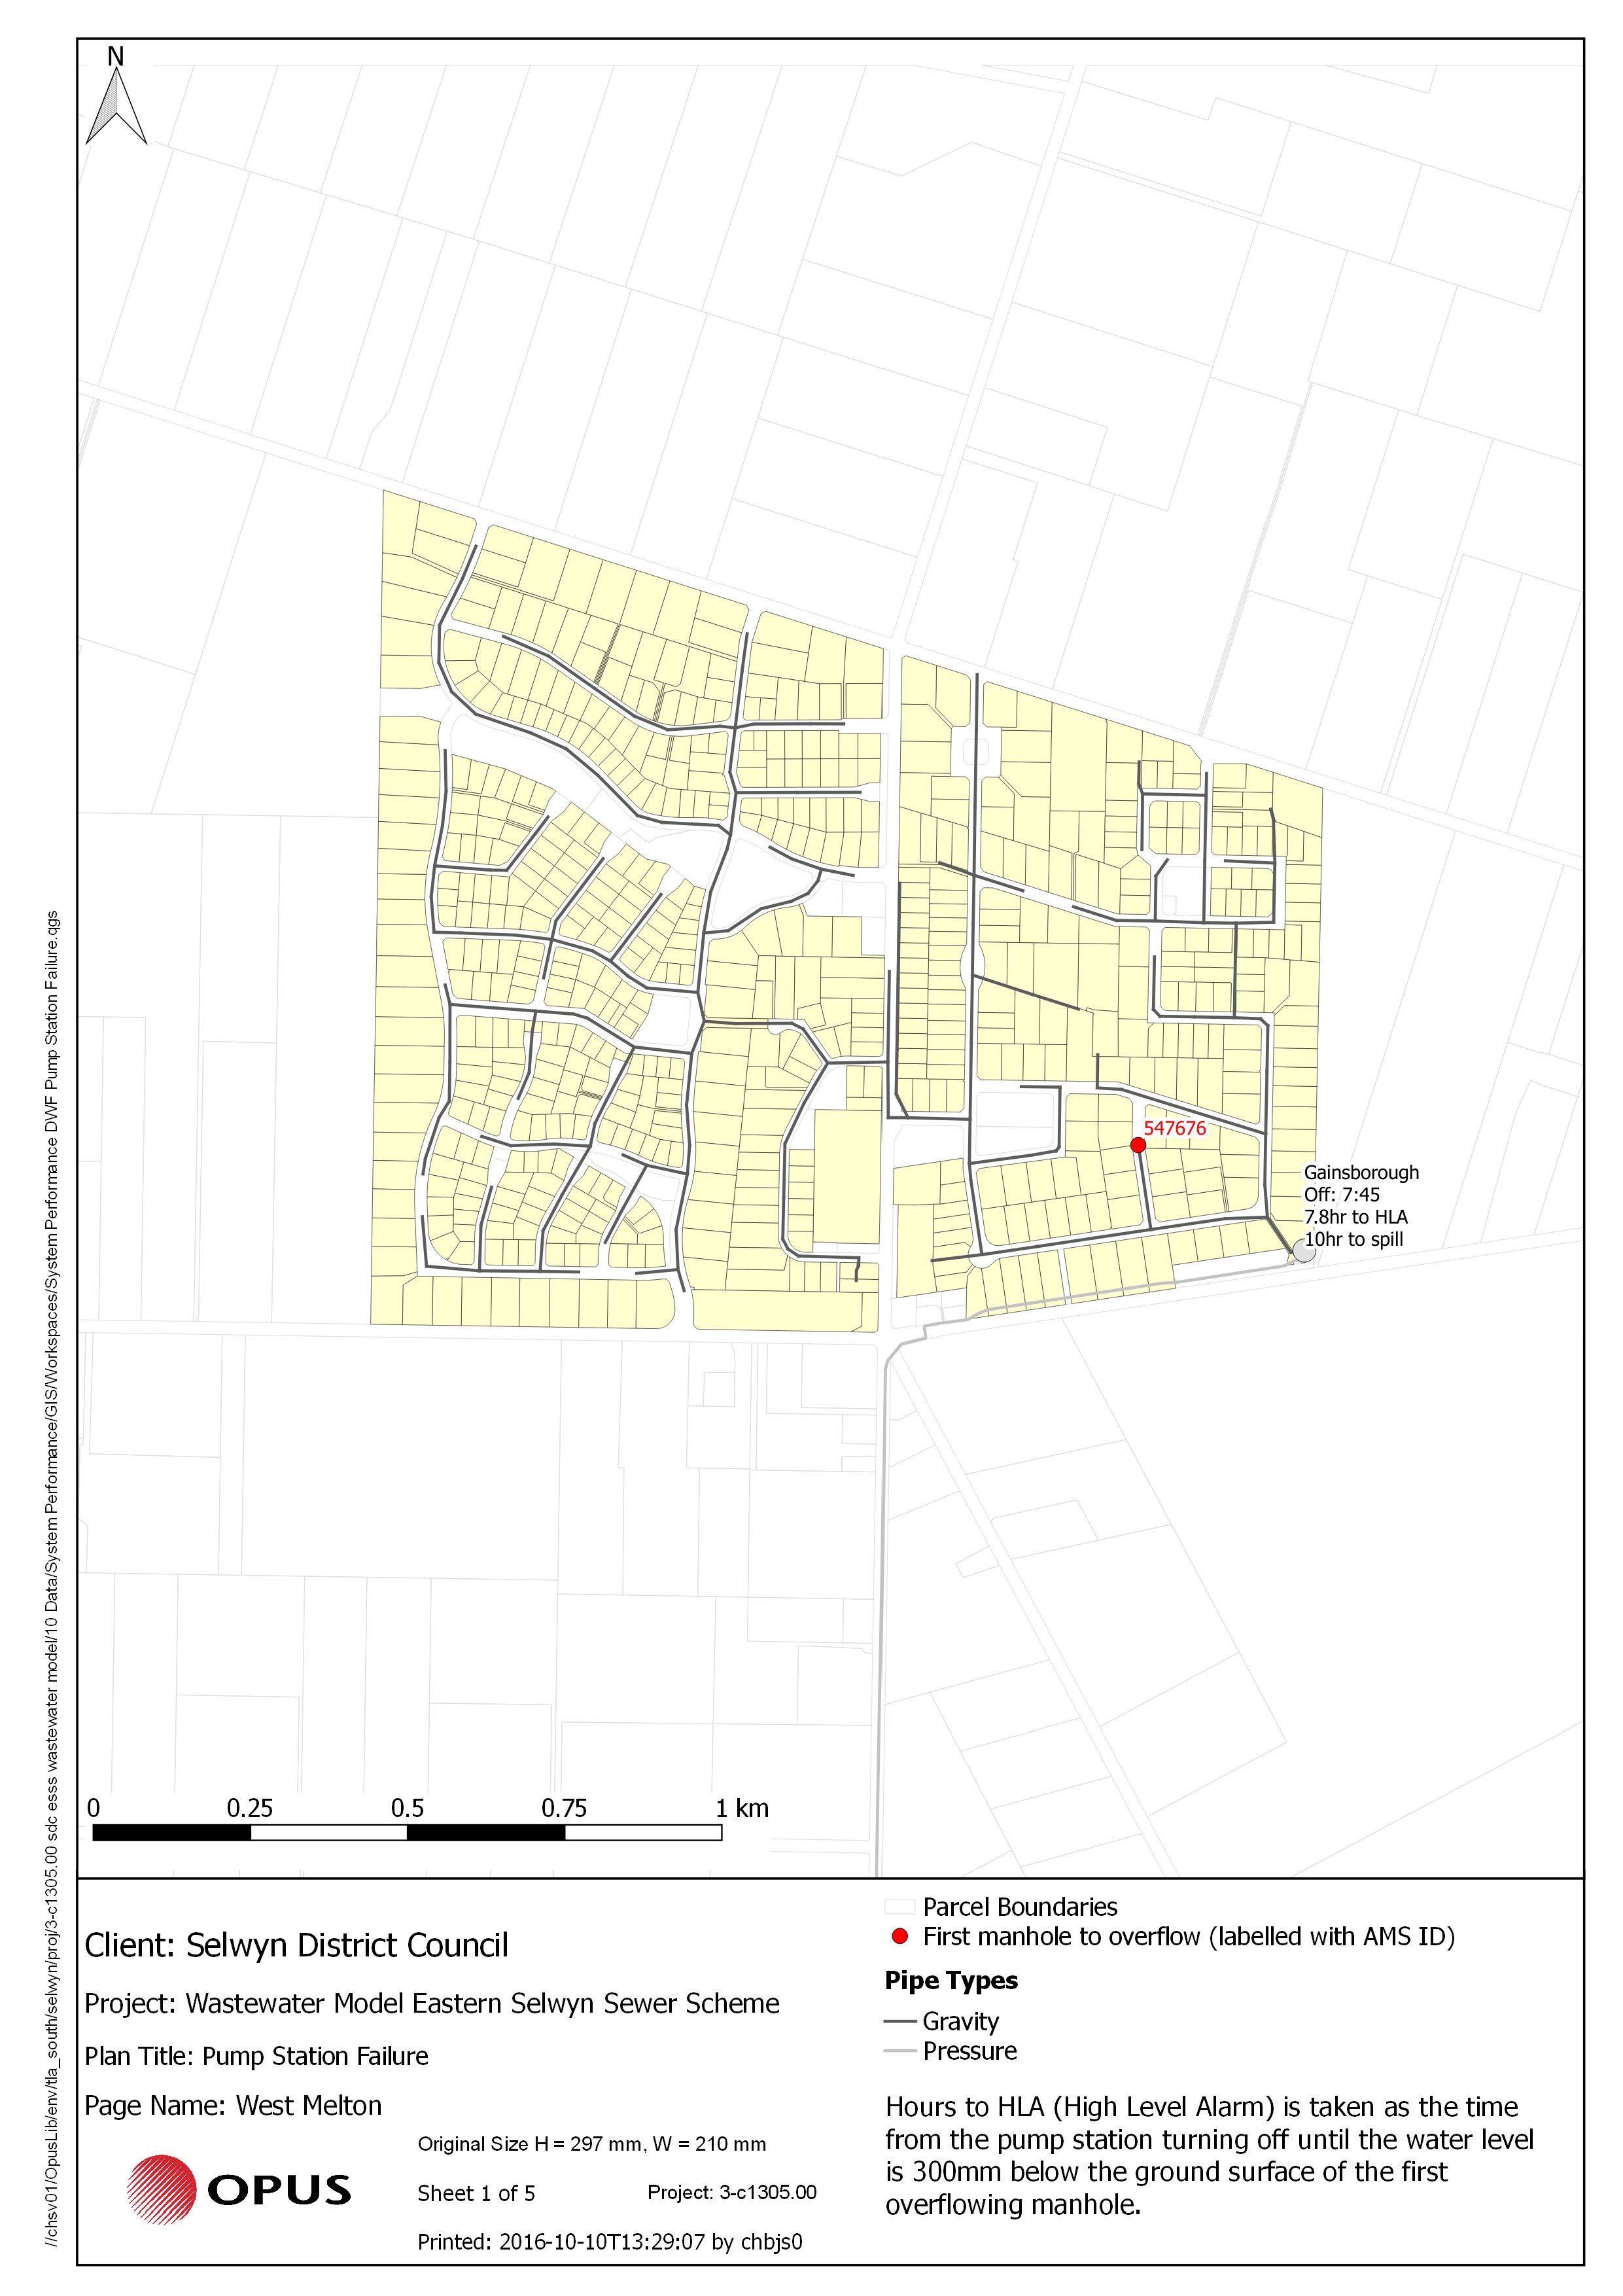
Figure 18‑3 Pump Station Failure Map
18.4 System Capacity
The scheme is currently within system capacity. Future development will require special assessment. Refer to Section 18.6.3, Design, for further information.
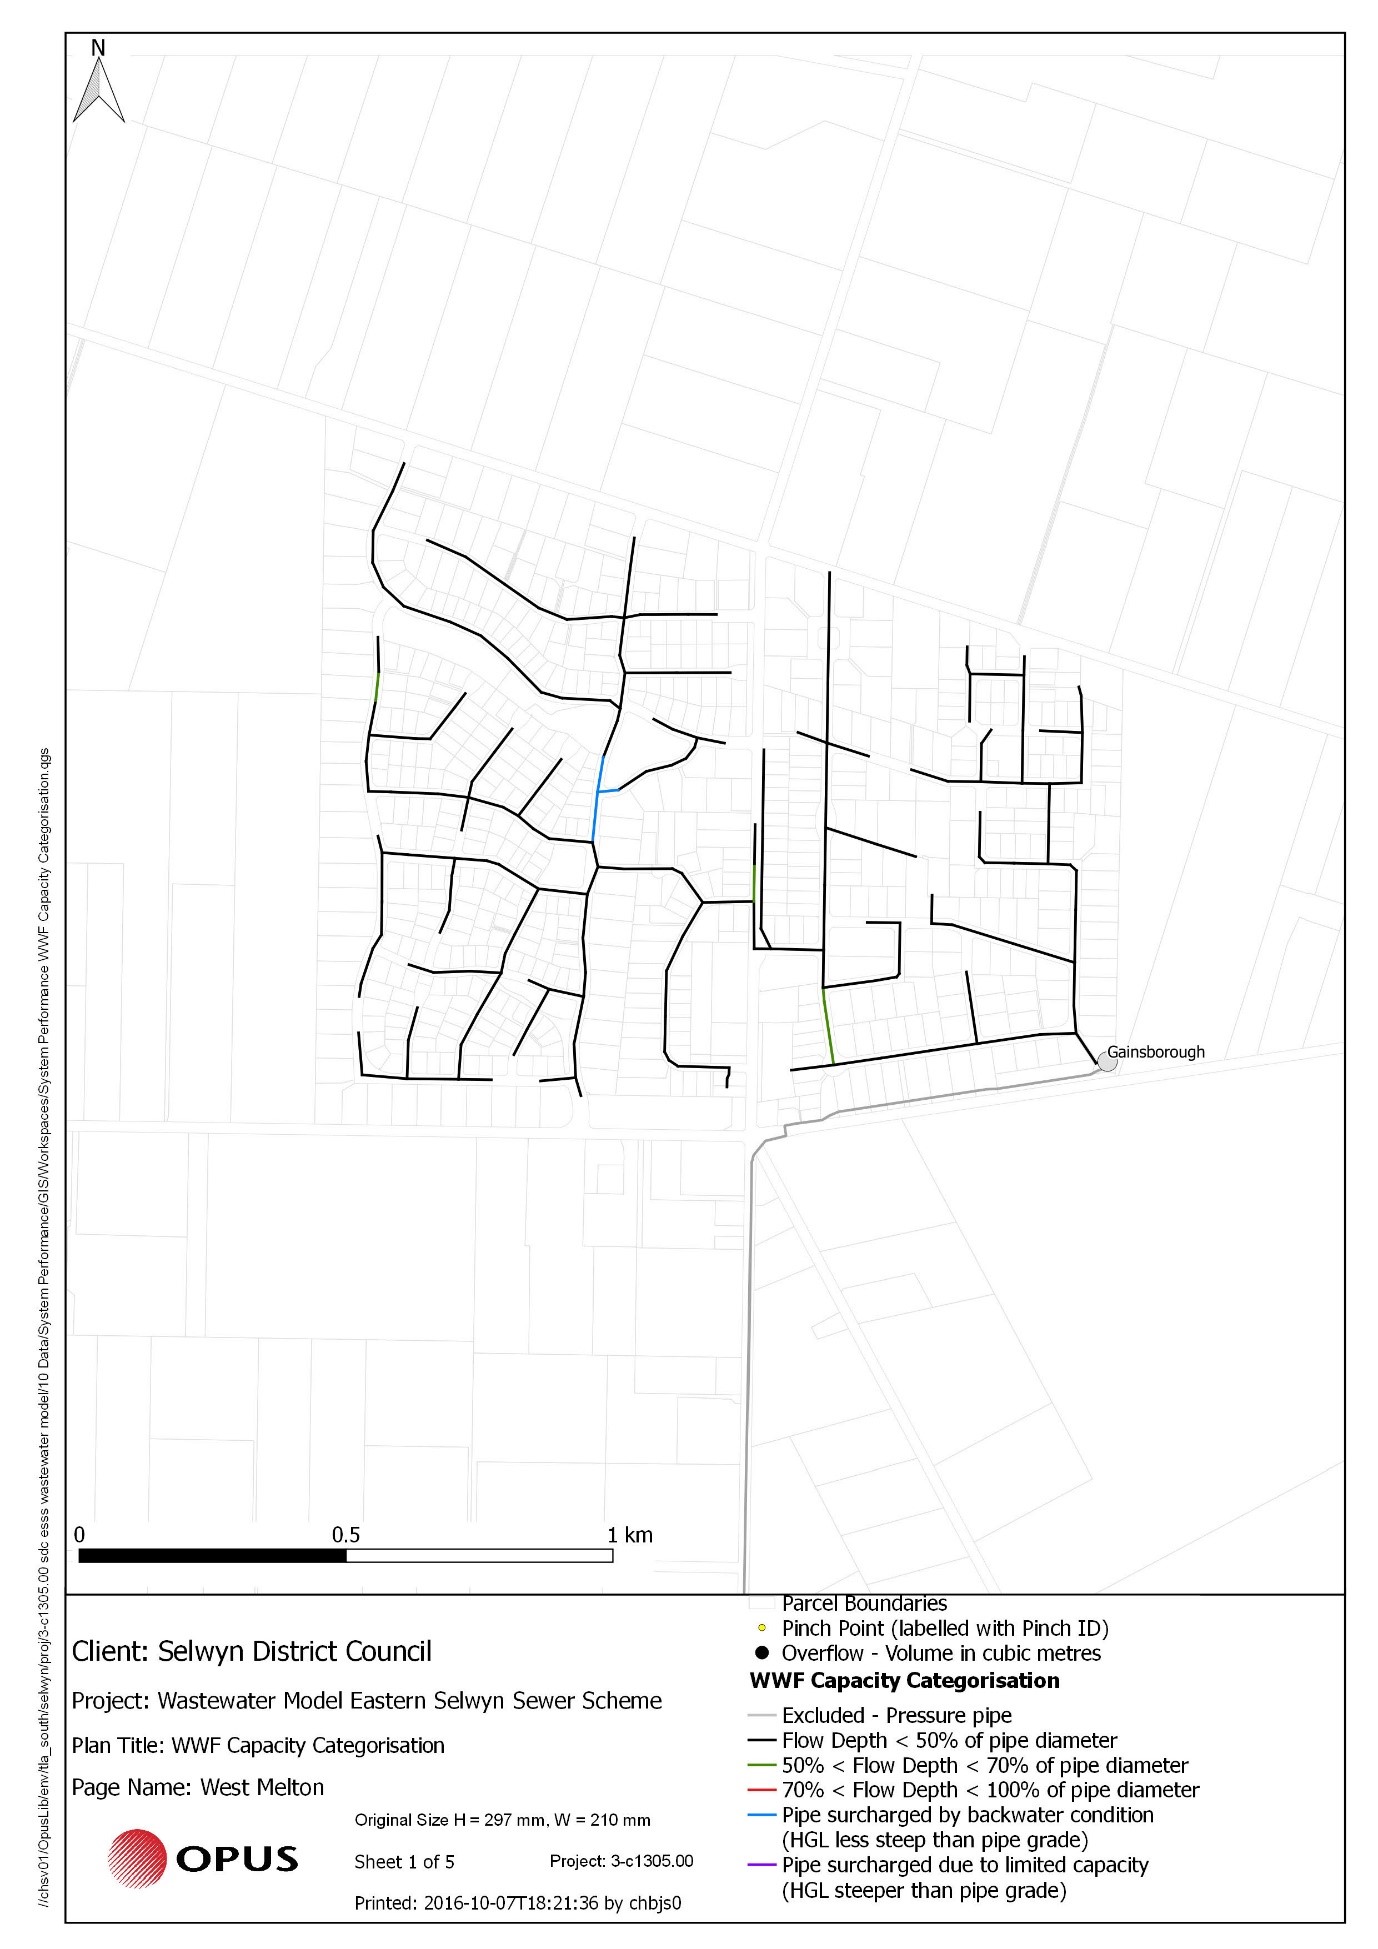
Figure 18‑4 Wet Weather Flow Capacity Map
18.5 Resource Consents
West Melton township is part of the ESSS scheme. Therefore, all wastewater is pumped to the Pines Treatment Plant located in Rolleston. The resource consents required for this treatment plant are in the ESSS section of this plan.
18.6 Scheme Assets
A summary of the assets within this scheme is outlined in this section.
18.6.1 Reticulation Overview
A summary of material and diameter for pipes is shown below in Figure 18‑5 and Figure 18‑6.
Figure 18‑5 Pipe Material – West Melton
Figure 18‑6 Pipe Diameter – West Melton
18.6.2 Treatment and Disposal
No treatment is carried out with all sewage pumped to the Rolleston network.
18.6.3 Design
The scheme was installed by developers following rejection of land based treatment. The critical constraint is where PE rising main discharges to the gravity sewer to Rolleston.
The system has been designed and constructed to serve approximately 730 residential properties.
The limitation of the system as designed are:
- Rising main capacity of 44l/s (Design)
- Gravity main (225mmPE) capacity of 26 l/s (Design)
Future additional capacity up to 1000 households could be provided following capacity upgrades.
18.6.4 Pump Stations
The specifications of the pumps are outlined in Table 18‑2 below.
Pump stations where the standby / assist pump is predicted to start have been highlighted in
yellow and
red for those that experience a peak wet weather response.
Yellow Pumps are can convey the peak flow without backing up the system
Red Pumps are unable to convey the peak flow causing the system to back up
Table 18‑2 Pump Station Overview
| West Melton (S) Gainsborough PS | 3300Ø | 2 | Flygt 3202 180 HT452 | 52-59 | 62 | 3.3 | 8.3 | 8.3 |
Table 18‑3 Pump Station Storage Time Analysis
| West Melton (S) Gainsborough PS | Main Pump | 7.8 | 10.0 | 547676 |
18.6.5 Rising Mains
Table 18‑4 Rising Main Overview
| West Melton (S) Gainsborough PS | West Melton | 8,088 | 248.3 | 3.3 | 1.9 | 8.9 | 10.8 | 325 | - |
18.7 Operational Management
The wastewater schemes are operated and maintained under the maintenance contract as follows:
- Contract 1241: Water Services Contract. Contract is with SICON who undertakes investigations, conditions inspections, proactive and reactive maintenance and minor asset renewals.
Wastewater sampling is completed under an agreement with Food and Health Ltd as required.
18.8 Photos of Main Assets
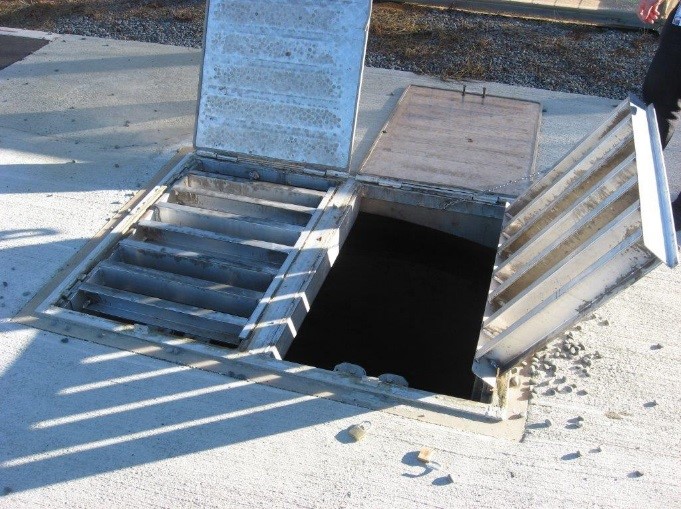
Photo 1 - Wet Well
18.9 Risk Assessment
A risk assessment has been undertaken for the West Melton scheme. The key output from the risk assessment is the identification of any extreme and high risks which need to be mitigated. In order to mitigate these risks they have been included and budgeted for in the projects within this LTP. There were no risks identified for this scheme.
18.10 Asset Valuation Details
The total replacement value of assets within the West Melton Scheme is $10,661,568 as detailed in Table 18‑5 below. The majority of value is made up of pipes.
Table 18‑5 Replacement Value, West Melton
Plant and Equipment
| $216,813
|
Wastewater Reticulation
| Chamber | $113,524
|
| Lateral | $2,721,014
|
| Manhole | $1,744,794
|
| Pipe | $5,794,429
|
| Valve | $70,993
|
18.11 Renewals
The renewal profile has been taken from the 2019 5 Waters Valuation. A graph showing the renewals for this scheme is shown by Figure 18‑7 below.
Figure 18‑7 West Melton Wastewater Renewal Profile
18.12 Critical Assets
The criticality model for West Melton has been updated for the 2021 AcMP. The methodology of the criticality model can be found in 5Waters Activity Management Plan: Volume 1 and it provides details of how the criticality has been calculated for the reticulation assets. Table 18‑6 and Figure 18‑8 below shows the calculated criticality for all of the assets within this scheme that have a recorded known length.
Table 18‑6 Length of Assets per Criticality Level
5
| Low | 24,289
|
4
| Medium-Low | 1,371
|
3
| Medium | 1,710
|
2
| Medium-High | 170
|
1
| High | 0
|
18.13 Asset Condition
The asset condition model was run for West Melton in 2021. The methodology of the model can be found in 5Waters Activity Management Plan: Volume 1 and it provides details of how the model has been calculated for the reticulation assets (particularly pipes). Figure 18‑9 below shows the level of asset condition for all of the assets within this scheme that have a recorded known condition.
Table 18‑7 provides a description of the condition rating used within the condition model.
Table 18-7 Asset Condition Grading
| 1.0 | Excellent |
| 2.0 | Good |
| 3.0 | Moderate |
| 4.0 | Poor |
| 5.0+ | Fail |
18.14 Funding Program
The 10 year budgets for West Melton are shown by Table 18‑8. Budgets are split into expenditure, renewals, projects and capital projects. Expenditure and renewals have been reported on a district-wide basis in Volume 1.
All figures are ($) not adjusted for CPI “inflation". They are calculated on historical data, and population growth where relevant.
Table 18‑8 West Melton Budget Summary
| 2021/2022 | $50,000
| $56,000
|
| 2022/2023 | -
| $36,000
|
| 2023/2024 | -
| $1,000,000
|
| 2024/2025 | -
| -
|
| 2025/2026 | -
| -
|
| 2026/2027 | -
| -
|
2027/2028
| -
| -
|
2028/2029
| -
| -
|
2029/2030
| -
| -
|
2030/2031
| -
| -
|
|
Total | $50,000
| $1,092,000
|
An explanation of the categories within the budgets are as follows below:
- Expenditure consists of operation and maintenance costs;
- Renewals are replacement of assets which are nearing or exceeded their useful life;
- Projects are investigations, decisions and planning activities which exclude capital works; and
- Capital projects are activities involving physical works.
The list of district wide projects can be found in 5Waters Activity Management Plan: Volume 1.
Table 18-9 Key Projects
Capital Projects
| -
| Relocate pump station to edge of stormwater basin
| -
| -
| $1,000,000
| -
| 100% LoS
|
Capital Projects
| -
| Gainsborough pump station pump upgrades
| $36,000
| $36,000
| -
| -
| TBC
|
Capital Projects
| -
| Shift air valve off WM Road
| $20,000
| -
| -
| -
| 100% LoS
|
Projects
| -
| Design for relocation of pump station to edge of stormwater basin
| $50,000
| -
| -
| -
| 100% LoS
|
* LoS refers to Level of Service; G refers to Growth
<<
5-Waters-Volume-3-Wastewater


