<<
5-Waters-Volume-3-Wastewater
14 Southbridge Wastewater Scheme
14.1 Scheme Summary
Estimated Population Served
| 1,216
|
Scheme Coverage (1 Jan 2021)
| Full Charges | 327
|
| Half Charges | 84
|
| >1 Charges | 8
|
System Components
| Piped (m) | 23,410
|
| Manholes (No.) | 105
|
| Pump Stations (No.) | 1
|
| Treatment | N/A (to Ellesmere STP) |
| Disposal | N/A (to Ellesmere STP) |
| History | Original scheme installation date | 2004 |
Value ($)
| Replacement Cost | $9,412,187
|
| Depreciated Replacement Cost | $7,993,288
|
Financial
| Operator cost (scheduled and reactive maintenance) per connection
| $165.61/connection
|
Demand
(1 Jan - 31 Dec 2020)
| Annually (m3) | 58,134
|
| Average daily (m3) | 159
|
| Peak daily (m3) | 290
|
| Minimum daily (m3) | 2.2
|
| Infiltration | Yes
|
| Sustainability | Ultimate discharge point | To Leeston WWTP |
14.2 Key Issues
The following key issues are associated with the Southbridge Wastewater Scheme. A list of district wide issues are located in 5Waters Activity Management Plan: Volume 1.
Table 14‑1 Southbridge Scheme Issues
| Potential for future infiltration issues as scheme ages | Monitor groundwater levels and daily flows. Investigate issues as required |
14.3 Overview & History
Southbridge is connected to the Leeston WWTP. This was approved in 2003 with construction starting in early 2004. The Southbridge sewerage scheme was commissioned in December 2004. Prior to this individual properties were services by septic tank.
The majority of the township is reticulated by gravity sewers but the low density outlying areas of the township are serviced by a pressurised sewerage system. There are 5 flush manholes located within the system that need to be operated on a weekly basis. Scour valves are located on 4 of the pressure mains that are operated on an “as required" basis.
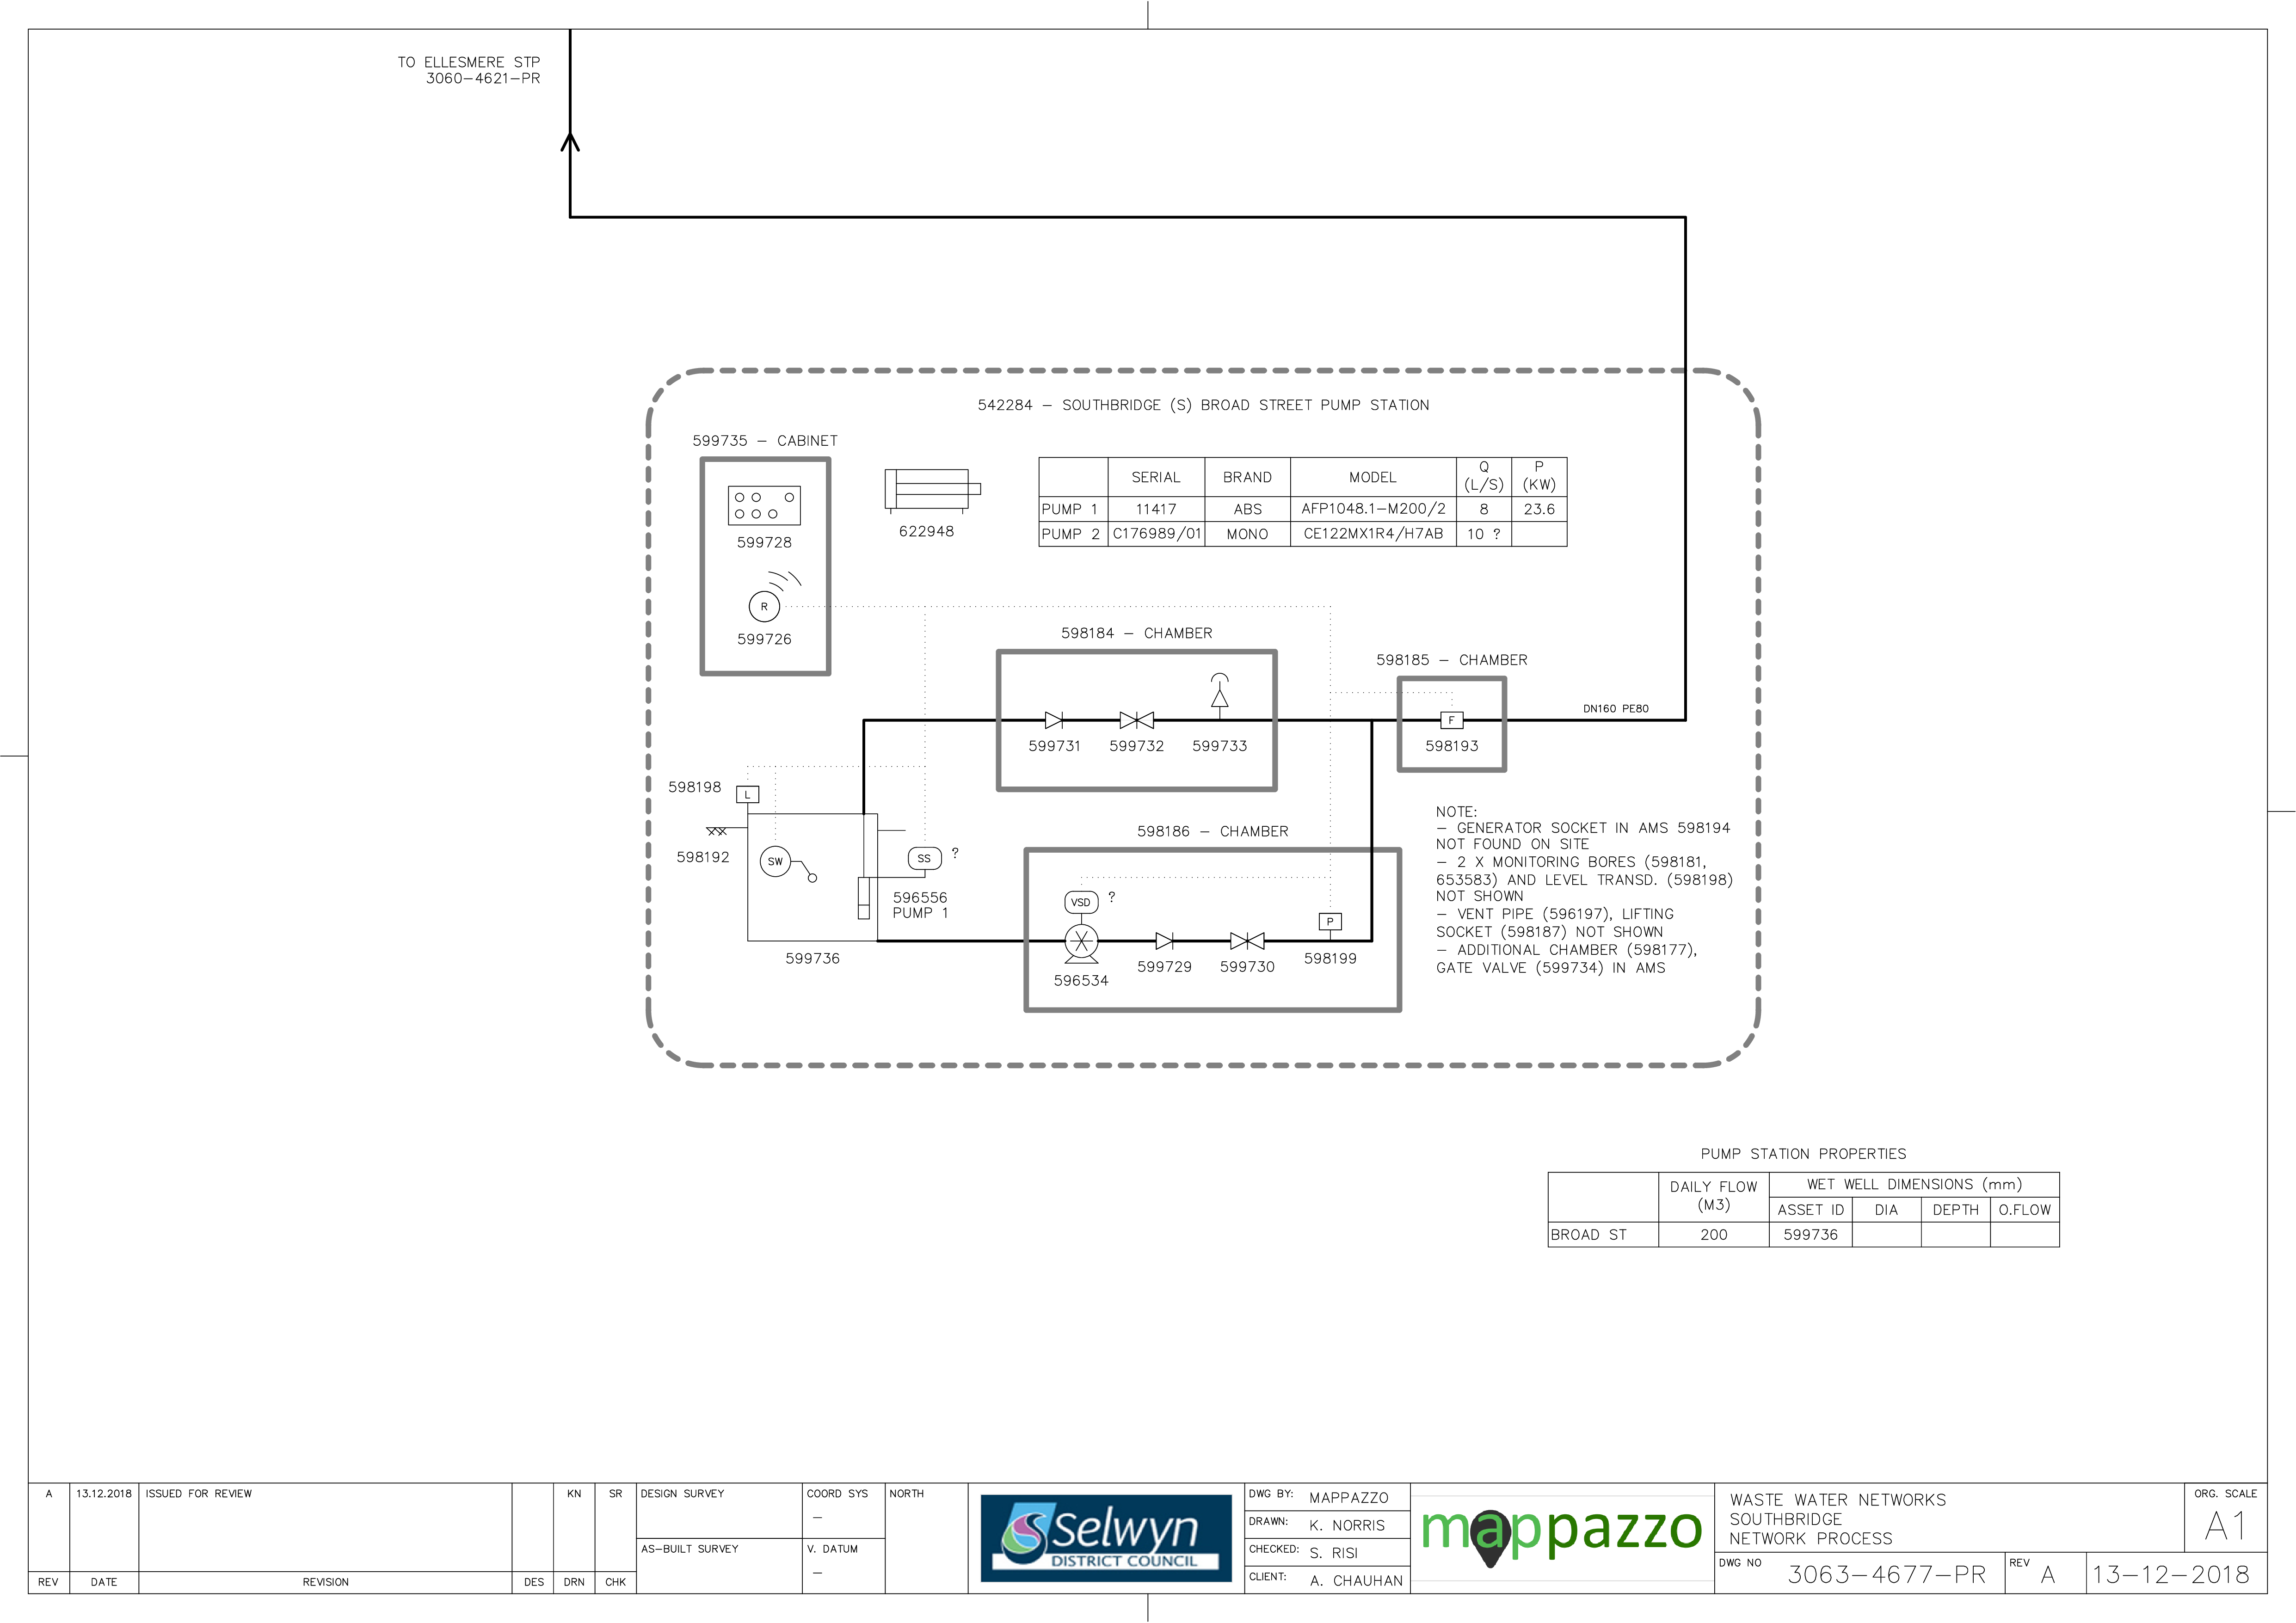
Figure 14‑2 Scheme Schematic
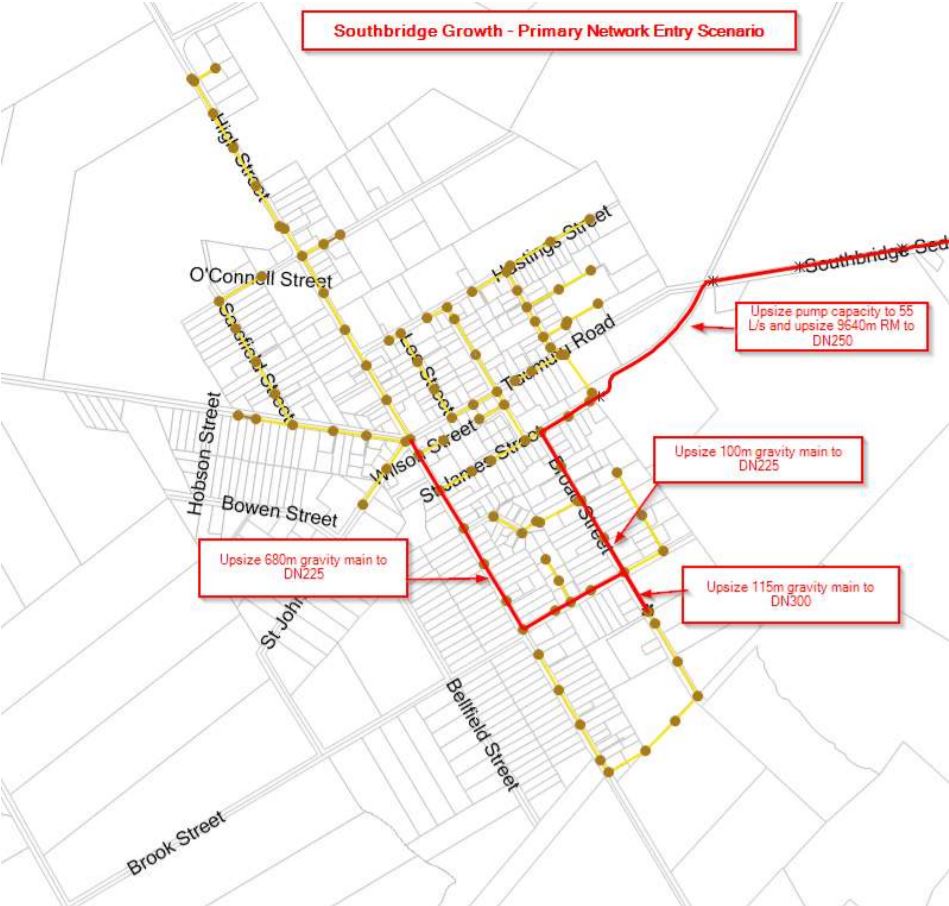
Figure 14‑3 Southbridge Master Plan
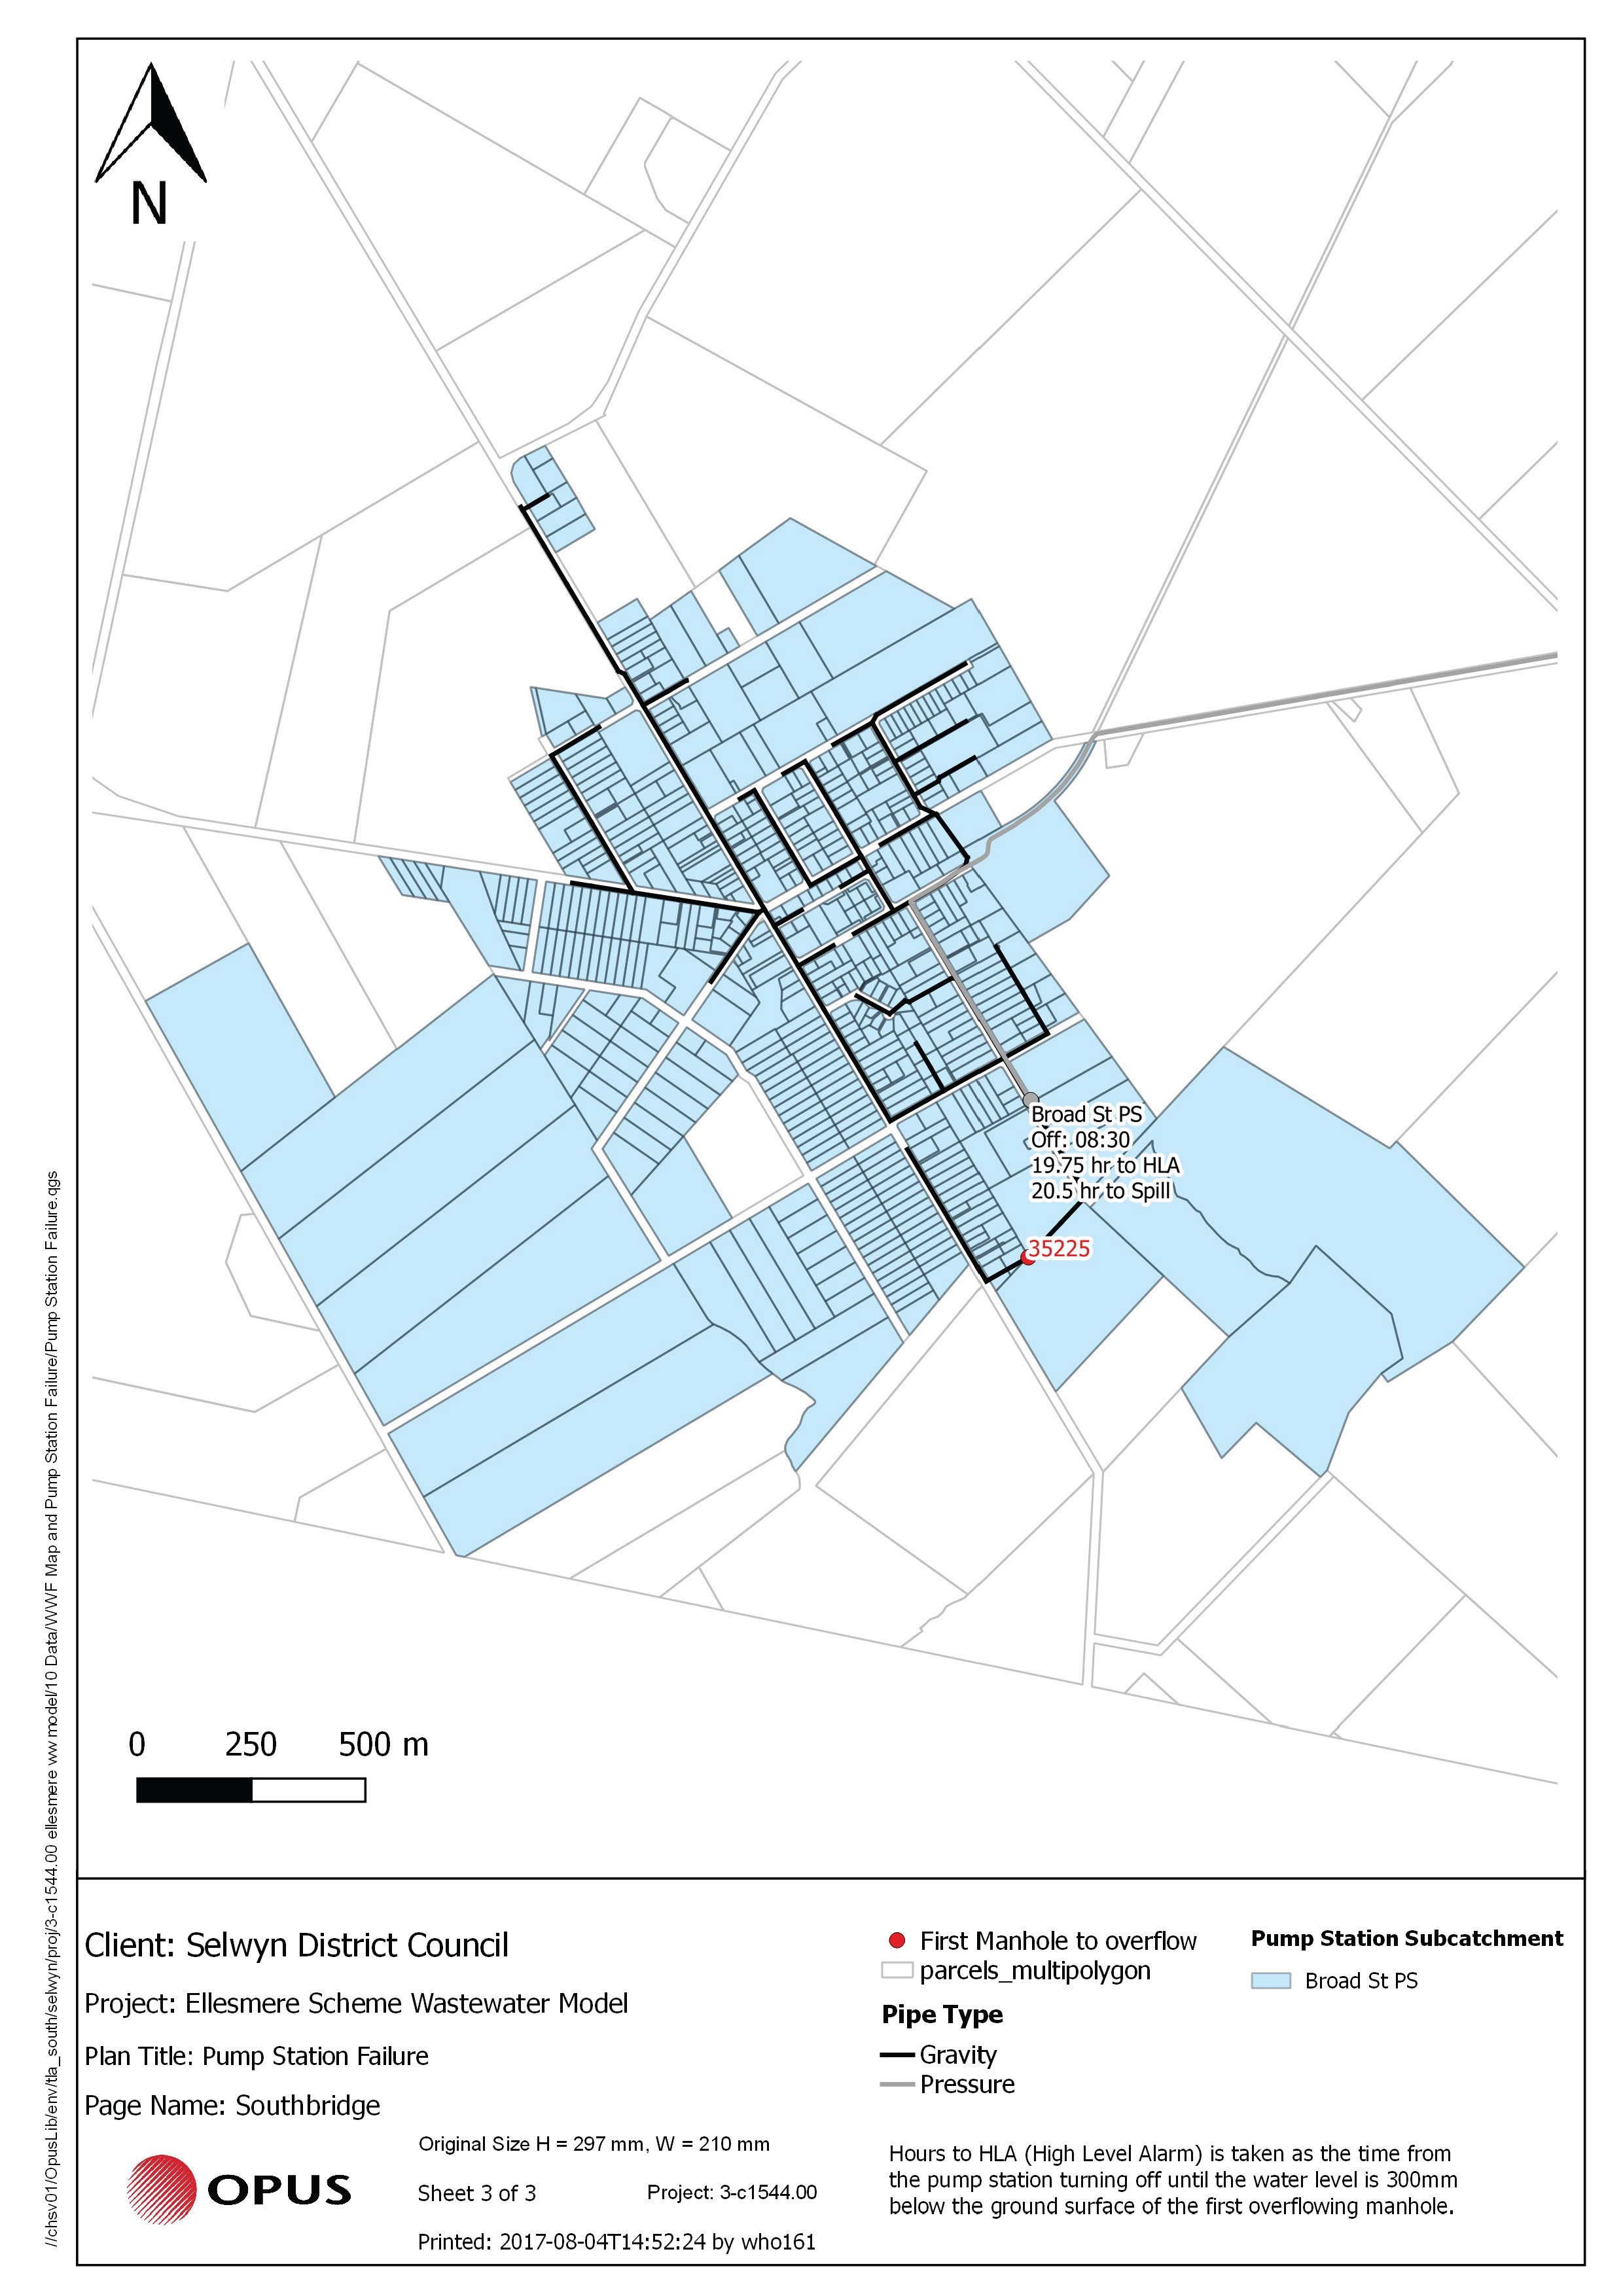
Figure 14‑4 Pump Station Failure Map
14.4 System Capacity
The scheme is operating within the maximum design limits occasionally reaching the design flow maximum for the current population.
A small increase of capacity could potentially be achieved by duplicating the higher capacity flush pump, allowing up to a total of 466 properties to be serviced by the pump station.
Refer section 14.6.3 and the Master Plan in Figure 14-3
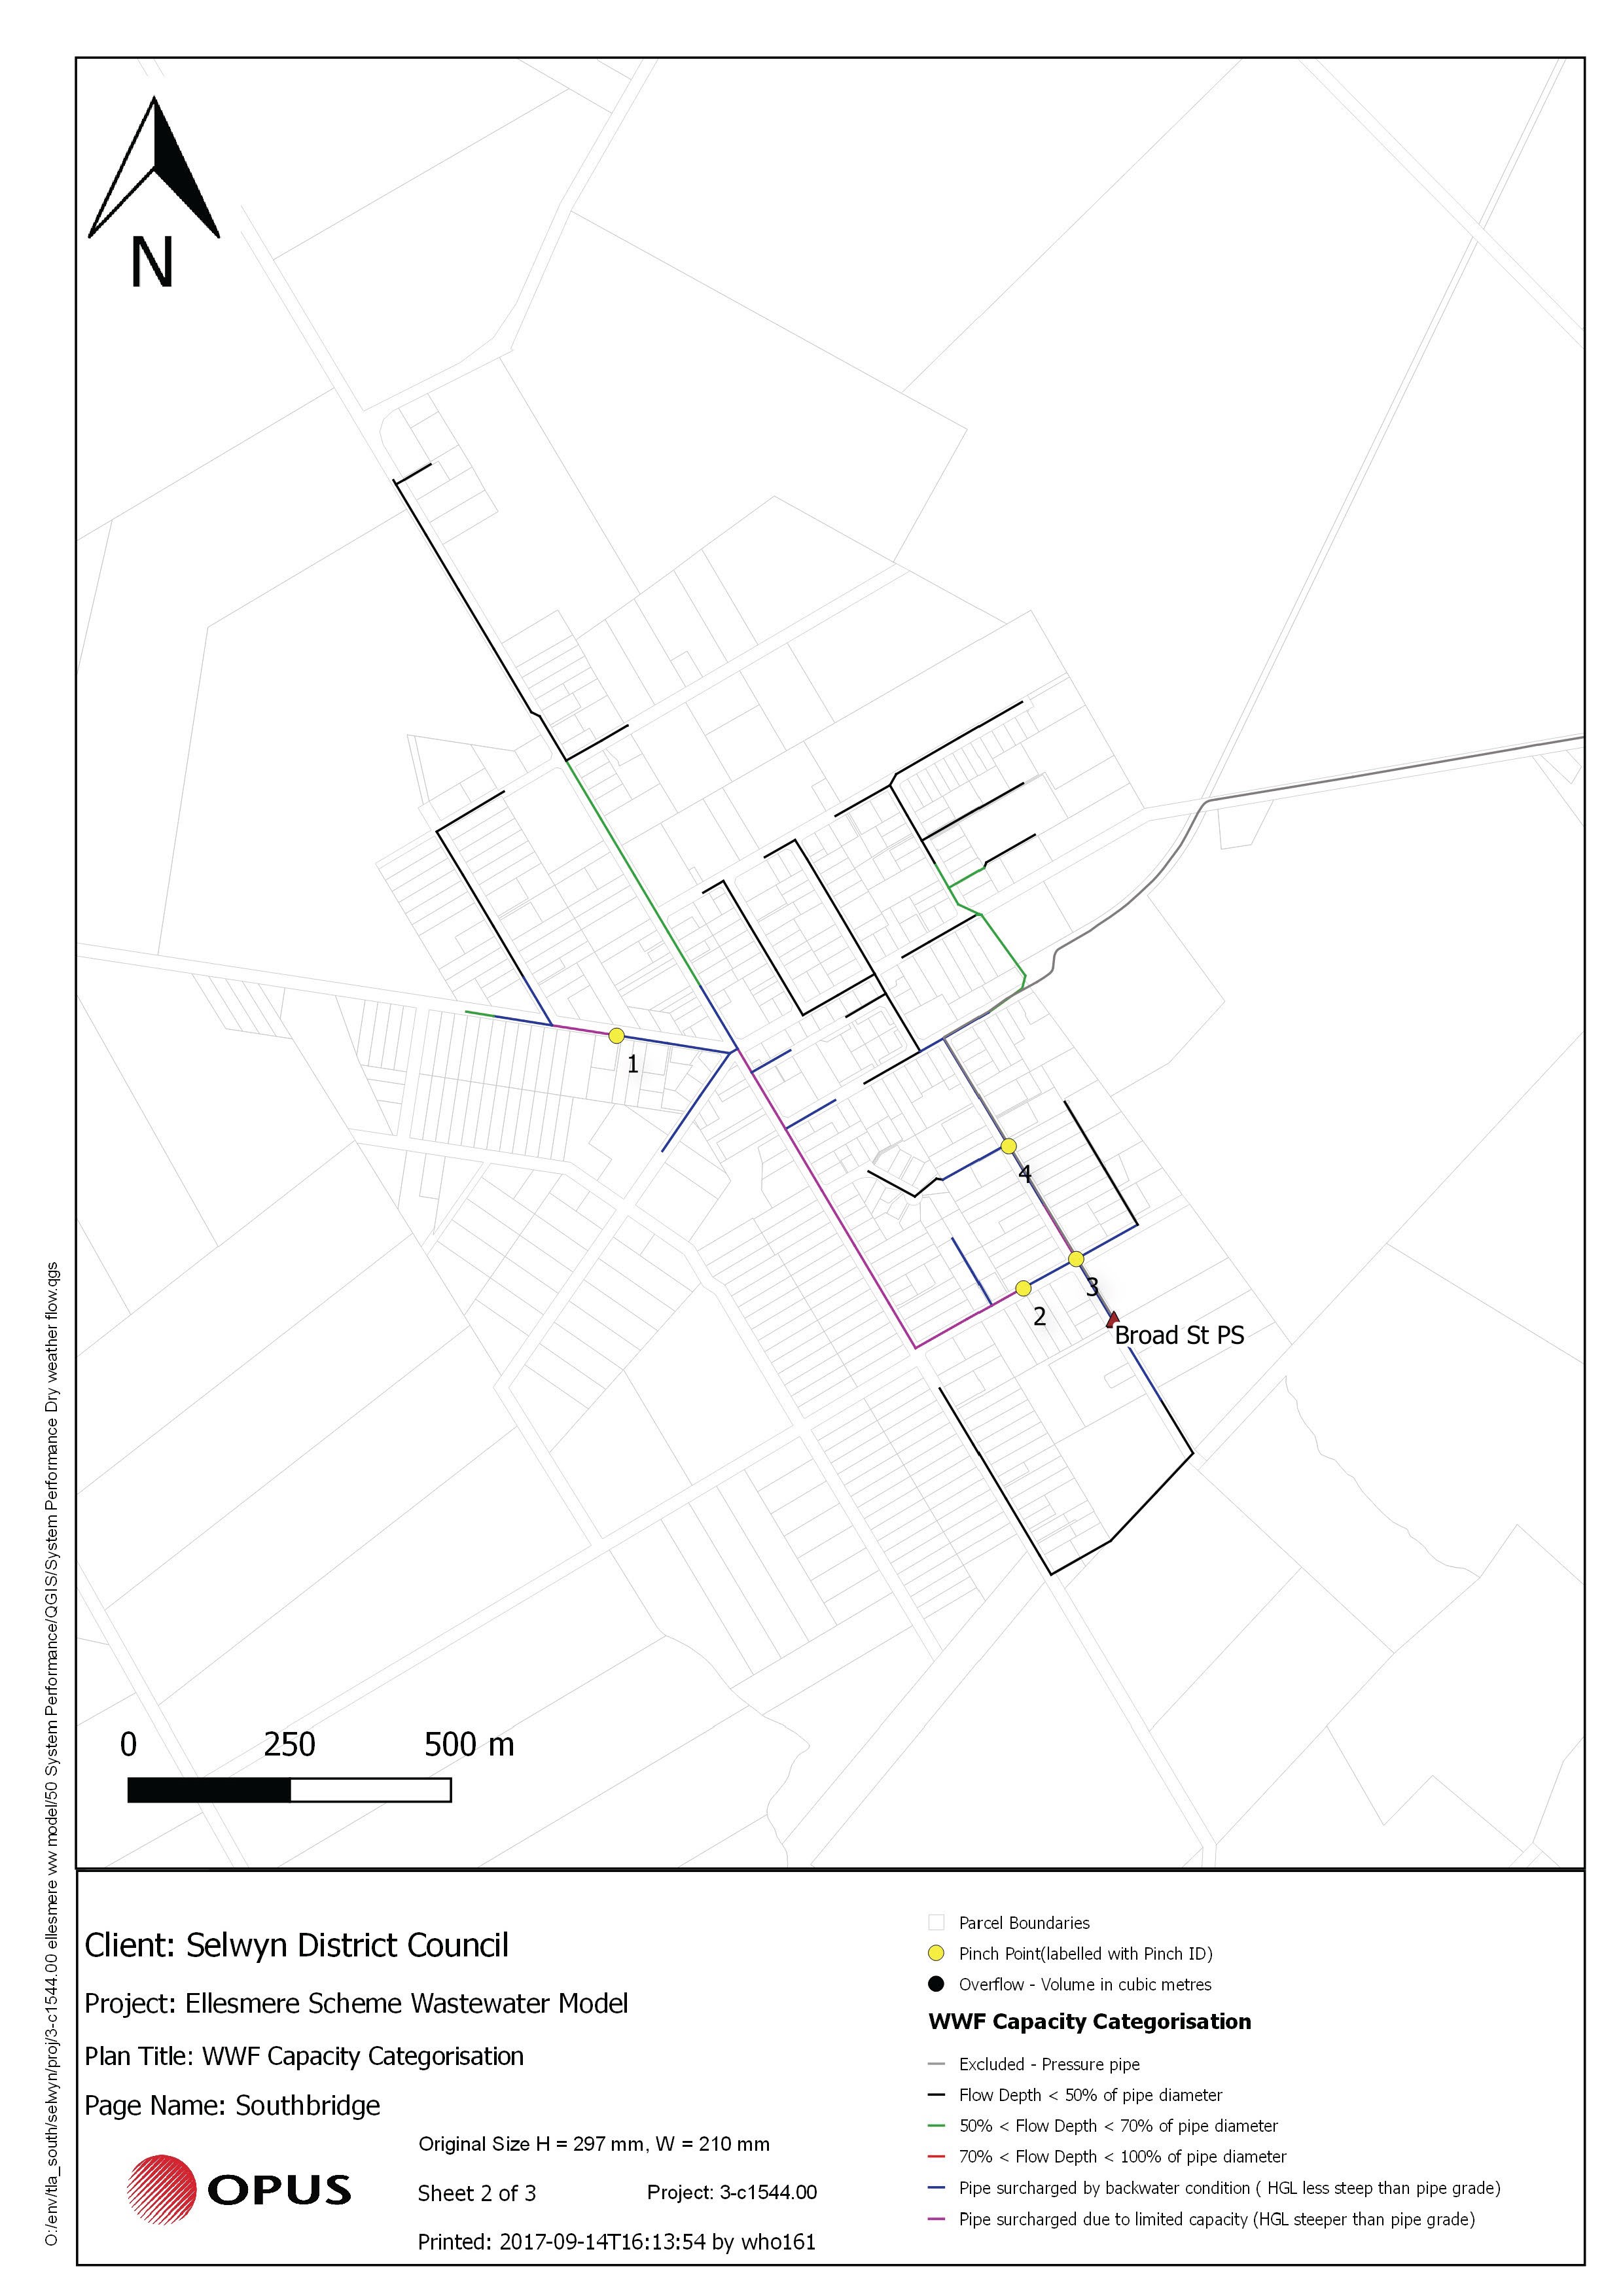
Figure 14‑5 Wet Weather Flow Capacity Map
14.5 Resource Consents
Southbridge township is part of the Ellesmere scheme. Therefore, all wastewater is pumped to the Ellesmere Treatment Plant located in Leeston. The resource consents required for this treatment plant are in the Ellesmere section of this plan.
14.6 Scheme Assets
A summary of the assets within this scheme is outlined in this section.
14.6.1 Reticulation Overview
A summary of material and diameter for pipes is shown in Figure 14‑6 and Figure 14‑7.
Figure 14‑6 Pipe Material – Southbridge
Figure 14‑7 Pipe Diameter – Southbridge
14.6.2 Treatment and Disposal
All wastewater is pumped to Leeston WWTP.
14.6.3 Pump Stations
There is one pump station in Southbridge, shown in Table 14‑2 below.
Table 14‑2 Pump Stations
| Southbridge (S) Broad St | 2300 Ø | 4.2 | 5 | 2 | ABS AFP1048
Mono CE122 | 11 | 10.4 | 2.2 | 5.6 |
Table 14‑3 Pump Station Storage Time Analysis
| Southbridge (S) Broad St | Southbridge | 9:00
| 8:30 | 23 | 25.5 | 20.4 | 35225 |
The duty pump capacity is 12.2 L/s @ 490 kPa. The flush pump can deliver 16 L/s @ 780 kPa and operates every 14 pump cycles or after 12 hours.
The current dry weather flow is well in excess of the average dry weather flow assumed for design. This is likely to be associated with groundwater infiltration given the high ground water table. However, the actual peaking factor is less than that assumed for design so the peak flow per connection is less than that adopted for design purposes.
14.6.4 Rising Mains
Southbridge (S)
Broad St to Lake Road Rising Main | PE80 | PN10 | 135 | |
14.7 Operational Management
The wastewater schemes are operated and maintained under the maintenance contract as follows:
-
Contract 1241: Water Services Contract. Contract is with SICON who undertakes investigations, conditions inspections, proactive and reactive maintenance and minor asset renewals.
Wastewater sampling is completed under an agreement with Food and Health Ltd as required.
14.8 Photos of Main Assets
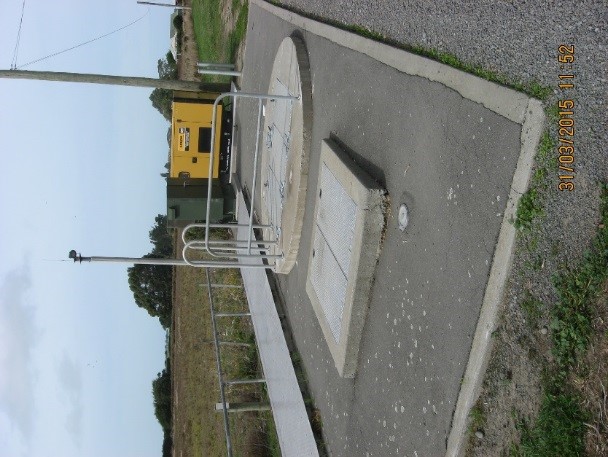
Photo 1 –
Broad Street Pump Station
14.9 Risk Assessment
A risk assessment has been undertaken for the Southbridge scheme. The key output from the risk assessment is the identification of any extreme and high risks which need to be mitigated. In order to mitigate these risks they have been included and budgeted for in the projects within this LTP. There were no risks identified for this scheme.
14.10 Asset Valuation Details
The total replacement value of assets within the Southbridge Scheme is $9,412,187 as detailed in Table 14‑4 below.
Table 14‑4 Replacement Value, Southbridge
Plant and Equipment
| $215,175
|
Wastewater Reticulation
| Chamber | $387,926
|
| Lateral | $1,191,497
|
| Manhole | $840,477
|
| Pipe | $6,592,551
|
| Valve | $184,560
|
14.11 Renewals
The renewal profile has been taken from the 2019 5 Waters Valuation. A graph showing the renewals for this scheme are shown by Figure 14‑8 below.
Figure 14‑8 Southbridge Wastewater Renewal Profile
14.12 Critical Assets
The criticality model for Southbridge has been updated for the 2021 AcMP. The methodology of the criticality model can be found in 5Waters Activity Management Plan: Volume 1 and it provides details of how the criticality has been calculated for the reticulation assets. Table 14‑5 and Figure 14‑9 below show the calculated criticality for all of the assets within this scheme that have a recorded known length.
Table 14‑5 Length of Assets per Criticality Level
5
| Low | 11,848
|
4
| Medium-Low | 10,047
|
3
| Medium | 725
|
2
| Medium-High | 509
|
1
| High
| 0
|
14.13 Asset Condition
The asset condition model was run for Southbridge in 2021. The methodology of the model can be found in 5Waters Activity Management Plan: Volume 1 and it provides details of how the model has been calculated for the reticulation assets (particularly pipes). Figure 14‑10 below shows the level of asset condition for all of the assets within this scheme that have a recorded known condition.
Table 14‑6 provides a description of the condition rating used within the condition model.
Table 14‑6 Asset Condition Grading
| 1.0 | Excellent |
| 2.0 | Good |
| 3.0 | Moderate |
| 4.0 | Poor |
| 5.0+ | Fail |
14.14 Funding Program
The 10 year budgets for Southbridge are shown by Table 14‑7. Budgets are split into expenditure, renewals, projects and capital projects. Expenditure and renewals have been reported on a district-wide basis in Volume 1.
All figures are ($) not adjusted for CPI “inflation". They are calculated on historical data, and population growth where relevant.
Table 14‑7 Southbridge Budget Summary
| 2021/2022 | -
| -
|
| 2022/2023 | -
| -
|
| 2023/2024 | -
| $25,000
|
| 2024/2025 | -
| -
|
| 2025/2026 | -
| -
|
| 2026/2027 | -
| -
|
2027/2028
| -
| -
|
2028/2029
| -
| -
|
2029/2030
| -
| -
|
2030/2031
| -
| -
|
| Total | -
| $25,000
|
An explanation of the categories within the budgets are as follows below:
- Expenditure consists of operation and maintenance costs;
- Renewals are replacement of assets which are nearing or exceeded their useful life;
- Projects are investigations, decisions and planning activities which exclude capital works; and
- Capital projects are activities involving physical works.
Table 14‑8 Key Projects
| Capital Projects | -
| Mono Upgrade | - | -
| $25,000
| -
| TBC
|
* LoS refers to Level of Service; G refers to Growth
The list of district wide projects can be found in 5Waters Activity Management Plan: Volume 1.
Discussion on Projects
Projects have been determined based on their:
- Relevance to the scheme
- Requirement to be completed under legislation
- Ability to bring the scheme up to or maintain the Level of Service required under council's Asset Management Policy.
Many projects are
jointly funded by more than one scheme and activity. Each scheme pays a pro-rata share only, equivalent to the number of connections.
Discussion on Capital and Projects
Where relevant, Capital (Levels of Service) and Capital (Growth) projects have been included in the scheme financial details.
Levels of Service Projects and growth splits have been provided to ensure the costs of population driven works are clear.
<<
5-Waters-Volume-3-Wastewater


