<<
5-Waters Volume 2 - Water Supplies
16 Prebbleton Water Supply
16.1 Scheme Summary
Estimated Population Served
| 4,655
|
Scheme Coverage (1 Jan 2021)
| Full Charges | 1,555
|
| Half Charges | 11
|
| >1 Charges | 39
|
System Components
| Bores/Intakes (No.) | 4
|
| Treatment/Disinfection | None |
| Reservoirs (No.) | 0 |
| Pump Stations (No.) | 2 Sites
|
| Piped (m) | 65,750
|
| History | Original scheme installation date | 1965 |
Value ($)
| Replacement Cost | $10,218,050
|
| Depreciated Replacement Cost | $7,698,363
|
| Financial | Operator cost (scheduled and reactive maintenance) per connection
| $107.67/connection
|
Demand (m3) (1 Jan – 31 Dec 2020)
| Average daily
| 1,993
|
Peak daily
| 4,631
|
| Minimum daily | 24.8
|
| Average daily per connection | 1.08
|
| Type of Supply | | High pressure and unrestricted
|
Target Pressure & Flow at boundary
| Pressure | >310kPa |
| Flow | >20L/min |
| Sustainability | Well Security | Secure |
16.2 Key Issues
The following key issues are associated with the Prebbleton water supply. A list of district wide issues are located in 5Waters Activity Management Plan: Volume 1.
Table 16‑1 Prebbleton Scheme Issues
| The high sand/silt component that was prevalent when the St Patricks well was first installed has been resolved by installation of turbidity (monitoring and flow control) meter in 2005/06 and stepped increase in peak demand over subsequent years. | Council will continue to monitor turbidity and manage a slow increase in water take to reduce the potential for turbid waters. |
| The Prebbleton Water Supply has a very high average yearly usage per property | Council has installed water meters on this scheme and will monitor water use of the first 3 years of this plan. |
| Based on projected growth the Prebbleton Water Supply will require additional supply capacity. | Council will monitor growth and associated demand to trigger installation of an additional source through the infrastructure plan.
|
Catchment management
| Council are investigating groundwater quality within the water supply protection zones, and working with ECan on this matter
|
Pressure zoning will be required within Prebbleton's reticulation network, as the town grows
| Council are planning to install more pressure monitoring devices within the reticulation network, and we are developing a Target Pressure Plan and Network Management Strategy
|
The water supply is becoming more vulnerable to contamination from backflow, because there are more commercial and irrigation sites in Prebbleton
| Council are underway with a district-wide backflow prevention project
|
The scheme has no ability to chlorinate if required in an emergency
| Council are planning for upgrades to the Prebbleton water supply to allow on-demand chlorination, if there is an emergency or transgression/contamination event.
|
16.3 Overview & History
The original Prebbleton water supply was installed in 1965 and is one of the older water supply systems within the District. Untreated groundwater is provided from four bores. Two of the bores are at the sites of the two original wells that were deepened because of elevated nitrate levels.
Prebbleton has undergone significant development over the last 12 years with a reticulated sewerage scheme installed from 1998. To service the increased population a new well was installed in 2003 (St Patricks Well) and additional reticulation installed to “ring main" the township. In 2017 a new deep bore was drilled at the location of the existing two original bores at the Tosswell Rd site.
The scheme has been developed to meet the New Zealand Fire Service Firefighting Water Supplies Code of Practice.
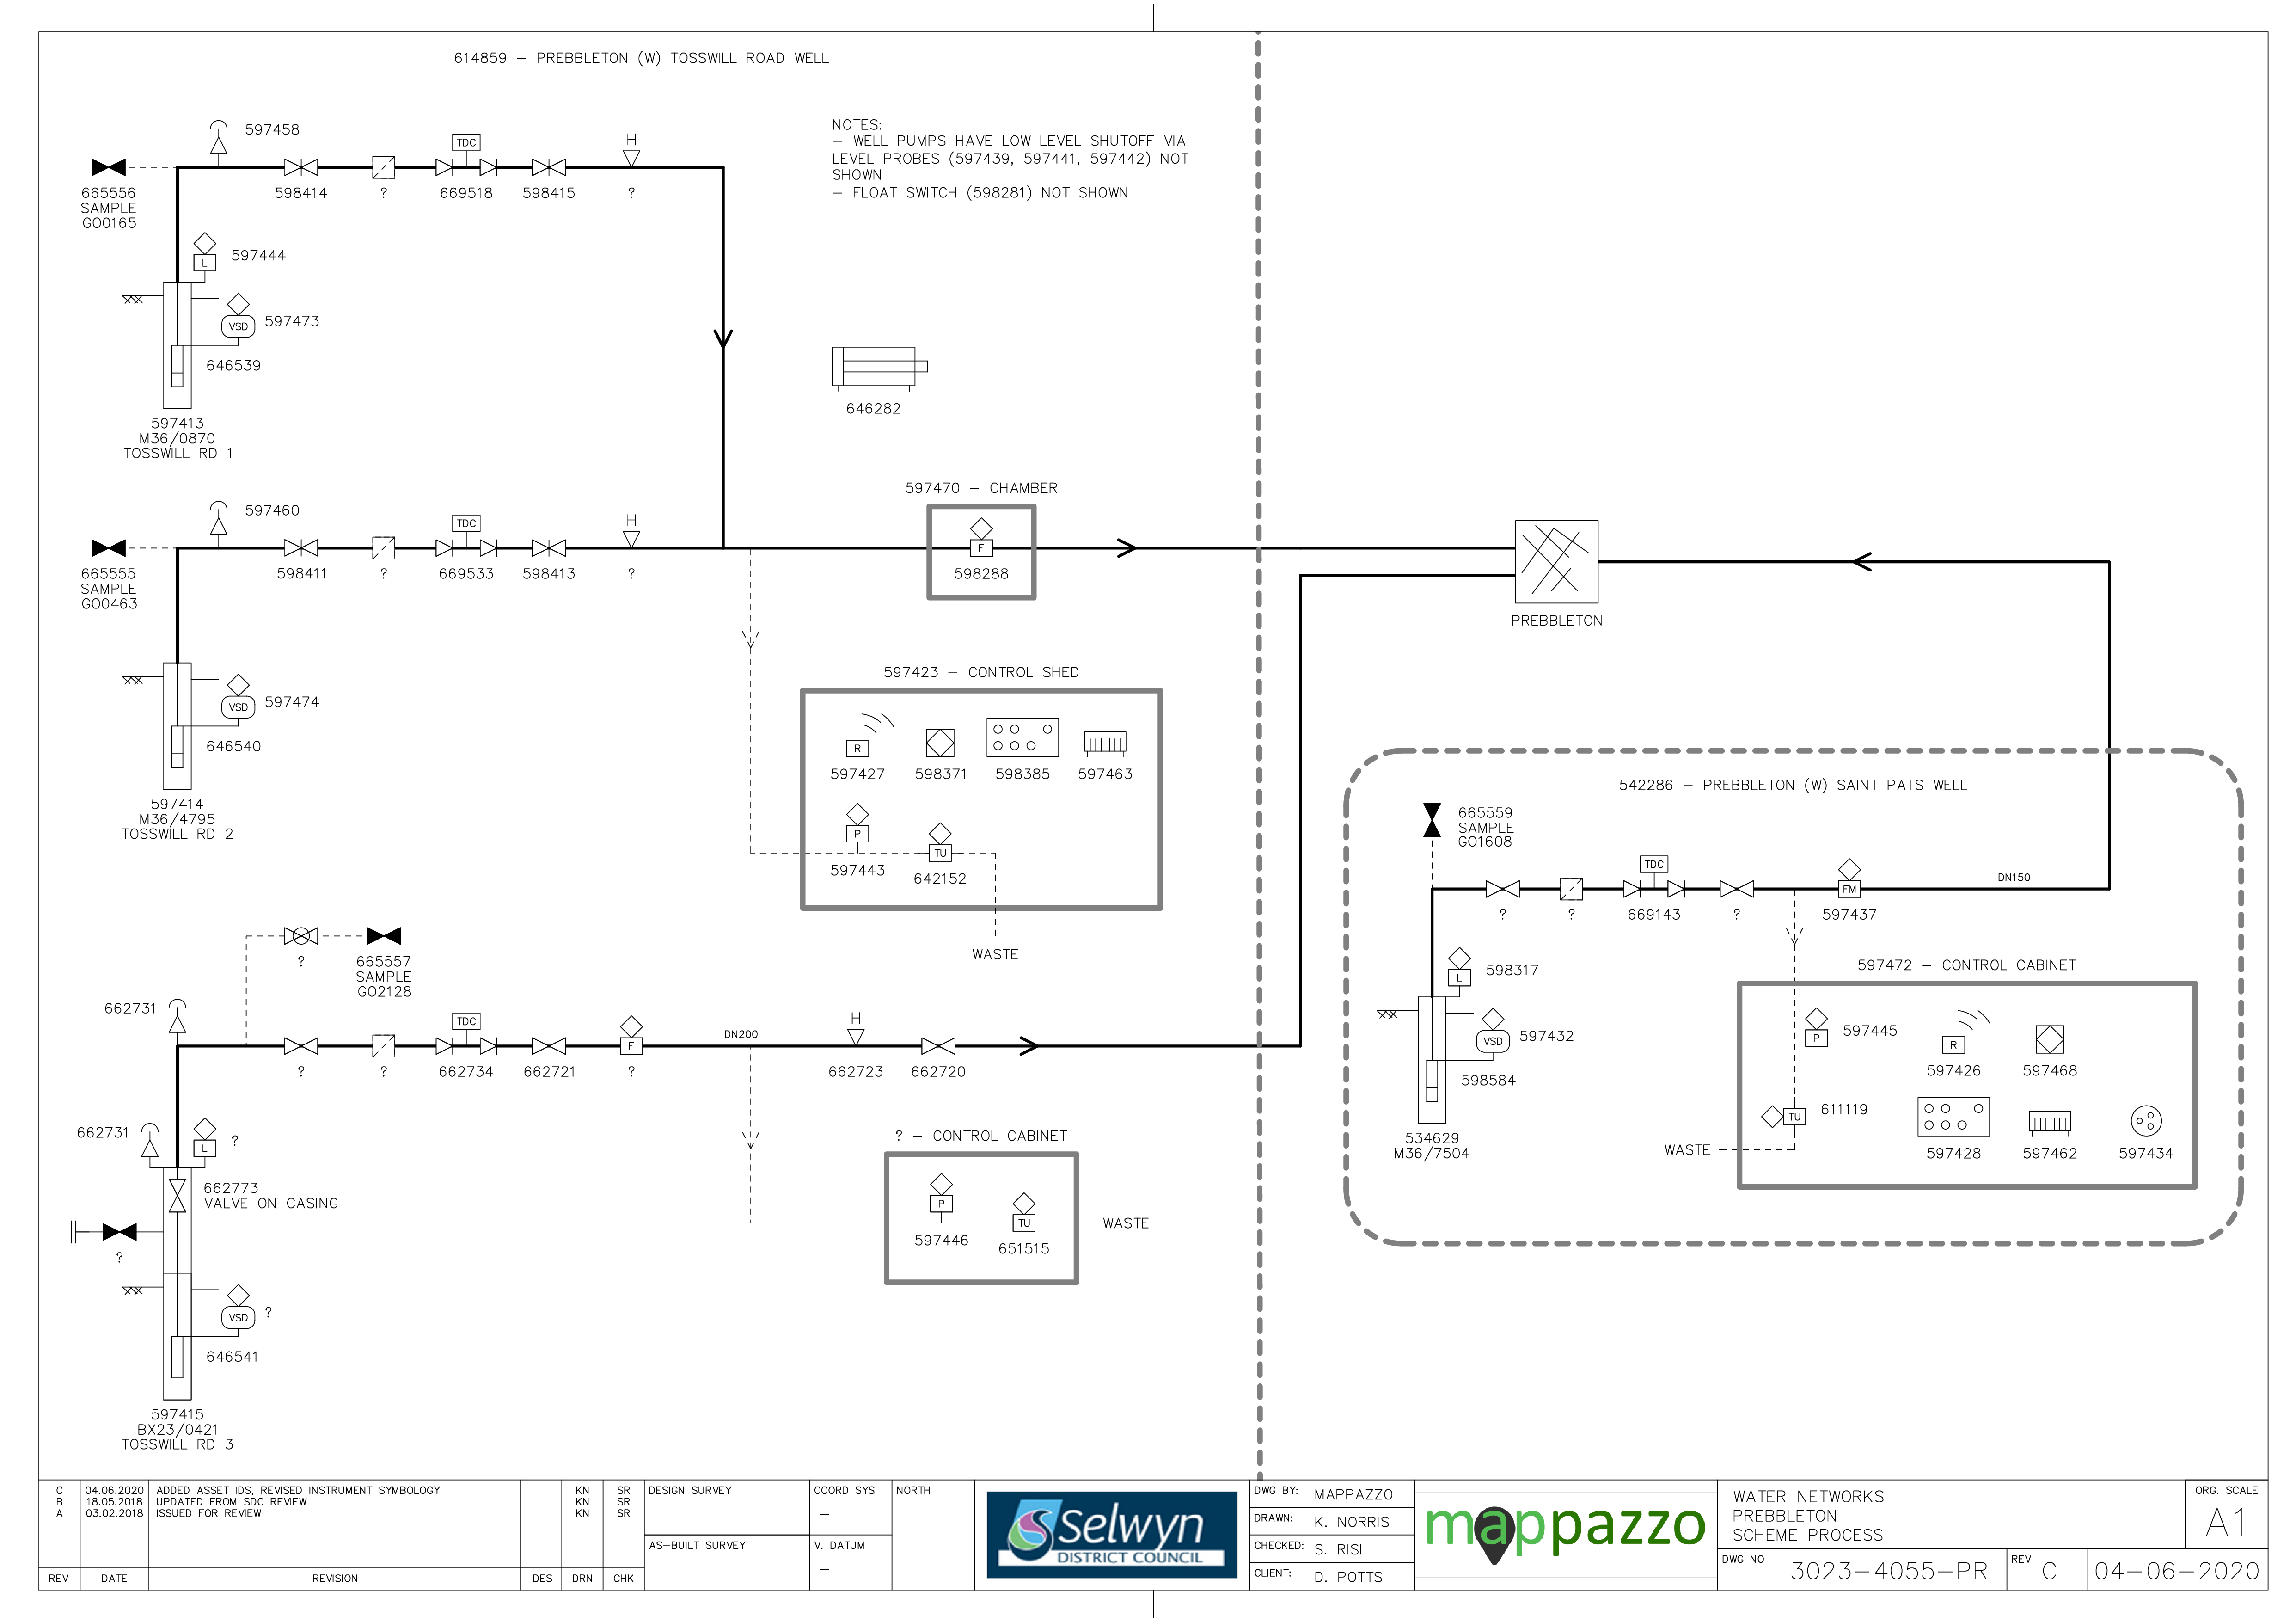
Figure 16‑2 Scheme Schematic
16.4 System Capacity
Prebbleton is expected to experience significant growth over the next 30-years. Figure 16‑3 shows the projected growth in water demand for Prebbleton to 2051, based on the latest housing projections.
Hydraulic models have been used to plan future water infrastructure for Prebbleton, as part of a master planning exercise. The master planning provides an assessment of the sizing and timing of new infrastructure for new water sources (wells) and pipelines to service growth. Part of the master planning requires a water balance to be developed to forecast growth, using historical peak demand per household. The water balance forecasts the peak instantaneous flow per year versus the water resources available to determine the staging of new wells. The well staging assumes that one well is redundant for each water supply, to take into consideration maintenance of wells, planning/timing of new wells and security of supply i.e. to maintain average/peak demand. The master planning exercise has identified that 4 new wells be required in Prebbleton, to service growth and to allow for older, less productive wells to be decomissioned (Table 16-3).
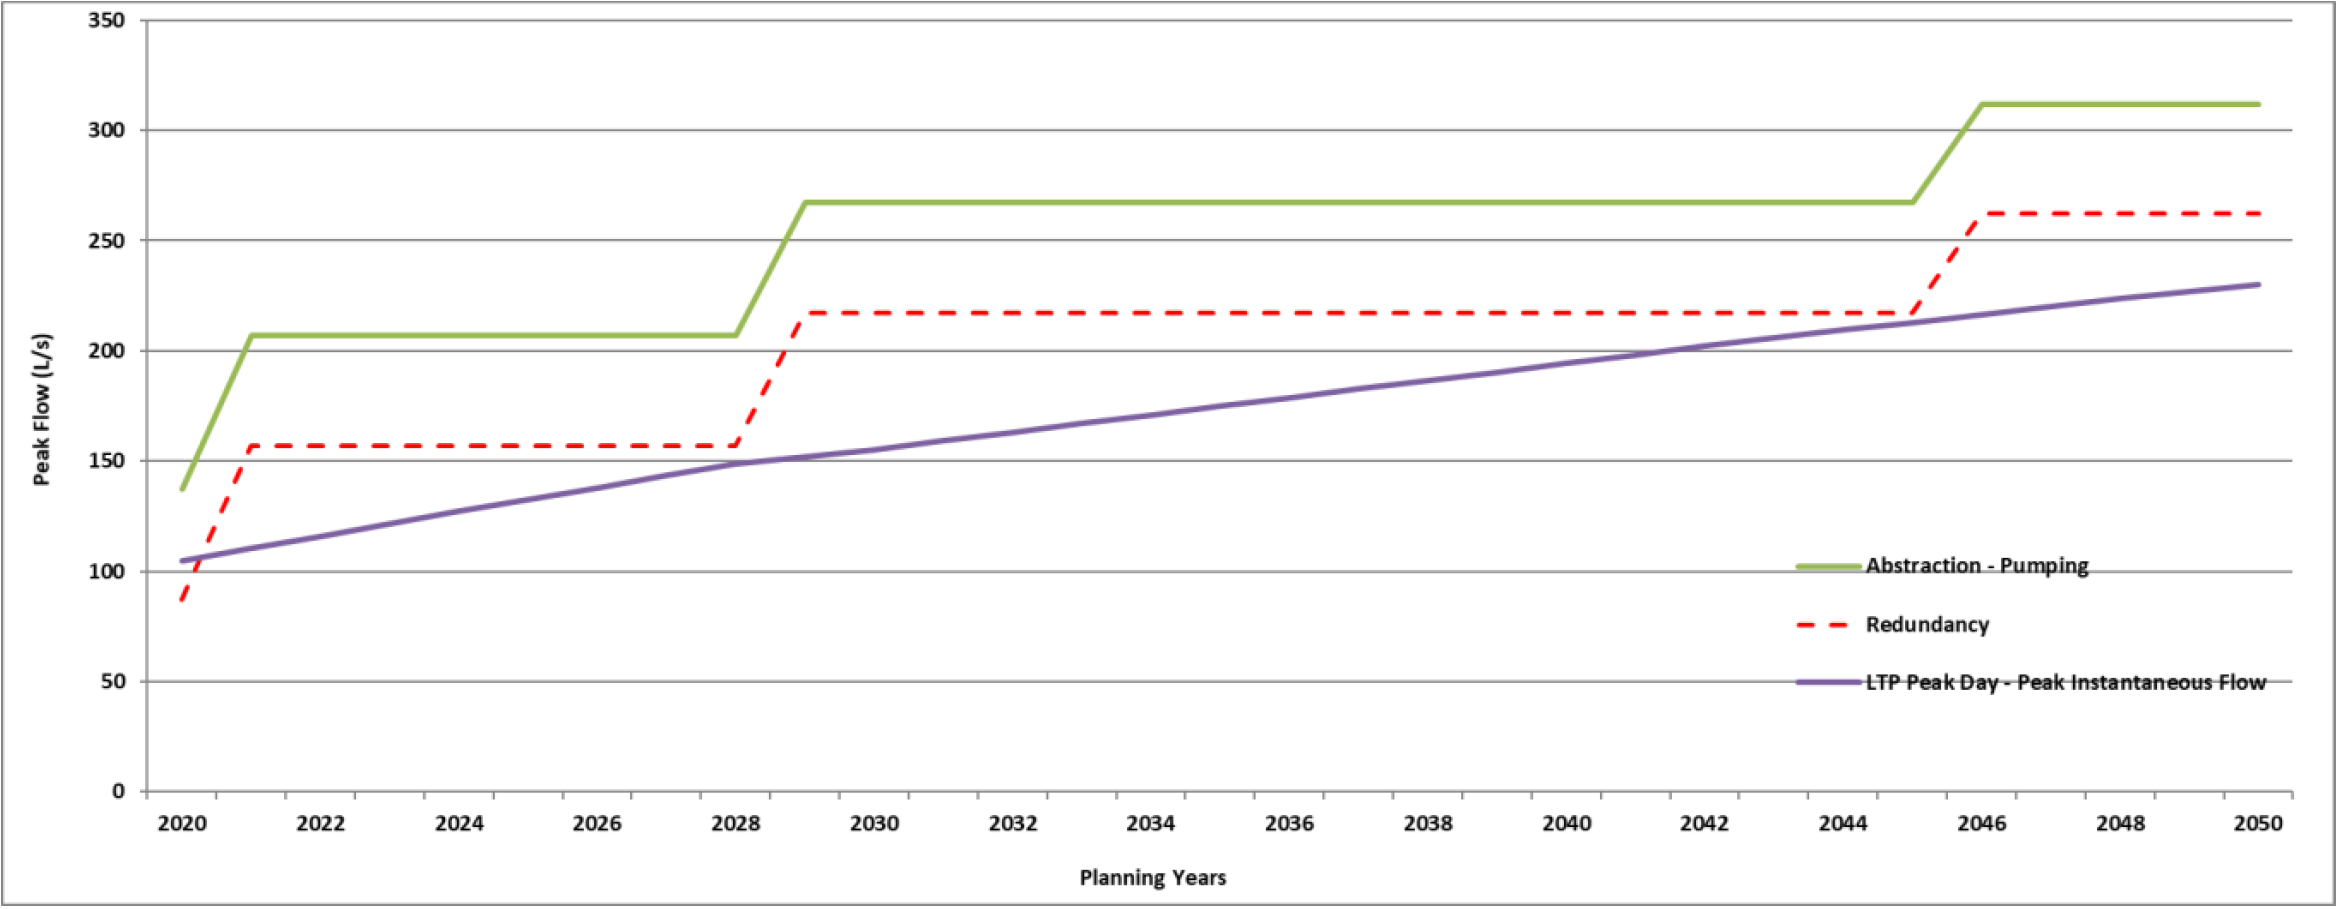
Figure 16‑3 Prebbleton Water Demand
Table 16‑2 Water Source Existing Capacity
St Pats
| 1 | 50
| To be decommissioned
|
Toswill Rd
| 1 | 18.5 | |
| 2 | 18.5 | |
| 3 | 50 | |
Table 16‑3 Water Source Future Capacity
Preb1
| Shands Road 1
| 2020/21
| 60
|
Preb2
| Shands Road 2
| 2020/21
| 60
|
| Preb4 | Decommisision St Pats
| 2020/21
| -50
|
Preb5
| Shands Road 3
| 2028/29
| 60
|
Additional
| TBC
| 2045/46
| 45
|
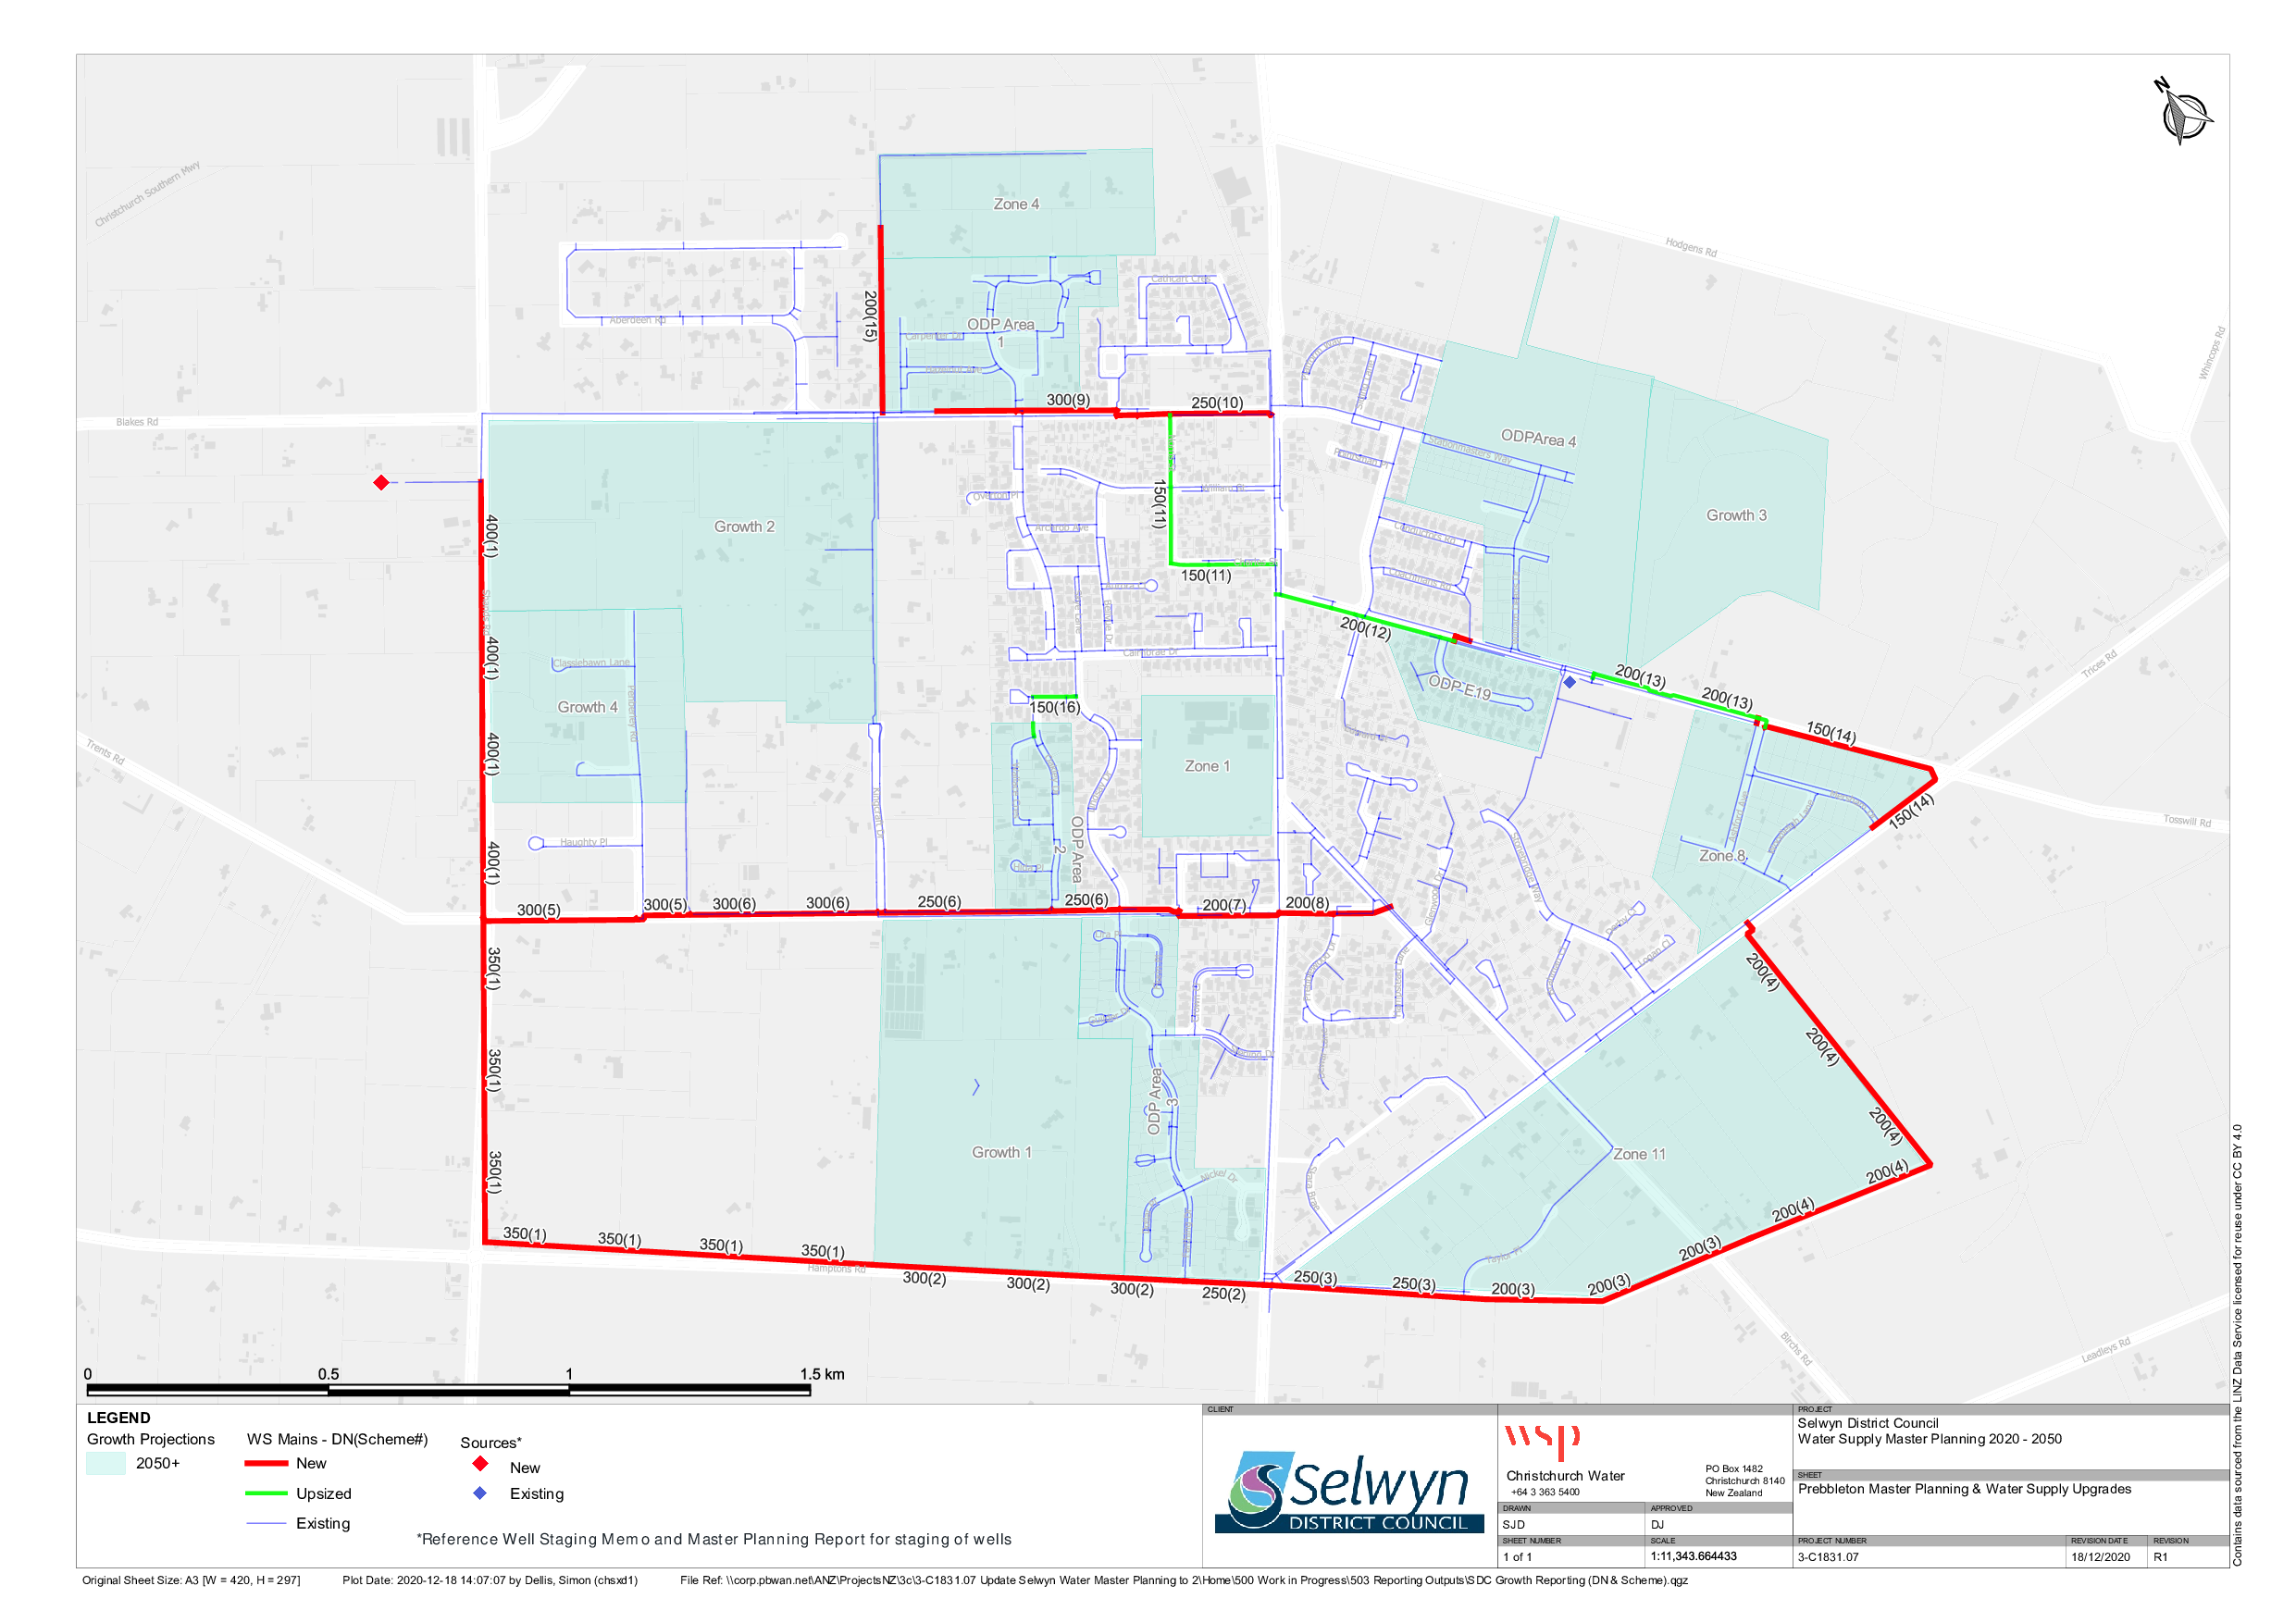
Figure 16‑4 Prebbleton Master Plan
16.5 Resource Consents
The Prebbleton water supply has a number of resource consents. Table 16‑4 shows the water take permitted by the resource consents for this scheme.
Table 16‑4 Resource Consents
CRC010900
| To take and use groundwater - from bore M36/0870 & M36/4795 | Tosswill Road, PREBBLETON | 14-Feb-02 | 31-Jan-35 | M36/0870
M36/4795
| 25
25
| N/A
|
CRC202353
| To take and use groundwater
| Tosswill & Shands Road, Prebbleton | 21-Jan-20
| 02-Aug-40
| M36/7504
M36/0870
M36/4795
BX23/0421
BX23/0874
| 75
25
25
75
100
| 1,576,800 m3 from 1 July - 30 June
+ limits for individual bores
|
16.6 Water Quality
The Prebbleton water supply is a secure source, made up of four wells and is currently sampled twice weekly at all wells except St Patricks which is sampled monthly. The reticulation is sampled weekly.
The following details E. coli transgressions for the period 2012 to 2020.
Treatment
There have been no E. coli treatment transgressions during this period.
Zone
There have been no E. coli transgressions during this period.
Chemical Analysis
The following is a summary of the raw water chemical analysis carried out at the Prebbleton Water Supply.
Table 16‑5 Raw Water Chemical Analysis Summary: Tosswill Road No. 1 Bore
Total Lead (g/m3)
| 0.01 (Maximum
Acceptable
Value)
| <0.0001
| <0.00011
| 0.00015
| <0.00011
| 0.001360
| <0.00011
| 0.000624
| <0.00011
| ✓ |
pH (pH units)
| 7 - 8.5 (Guideline Value)
| 7.8
| 7.7
| 7.7
| 7.9
| 7.9
| 7.7
| 7.8
| 7.9
| ✓
|
Total Hardness (g/m3 as CaCO3)
| <200 (Guideline Value)
| 36
| 46
| 44
| 45
| 39.1
| 42.3
| 41.4
| 39.0
| ✓
|
Total Calcium (g/m3)
| None
| 12
| 15.6
| 15.1
| 15.4
| 13.41
| 14.51
| 14.07
| 13.30
| ✓
|
Total Iron (g/m3)
| <0.2 (Guideline Value)
| <0.02
| 0.026
| 0.135
| <0.021
| 0.71
| <0.021 | <0.021
| <0.021
| ✓
|
Total Sodium (g/m3)
| <200 (Guideline Value)
| 6.7
| 7.6
| 7.6
| 7.1
| 7.17
| 7.01
| 6.61
| 6.51
| ✓
|
Nitrate - Nitrogen (g/m3)
| 11.3 (Maximum
Acceptable
Value)
| 0.52
| 0.51
| 0.39
| 0.54
| 0.54
| 0.618
| 0.706
| 0.702
| ✓
|
Table 16‑6 Raw Water Chemical Analysis Summary: Tosswill Road No. 3 Bore
Total Lead (g/m3)
| 0.01 (Maximum
Acceptable Value)
| <0.00011
| <0.00011
| <0.00011
| <0.00011
| ✓
|
pH (pH units)
| 7 - 8.5 (Guideline Value)
| 7.9
| 7.8
| 7.8
| 7.9
| ✓
|
Total Hardness (g/m3 as CaCO3)
| <200 (Guideline Value)
| 44.0
| 44.9
| 46.0
| 43.2
| ✓
|
Total Calcium (g/m3)
| None
| 15.31
| 15.61
| 15.82
| 14.81
| ✓
|
Total Iron (g/m3)
| <0.2 (Guideline Value)
| <0.021
| 0.047
| <0.021
| <0.021
| ✓
|
Total Sodium (g/m3)
| <200 (Guideline Value)
| 7.29
| 7.48
| 7.08
| 7.01
| ✓
|
Nitrate - Nitrogen (g/m3)
| 11.3 (Maximum
Acceptable Value)
| 0.57
| 0.56
| 0.581
| 0.607
| ✓
|
Table 16‑7 Raw Water Chemical Analysis Summary: St Patricks Bore
Total Lead (g/m3)
| 0.01 (Maximum
Acceptable
Value)
| <0.00010
| <0.00011 | <0.00011
| <0.00011 | <0.00011
| 0.000398
| <0.00011
| <0.00011
| ✓
|
pH (pH units)
| 7 - 8.5 (Guideline
Value)
| 7.7
| 7.3
| 7.8
| 7.9
| 7.9
| 8.0
| 7.8
| 8.1
| ✓
|
Total Hardness (g/m3 as CaCO3)
| <200 (Guideline
Value)
| 38
| 47
| 47
| 48
| 47
| 33.2
| 46.1
| 38.7
| ✓
|
Total Calcium (g/m3)
| None
| 13.0
| 16.1
| 15.9
| 16.3
| 15.75
| 11.2
| 15.69
| 13.14
| ✓
|
Total Iron (g/m3)
| <0.2 (Guideline
Value)
| <0.02
| <0.021
| <0.021
| <0.021
| <0.021
| 3.91
| <0.021
| 0.434
| X |
Total Sodium (g/m3)
| <200 (Guideline
Value)
| 6.8
| 8.2
| 7.9
| 8.3
| 7.86
| 7.68
| 7.87
| 7.38
| ✓
|
Nitrate - Nitrogen (g/m3)
| 11.3 (Maximum
Acceptable
Value)
| 0.52
| 0.47
| 0.36
| 0.56
| 0.52
| <0.05
| 0.49
| 0.22
| ✓
|
16.7 Scheme Assets
A summary of material and diameter for pipes in Prebbleton is shown by Figure 16‑5 and Figure 16‑6.
Figure
16‑5 Pipe Material – Prebbleton
Figure 16‑6 Pipe Diameter – Prebbleton
16.8 Operational Management
The water supply is operated and maintained under two maintenance contracts as follows:
- Contract 1241: Water Services Contract. Contract is with SICON who undertakes investigations, conditions inspections, proactive and reactive maintenance and minor asset renewals; and
- Contract 1202: Parks and Reserves Contract. Contract is with SICON who undertakes the maintenance of land scape features related to water services e.g. mowing, gardens etc.
Water quality sampling is completed under an agreement with Food and Health Ltd as required.
16.9 Photos of Main Assets
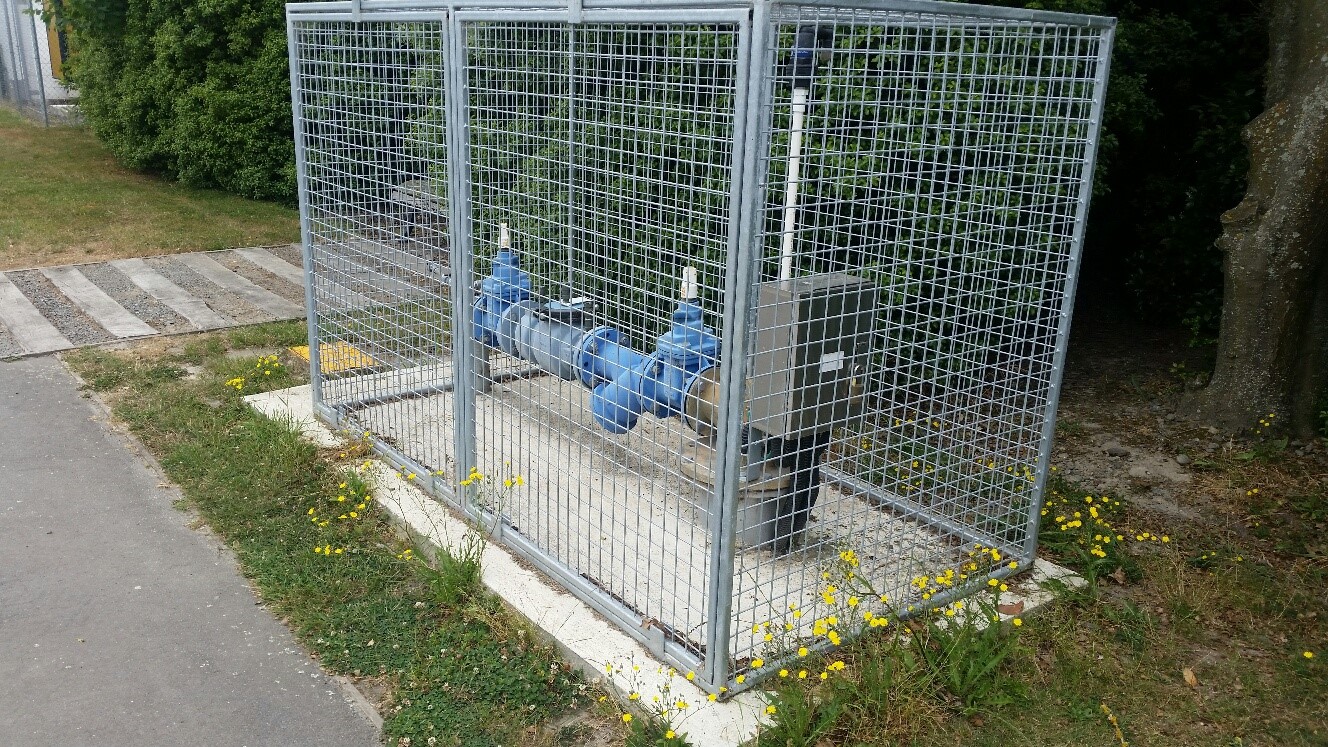
Photo 1: Prebbleton Well No 1
| 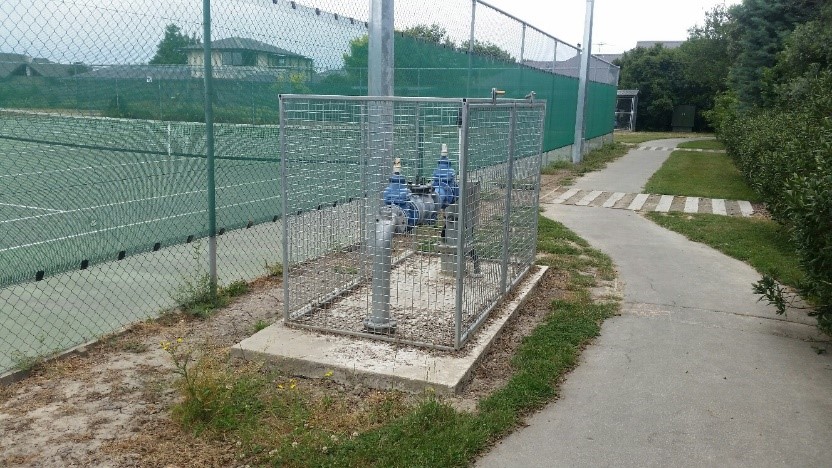
Photo 2: Prebbleton Well No 2
|
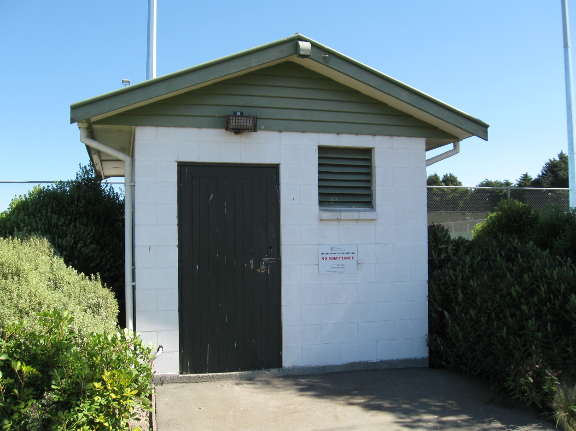
Photo 3: Prebbleton Wells control shed
| 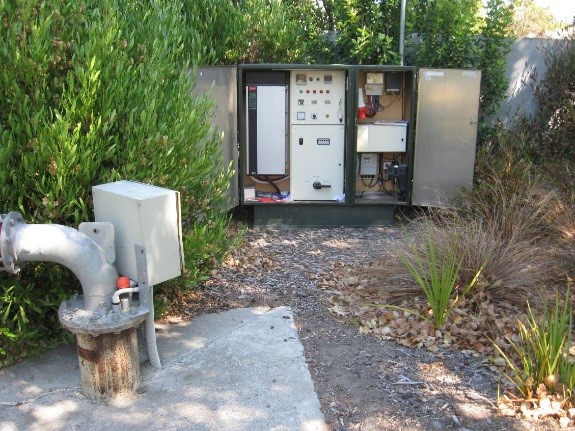
Photo 4: St Patricks bore and control cabinets
|
16.10 Risk Assessment
A risk assessment has been undertaken for the Prebbleton scheme. The key output from the risk assessment is the identification of any extreme and high risks which need to be mitigated. In order to mitigate these risks they have been included and budgeted for in the projects within this LTP. Table 16‑8 outlines the risk priority rating, Table 16‑9 outlines the risks and the list of key projects is found in Table 16‑14.
Table 16‑8 Risk Priority Rating
| > 50 | Extreme | Awareness of the event to be reported to Council. Urgent action to eliminate / mitigate / manage the risk. Document risk and action in the AMP. |
| 35-50 | Very High | Risk to be eliminated / mitigated / managed through normal business planning processes with responsibility assigned. |
| 14-35 | High | Manage risk using routine procedures. |
| 3.5-14 | Moderate | Monitor the risk. |
| < 3.5 | Low | Awareness of the event to be reported to Council. Immediate action required to eliminate / mitigate / manage the risk. Document risk and action in the AMP. |
Table 16‑9 Risks – Prebbleton
| Inadequate capacity to meet growth | Design second well and reservoir | 2014 | 40 | 40 | 27 |
| Inadequate capacity to meet growth | Construct second well and reservoir | 2014 | 40 | 40 | 27 |
| Electrical failure due to lightning or network spikes | Install surge diverters | 2014 | 20 | 20 | 20 |
| Failure to meet NES water meter standards | NES Water Meter Compliance | 2014 | 20 | 6 | 6 |
| Inability to collect income from non-metered properties | Install property water meters | 2014 | 27 | 0.6 | 0.6 |
| Non-compliance with the DWSNZ | DWSNZ - Age Testing | 2014 | 20 | 0.7 | 0.7 |
| Non-compliance with the DWSNZ | DWSNZ - Bore-head security | 2014 | 20 | 20 | 20 |
| Non-consented activities | Renewal of consents | 2014 | 27 | 27 | 6 |
| Inadequate treatment under all conditions | UV treatment + Filtration | 2017 | | 2 | 2 |
The list of district wide risks can be found in 5Waters Activity Management Plan: Volume 1.
16.11 Asset Valuation Details
The total replacement value of assets within the Prebbleton water scheme is $10,218,050 as detailed in Table 16‑10 below.
Table 16‑10 Replacement Value, Prebbleton
Plant and Equipment
| $969,627
|
Water Reticulation
| Hydrant | $613,261
|
| Lateral | $379,787
|
| Pipe | $6,426,566
|
| Supply Point | $1,310,232
|
| Valve | $518,578
|
16.12 Renewals
The renewal profile has been taken from the 2019 5 Waters Valuation. A graph showing the renewals for this scheme are shown by Figure 16‑7 below. The majority of renewals occur in the first ten years.
Figure 16‑7 Prebbleton Water Renewal Profile
16.13 Critical Assets
The criticality model for Prebbleton has been updated for the 2021 AcMP. The methodology of the criticality model can be found in 5Waters Activity Management Plan: Volume 1 and it provides details of how the criticality has been calculated for the reticulation assets. Table 16‑11 and Figure 16‑8 below shows the calculated criticality for all of the assets within this scheme that have a recorded known length.
Table 16‑11 Length of Assets per Criticality Level
5
| Low | 37,729
|
4
| Medium-Low | 12,484
|
3
| Medium | 17,431
|
2
| Medium-High | 4,232
|
1
| High | 271
|
16.14 Asset Condition
The asset condition model was run for Prebbleton in 2021. The methodology of the model can be found in 5Waters Activity Management Plan: Volume 1 which provides details of how the model has been calculated for the pipe reticulation assets. Figure 16‑9 below shows the level of asset condition for these assets within this scheme that have a recorded known condition.
Table 16‑12 provides a description of the condition rating used within the condition model.
Table 16‑12 Asset Condition Grading
| 1.0 | Excellent |
| 2.0 | Good |
| 3.0 | Moderate |
| 4.0 | Poor |
| 5.0+ | Fail |
The number of pipe faults is also measured through the asset management system. Figure 16‑10 shows the known historic pipe failures within this scheme.
16.15 Funding Program
The 10 year budgets for Prebbleton are shown by Table 16‑13. Budgets are split into expenditure, renewals, projects and capital projects. Expenditure and renewals are reported on a district-wide basis.
All figures are ($) not adjusted for CPI “inflation". They are calculated on historical data, and population growth where relevant.
Table 16‑13 Prebbleton Budget Summary
| 2021/2022 | $385,000
| $875,950
|
| 2022/2023 | -
| $678,750
|
| 2023/2024 | -
| $447,240
|
| 2024/2025 | -
| $114,465
|
| 2025/2026 | -
| $433,275
|
| 2026/2027 | -
| -
|
2027/2028
| -
| $251,685
|
2028/2029
| -
| $250,000
|
2029/2030
| -
| -
|
2030/2031
| -
| $40,125
|
| Total | $385,000
| $3,091,490
|
An explanation of the categories within the budgets are as follows below:
-
Expenditure consists of operation and maintenance costs;
-
Renewals are replacement of assets which are nearing or exceeded their useful life;
-
Projects are investigations, decisions and planning activities which exclude capital works; and
-
Capital projects are activities involving physical works.
There are a number of major projects for Prebbleton water scheme in the LTP budget.
Table 16‑14 Key Projects
Capital Projects
| 405590039
| Prebbleton Growth
| $560,950
| $603,750
| $447,240
| $1,089,550
| 100% G
|
Capital Projects
| TBC
| New submersible pump at Tosswill Road No. 2 bore
| $100,000
| -
| -
| -
| 100% LoS
|
Capital Projects
| TBC
| Pressure sensors for reticulation network
| $15,000
| $75,000
| -
| -
| 100% LoS
|
Capital Projects
| TBC
| UV treatment and filtration - design & construct
| $585,000
| -
| -
| -
| 100% LoS
|
* Where LoS refers to Level of Service and G refers to Growth
The list of district wide projects can be found in 5Waters Activity Management Plan: Volume 1.
Discussion on Projects
Projects have been determined based on their:
- Relevance to the scheme
- Requirement to be completed under legislation
- Ability to bring the scheme up to or maintain the Level of Service required under council's Asset Management Policy.
Many projects are
jointly funded by more than one scheme and activity. Each scheme pays a pro-rata share only, equivalent to the number of connections.
Discussion on Capital and Projects
Where relevant, Capital (Levels of Service) and Capital (Growth) projects have been included in the scheme financial details.
Levels of Service Projects and growth splits have been provided to ensure the costs of population driven works are clear.
<<
5-Waters Volume 2 - Water Supplies


