<<
5-Waters-Volume-3-Wastewater
3 Claremont Wastewater Scheme
3.1 Scheme Summary
| Estimated Population Served | 172
|
Scheme Coverage (1 Jan 2021) | Full Charges | 49
|
| Half Charges | 5
|
| >1 Charges | 5
|
System Components
| Piped (m) | 3,040
|
| Manholes (No.) | 16
|
| Pump Stations (No.) | 1
|
| Treatment | Package treatment plant |
| Disposal | Subsurface disposal fields |
| History | Original scheme installation date | 2005
|
Value ($)
| Replacement Cost | $2,566,534
|
| Depreciated Replacement Cost | $1,891,300
|
Financial
| Operator cost (scheduled and reactive maintenance) per connection
| $1,002.58/connection
|
Demand
(1 Jan - 31 Dec 2020)
| Annually (m3) | 10,748
|
| Average daily (m3) | 29.4
|
| Peak daily (m3) | 157.0
|
| Minimum daily (m3) | -
|
| Infiltration | Not a significant issue for this scheme
|
| Sustainability | Ultimate discharge point | Storage and subsurface disposal (irrigation) |
3.2 Key Issues
The following key issues are associated with the Claremont Wastewater Scheme. A list of district wide issues are located in 5Waters Activity Management Plan: Volume 1.
Table 3‑1 Claremont Scheme Issues
| Cost of scheme operation and maintenance | Council will review options to reduce operation and maintenance costs and optimise renewals. |
3.3 Overview & History
Claremont is an independently serviced subdivision adjacent to Templeton. Wastewater is treated by a small 'package' treatment plant and effluent is disposed of to land. Construction was completed in 2005 and the assets adopted by Council in 2007. There is a small rating base which is required to contribute solely to all costs associated with the lifecycle management of this scheme.
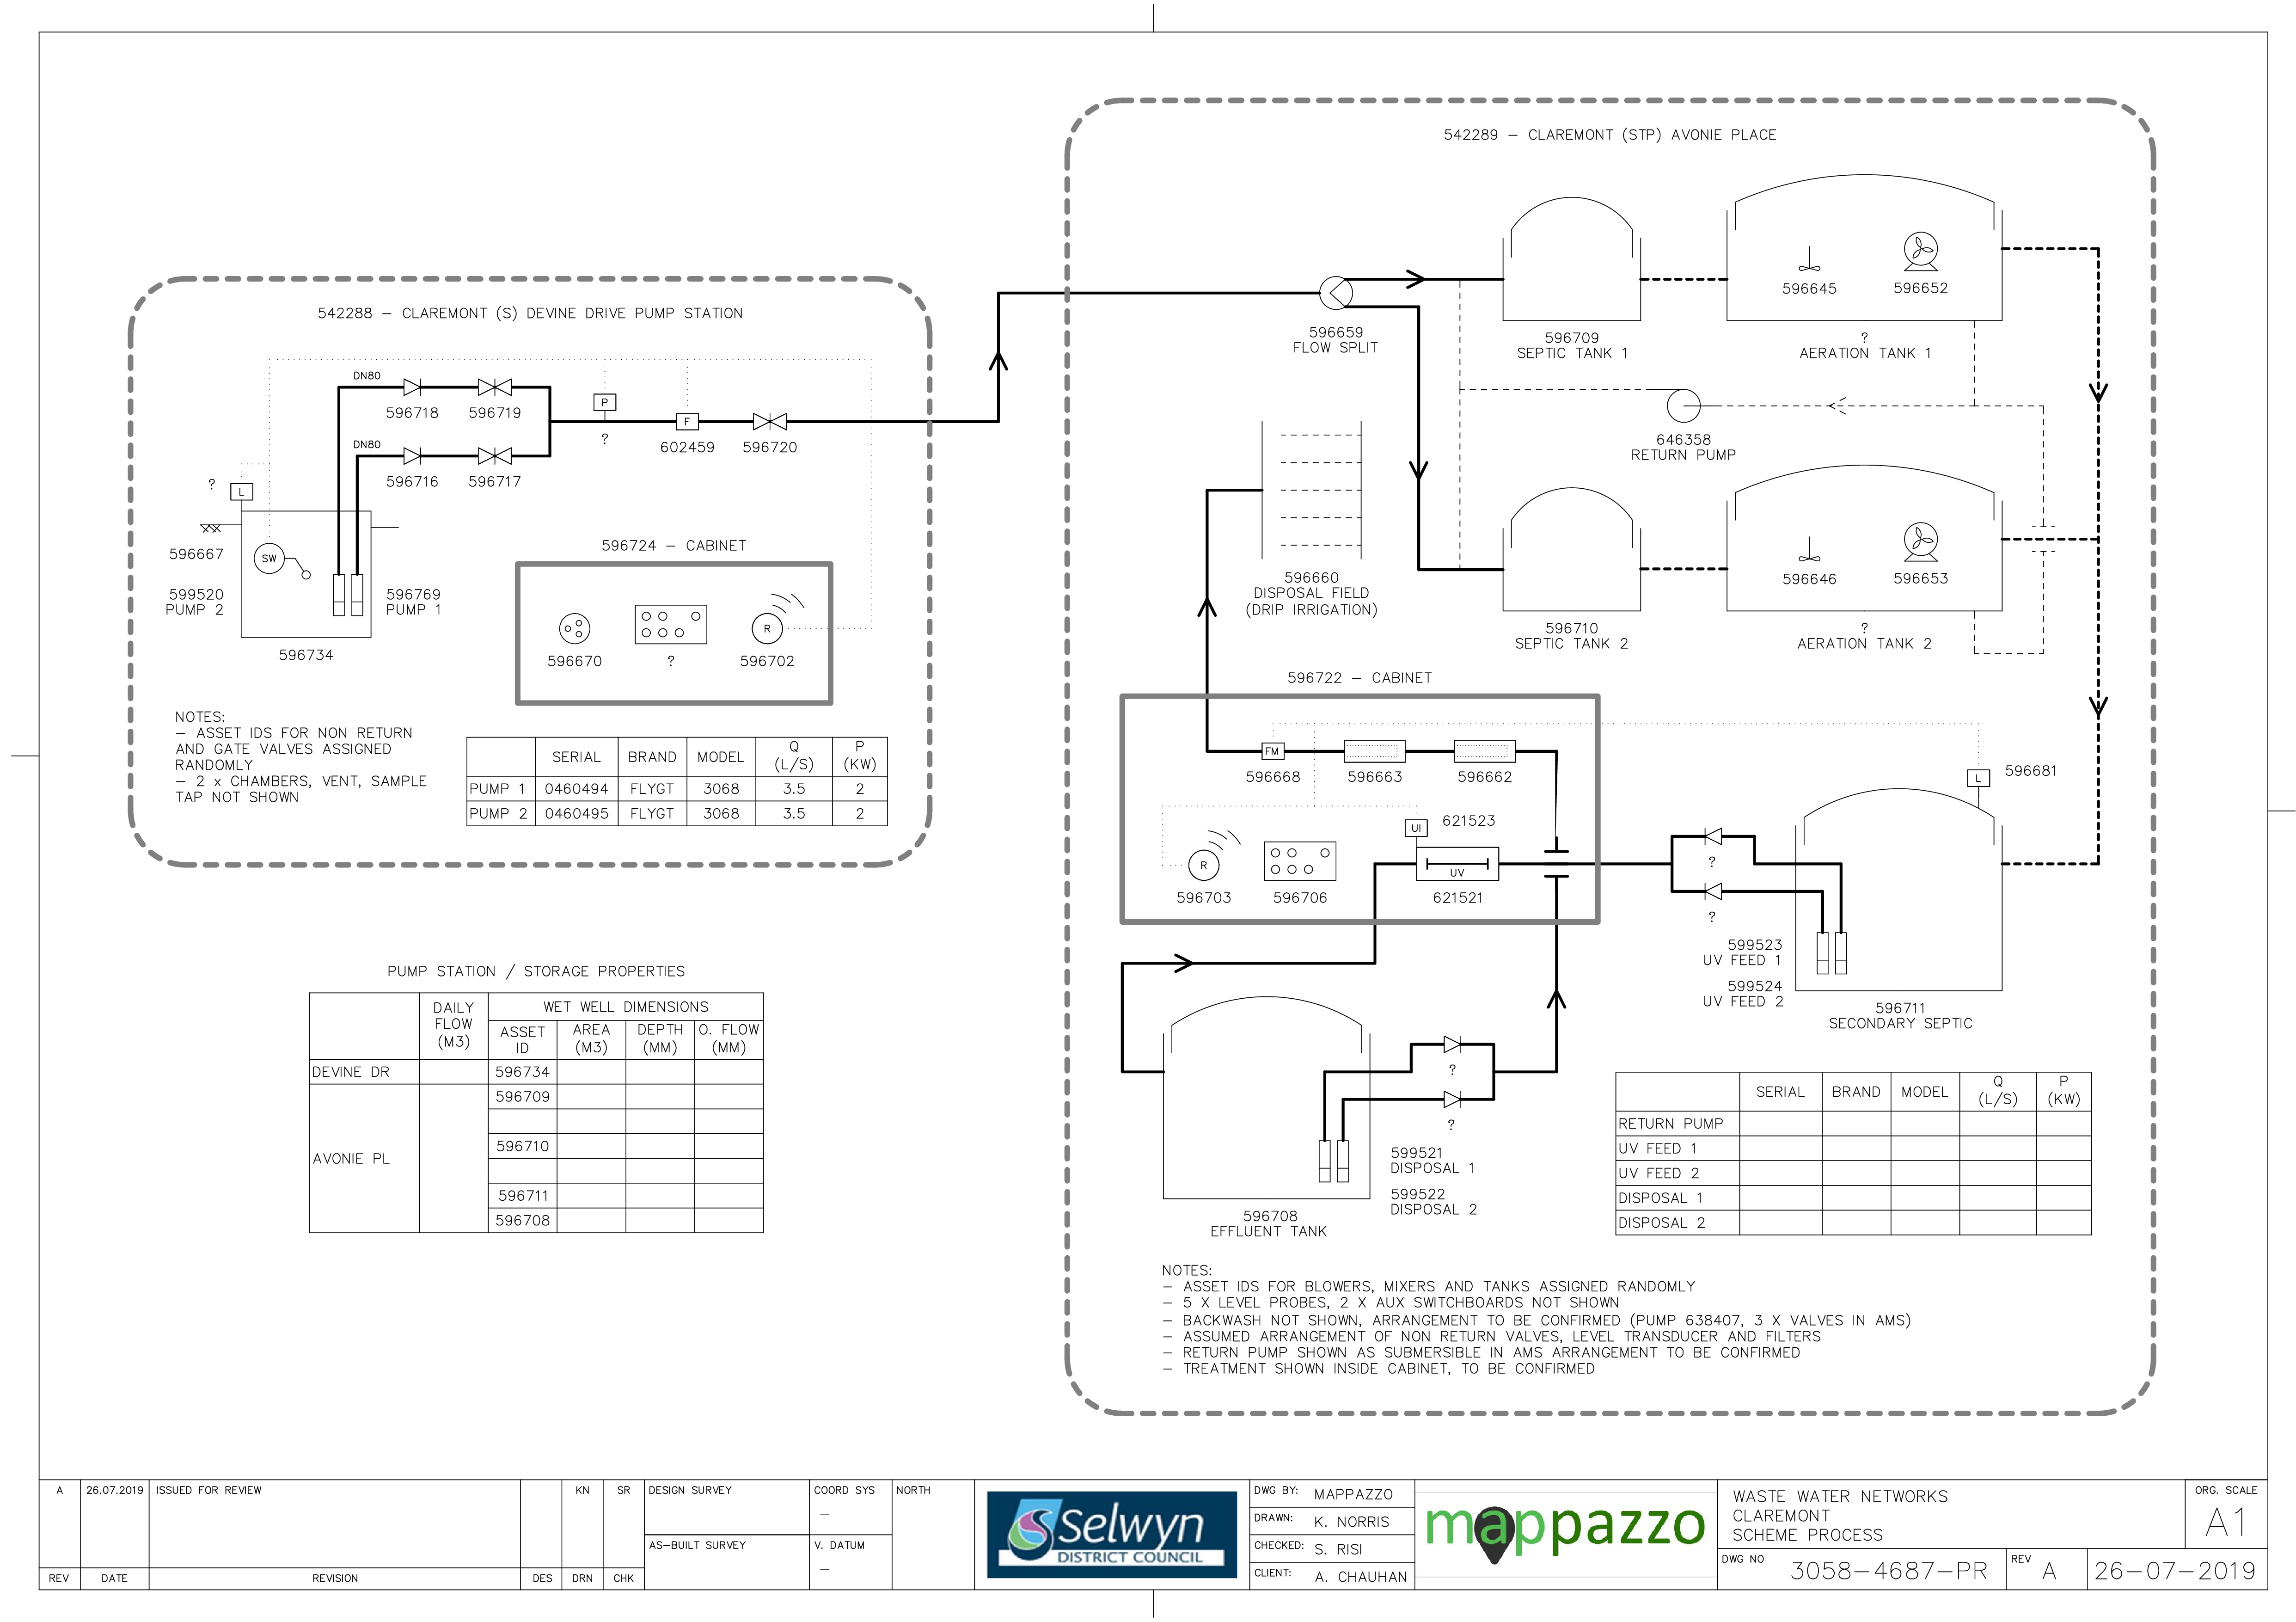
Figure 3‑2 Scheme Schematic
3.4 System Capacity
The current Claremont wastewater flows are consistent with the design flows for the current number of connected properties. Consent conditions and system design meets correct needs but limit further growth.
There is not expected to be significant growth in the area serviced by this scheme and scheme expansion is not expected to be required over the planning horizon of this AcMP.
3.5 Resource Consents
The Claremont wastewater scheme has a number of resource consents. Table 3‑2 shows the discharge permitted by the resource consents for this scheme.
Table 3‑2 Resource Consents
CRC000095.2
| To discharge domestic sewage effluent to ground via a "Blivot Aerotor" treatment system and "RAAM" irrigation disposal system, at or about map reference NZMS 260 M36:665-380. | Waterholes Road, TEMPLETON | 20-Jun-08 | 9-Feb-35 | 58 |
There are no consents up for renewal during the term of this Plan. There is no compliance issues associated with the Claremont Sewerage Scheme.
3.6 Scheme Assets
A summary of the assets within this scheme is outlined in this section.
3.6.1 Reticulation Overview
A summary of material and diameter for pipes is shown in Figure 3‑3 and Figure 3‑4.
Figure 3‑3 Pipe Material – Claremont
Figure 3‑4 Pipe Diameter – Claremont
3.6.2 Treatment and Disposal
The treatment facilities consist of a Smith & Loveless MICROFAST secondary aerated package plant.
Table 3‑3 Treatment Plant Package
| Flow Splitter | Flow splitter box | 2005 |
| Settling tank | 2x22m3 Primary settling tanks with outlet filters | 2005 |
| Aeration | 2x32m3 MICROFAST 9.0 secondary aeration tanks with blower and aeration equipment | 2005 |
| Storage | Final storage tank | 2005 |
| Disposal | Sub surface | 2005 |
3.6.3 Design
The design data for the Claremont system is tabled below.
Table 3‑4 Design Data
Claremont Wastewater Scheme is a small scheme with no allowance for expansion beyond the package plant capacity. Expansion is not likely to be required within the foreseeable future as once the number of connection reaches the subdivision maximum so too will the design capacity have been reached. Any further development in the vicinity will require rezoning of land and wastewater and disposal for the development would need to be assessed as part of the development.
3.6.4 Pump Stations
The pump station in Devine Drive pumps to the wastewater treatment plant.
3.7 Operational Management
The wastewater schemes are operated and maintained under the maintenance contract as follows:
- Contract 1241: Water Services Contract. Contract is with SICON who undertakes investigations, conditions inspections, proactive and reactive maintenance and minor asset renewals.
Wastewater sampling is completed under an agreement with Food and Health Ltd as required.
3.8 Photos of Main Assets
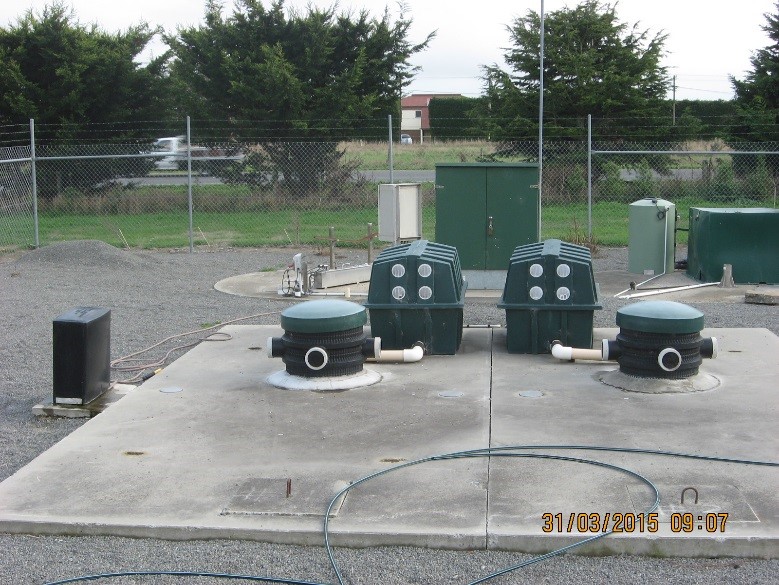
Photo 1 - Package Plant
|
3.9 Risk Assessment
A risk assessment has been undertaken for the Claremont scheme. The key output from the risk assessment is the identification of any extreme and high risks which need to be mitigated. In order to mitigate these risks they have been included and budgeted for in the projects within this LTP. Table 3‑5 details the risk priority rating and Table 3‑6 outlines the risks for this scheme.
Table 3‑5 Risk Priority Rating
| > 50 | Extreme | Awareness of the event to be reported to Council. Urgent action to eliminate / mitigate / manage the risk. Document risk and action in the AMP. |
| 35-50 | Very High | Risk to be eliminated / mitigated / managed through normal business planning processes with responsibility assigned. |
| 14-35 | High | Manage risk using routine procedures. |
| 3.5-14 | Moderate | Monitor the risk. |
| < 3.5 | Low | Awareness of the event to be reported to Council. Immediate action required to eliminate / mitigate / manage the risk. Document risk and action in the AMP. |
Table 3‑6 Risks - Claremont
| System is not optimised resulting in increased operational costs | Replace manual valves with solenoid valves and control via Datran | 2014 | 12 | 12 | 12 |
| Failure of power supply to scheme | Open up 5th irrigation zone to provide operational redundancy | 2014 | 12 | 12 | 12 |
| Non-consented activities | Renewal of consents | 2014 | 27 | 27 | 6 |
| Limited capacity and redundancy | Extend irrigate to 5th area | 2017 | | 2 | 0.7 |
The list of district wide risks can be found in 5Waters Activity Management Plan: Volume 1.
3.10 Asset Valuation Details
The total replacement value of assets within the Claremont Scheme is $2,587,966 as detailed in Table 3‑7.
Table 3‑7 Replacement Value, Claremont
Plant and Equipment
| $1,492,128
|
Wastewater Reticulation
| Chamber | $7,392
|
| Lateral | $209,250
|
| Manhole | $139,176
|
| Pipe | $737,916
|
| Valve | $2,103
|
3.11 Renewals
The renewal profile has been taken from the 2019 5 Waters Valuation. A graph showing the renewals for this scheme are shown by Figure 3‑5 below.
Figure 3‑5 Claremont Wastewater Renewal Profile
3.12 Critical Assets
The criticality model for Claremont has been updated for the 2021 AcMP. The methodology of the criticality model can be found in 5Waters Activity Management Plan: Volume 1 and it provides details of how the criticality has been calculated for the reticulation assets. Table 3‑8 and Figure 3‑6 below show the calculated criticality for all of the assets within this scheme that have a recorded known length.
Table 3‑8 Length of Assets per Criticality Level
5
| Low | 3,453
|
4
| Medium-Low | 0 |
3
| Medium | 0 |
2
| Medium-High | 0 |
1
| High | 0 |
3.13 Asset Condition
The asset condition model was run for Claremont in 2021. The methodology of the model can be found in 5Waters Activity Management Plan: Volume 1 and it provides details of how the model has been calculated for the reticulation assets (particularly pipes). Figure 3‑7 below shows the level of asset condition for all of the assets within this scheme that have a recorded known condition.
Table 3‑9 provides a description of the condition rating used within the condition model.
Table 3‑9 Asset Condition Grading
| 1.0 | Excellent |
| 2.0 | Good |
| 3.0 | Moderate |
| 4.0 | Poor |
| 5.0+ | Fail |
3.14 Funding Program
The 10 year budgets for Claremont are shown Table 3‑10. Budgets are split into expenditure, renewals, projects and capital projects. Expenditure and renewals have been reported on a district-wide basis in Volume 1.
All figures are ($) not adjusted for CPI “inflation". They are calculated on historical data, and population growth where relevant.
Table 3‑10 Claremont Budget Summary
| 2021/2022 | -
| -
|
| 2022/2023 | $30,000
| -
|
| 2023/2024 | $100,000
| -
|
| 2024/2025 | -
| $500,000
|
| 2025/2026 | -
| -
|
| 2026/2027 | -
| -
|
2027/2028
| -
| -
|
2028/2029
| -
| -
|
2029/2030
| -
| -
|
2030/2031
| -
| -
|
|
Total | $130,000
| $500,000
|
An explanation of the categories within the budgets are as follows below:
- Expenditure consists of operation and maintenance costs;
- Renewals are replacement of assets which are nearing or exceeded their useful life;
- Projects are investigations, decisions and planning activities which exclude capital works; and
- Capital projects are activities involving physical works.
Table 3‑11 Key Projects
| Capital Projects | -
| Site upgrades/pre-treatment
| -
| $30,000
| $100,000
| $500,000
| 100% LoS |
* LoS refers to Level of Service
The list of district wide projects can be found in 5Waters Activity Management Plan: Volume 1.
Discussion on Projects
Projects have been determined based on their:
- Relevance to the scheme
- Requirement to be completed under legislation
- Ability to bring the scheme up to or maintain the Level of Service required under council's Asset Management Policy.
Many projects are
jointly funded by more than one scheme and activity. Each scheme pays a pro-rata share only, equivalent to the number of connections.
Discussion on Capital and Projects
Where relevant, Capital (Levels of Service) and Capital (Growth) projects have been included in the scheme financial details.
Levels of Service Projects and growth splits have been provided to ensure the costs of population driven works are clear.


