<<
5 Waters - Summary
3 Activity Areas
This section of the Plan details the rationale for ownership of the 5Waters assets and the description of assets covered under it.
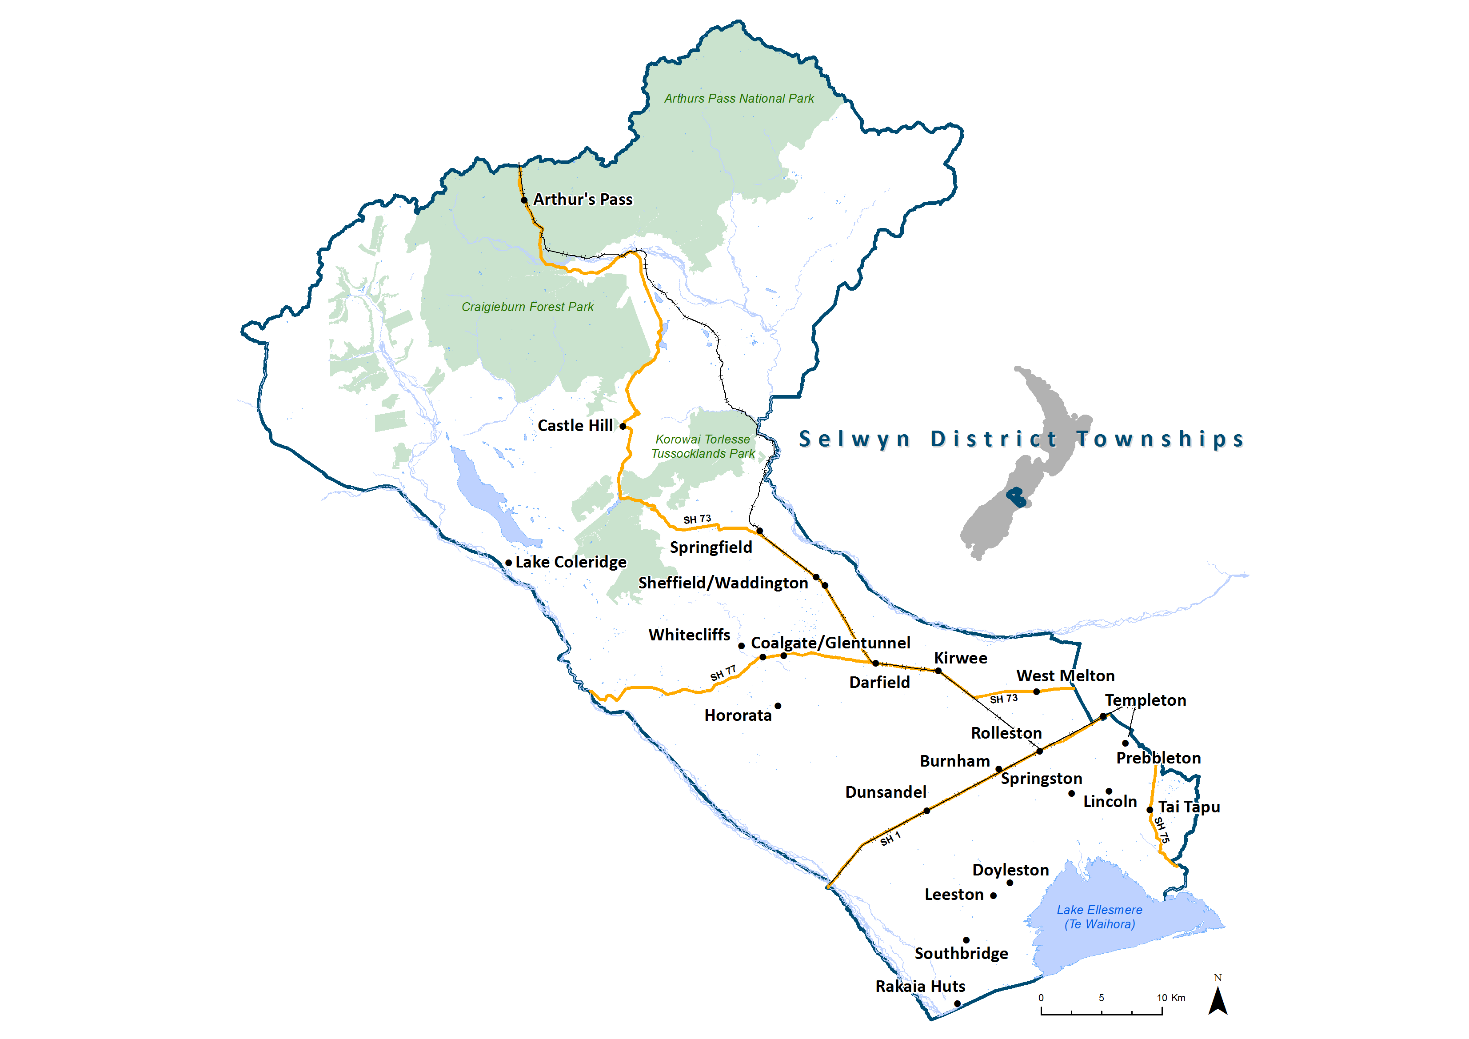
Figure 3‑1 Selwyn District Overview
The Selwyn District Council is a local authority situated in the South Island of New Zealand. The Council was formed in 1989, as a result of an amalgamation.
The Council is a provider of “core" activities which are considered to be delivery of water (urban and rural), wastewater, stormwater, land drainage and water races services. These are 5 of the 11 Council activities.
The Council is located in the heart of the Canterbury Region's groundwater zone. How and where water for human, agricultural, cultural and recreational uses is managed is of considerable interest to Canterbury residents. Council has consistently regarded the provision of the 5Waters as vital to maintaining the community's health and well-being.
The Council provides services to residents via 81 5Waters Schemes. The 5Waters are summarised in Table 3‑1 below.
Table 3‑1 Summary of the 5Waters Services*
| Water | 27
| 19,242
| $50,645,602
| $184,226,000
|
| Wastewater | 14
| 15,330
| $53,733,107
| $311,469,000
|
| Stormwater | 22 | 15,818
| $12,661,523
| $70,207,000
|
| Land Drainage | 10
| 7,314
| $2,508,093
| $45,098,000
|
| Water Races | 3 | 14,609 | $24,232,460
| $117,674,000
|
|
Total |
76
|
72,313
|
$143,780,785
|
$728,674,000
|
* Septage pit sites are not included in this summary
Council has access to a globally unique, high quality water source. Secure and uncontaminated freshwater for drinking is still delivered to the majority of accessible populated areas in the district. How Council ensures that this life-giving resource is preserved for future generations is of utmost importance.
Generally streams, rivers and springs are not part of this activity, as they are managed by the overarching authority – the Canterbury Regional Council. In fact, the Canterbury Regional Council has delegated authority to manage the water resource, with Council one of approximately 18,0000 parties requesting consent to take/use and discharge it.
3.1 Water
The following section describes the potable (drinking) water activity. Further detail on this activity is provided in Volume 2: Water Supplies.
3.1.1 Water Supply Principles
There are six principles of water management, these were identified in the Havelock North Inquiry in 2017. These principles are ingrained in good practice worldwide and should imbue every aspect of the New Zealand approach to drinking water. These six principles are outlined in this section.
Principle 1: A high standard of care must be embraced
Unsafe drinking water can cause illness, injury or death on a large-scale. All those involved in supplying drinking water (from operators to politically elected representatives) must therefore embrace a high standard of care akin to that applied in the fields of medicine and aviation where the consequences of a failure are similarly detrimental to public health and safety. Vigilance, diligence and competence are minimum requirements and complacency has no place.
Principle 2: Protection of source water is of paramount importance
Protection of the source of drinking water provides the first, and most significant, barrier against drinking water contamination and illness. It is of paramount importance that risks to sources of drinking water are understood, managed and addressed appropriately. However, as pathogenic microorganisms are found everywhere, complete protection is impossible and further barriers against contamination are vital.
Principle 3: Maintain multiple barriers against contamination
Any drinking water system must have, and continuously maintain, robust multiple barriers against contamination appropriate to the level of potential contamination. This is because no single barrier is effective against all sources of contamination and any barrier can fail at any time. Barriers with appropriate capabilities are needed at each of the following levels: source protection; effective treatment; secure distribution; effective monitoring; and effective responses to adverse signals. A “source to tap" approach is required.
Principle 4: Change precedes contamination
Contamination is almost always preceded by some kind of change and change must never be ignored. Sudden or extreme changes in water quality, flow or environmental conditions (for example, heavy rainfall, flooding, earthquakes) should arouse particular suspicion that drinking water might become contaminated. Change of any kind (for example, personnel, governance, equipment) should be monitored and responded to with due diligence.
Principle 5: Suppliers must own the safety of drinking water
Drinking water suppliers must maintain a personal sense of responsibility and dedication to providing consumers with safe water. Knowledgeable, experienced, committed and responsive personnel provide the best assurance of safe drinking water. The personnel, and drinking water supply system, must be able to respond quickly and effectively to adverse monitoring signals. This requires commitment from the highest level of the organisation and accountability by all those with responsibility for drinking water.
Principle 6: Apply a preventive risk management approach
A preventive risk management approach provides the best protection against waterborne illness. Once contamination is detected, contaminated water may already have been consumed and illness may already have occurred. Accordingly, the focus must always be on preventing contamination. This requires systematic assessment of risks throughout a drinking water supply from source to tap; identification of ways these risks can be managed; and control measures implemented to ensure that management is occurring properly. Adequate monitoring of the performance of each barrier is essential. Each supplier's risk management approach should be recorded in a living WSP which is utilised on a day to day basis.
3.1.2 Description of the Activity
Council manages 27 water supplies, located between the main divide and Pacific coast (Figure 3‑2). They supply water for public needs including household, gardens, and public reserves. The water supplies service 80% of residential properties within the district.
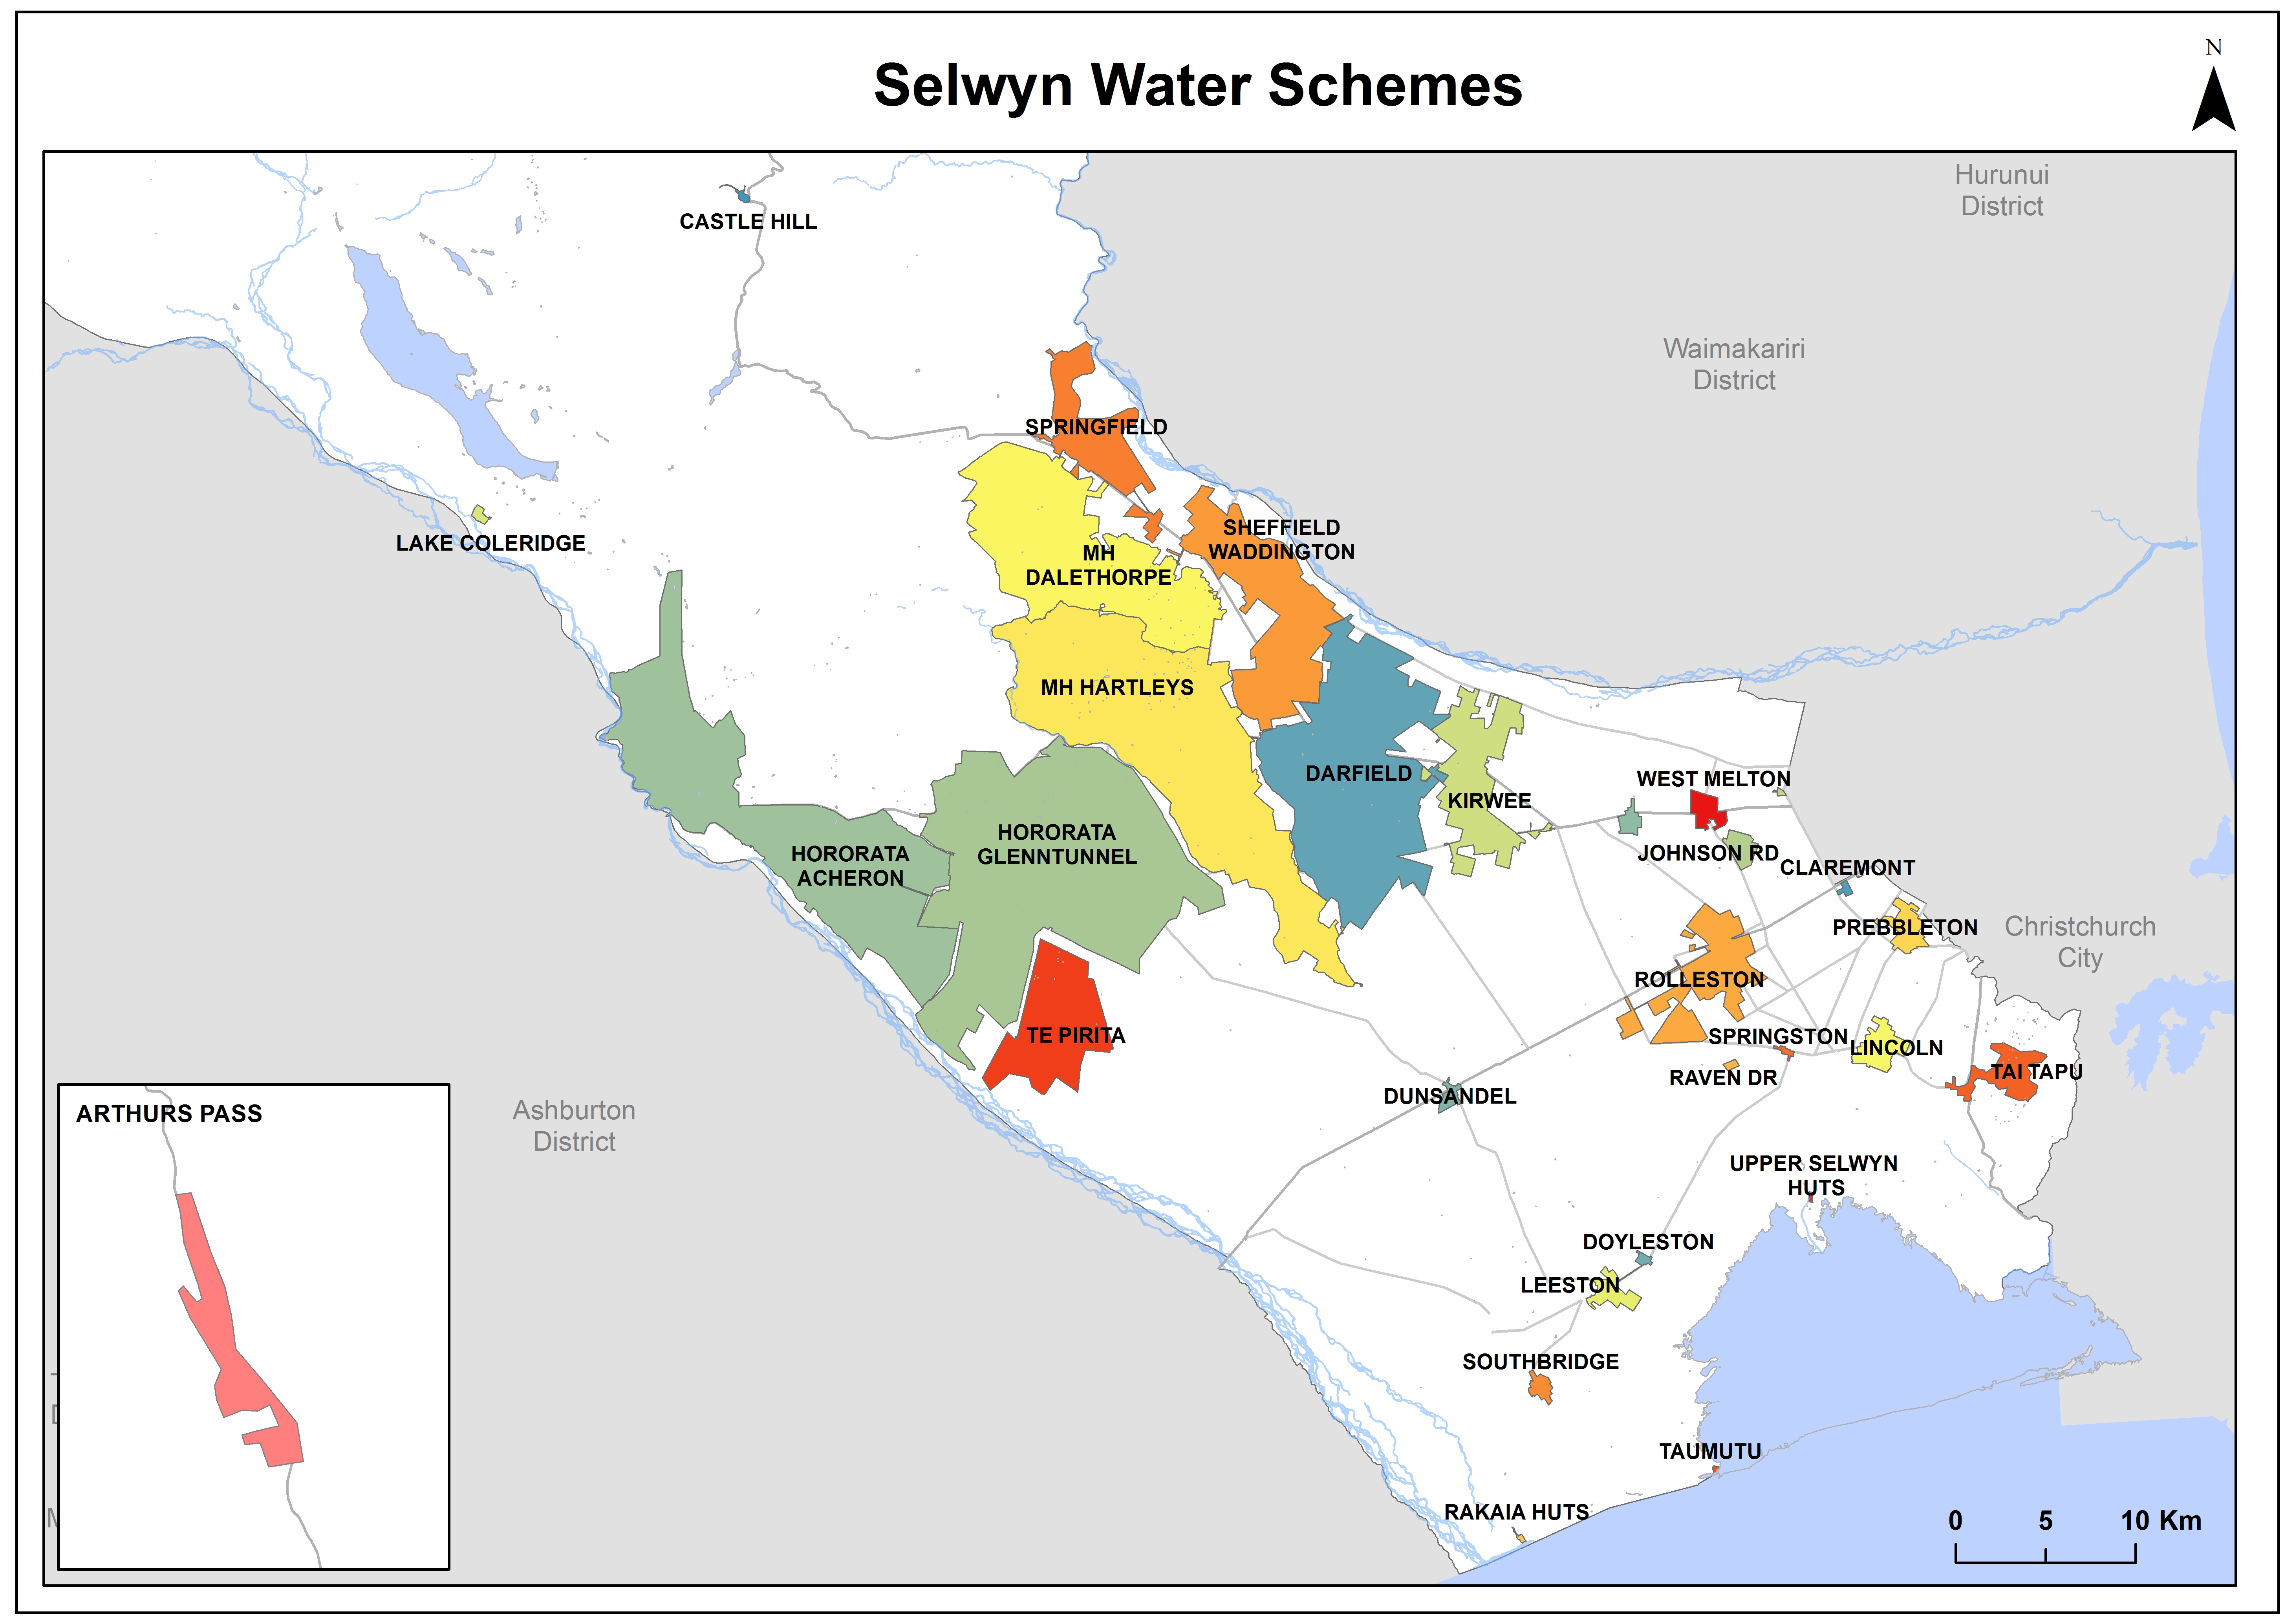
Figure 3‑2 Location of Selwyn Water Schemes
The diverse geographic supply location brings with it the need to provide water that meets the particular communities needs. For example:
- Arthurs Pass is frost prone and has a high tourist and bach population. Water for outdoor needs is not required; whereas
- Rolleston has a dense urban population, with large recreation reserves and highly permeable soils. Water use is high in summer, driven by long periods of north-west wind conditions.
A summary of the 28 water supplies is provided below in Table 3‑2.
Table 3‑2 Summary of Water Schemes
Acheron Water Supply
| 21
(+218 restricted)
| $6,997,173
| $563
| 623
|
Arthur's Pass Water Supply
| 120
(+3 restricted)
| $872,883
| $560
| 67
|
| Castle Hill Water Supply | 131
| $2,696,878
| $291
| 140
|
Claremont Water Supply
| 54
(+5 restricted)
| $687,006
| $701
| 153
|
Dalethorpe Water Supply
| 101 connections (405 units)
| $4,711,133
| $351
| 389
|
Darfield Water Supply
| 1,026
(+302 restricted)
| $22,277,513
| $111
| 1,893
|
Dunsandel Water Supply
| 172
(+4 restricted)
| $1,906,696
| $319
| 336
|
Hartleys Road Water Supply
| 120
(+3 restricted)
| $10,867,661
| $351
| 1,029
|
| Jowers Road Water Supply | 18
| $189,054
| $1,475
| 32.9
|
| Kirwee Water Supply | 357
(+101 restricted)
| $5,920,750
| $156
| 606
|
| Lake Coleridge Water Supply | 58
(+1 restricted)
| $1,077,802
| $1,033
| 26
|
| Leeston/Doyleston Water Supply | 1,033
(+19 restricted)
| $6,553,418
| $125
| 948
|
| Lincoln Water Supply | 2,544
(+28 restricted)
| $13,555,301
| $67
| 2,484
|
| Prebbleton Water Supply | 1,555
(+39 restricted)
| $10,218,050
| $108
| 1,993
|
| Rakaia Huts Water Supply | 113
| $563,424
| $370
| 107
|
| Raven Drive Water Supply | 12
| $347,971
| $2,388
| 17
|
| Rolleston Water Supply | 6,541
(+6 restricted)
| $50,877,472
| $78
| 8,684
|
| Hororata Water Supply | 59
(+47 restricted)
| $11,722,760
| $563
| 1,217
|
|
Sheffield/Waddington Water Supply | 157
(+46 restricted)
| $4,384,297
| $371
| 310
|
| Southbridge Water Supply | 346
(+8 restricted)
| $2,589,558
| $201
| 345
|
| Springfield Water Supply | 176
(+31 restricted)
| $4,139,463
| $496
| 458
|
Springston Water Supply
| 189
| $1,229,603
| $325
| 162
|
| Tai Tapu/Otahuna Water Supply | 212
(+58 restricted)
| $3,006,685
| $376
| 404
|
| Taumutu Water Supply | 16 connections
| $131,279
| $1,357
| 12
|
| Te Pirita Water Supply | 9
| $1,952,998
| $2,448
| 170
|
| Upper Selwyn Huts Water Supply | 97 connections
| $166,452
| $237
| 29
|
| Greater West Melton Water Supply | 856
(+8 restrictied)
| $9,909,651 | $265
| 1,283
|
3.1.3 Key Issues
The following key issues have been identified across the Councils water schemes. Issues within each individual scheme is provided in Volume 2 of the AcMP. And issues common to one or more of the schemes are cited below in Table 3‑3.
Table 3‑3 District Wide Key Issues
Water Management
| The regional focus on wise use of water is being reflected in demand management based consent conditions. |
| Water quality upgrades and the associated capital burden on applicable communities | This is driven by WSPs and the underlying Drinking Water Standards 2005 (revised 2018).
|
| The need for more source water in growth areas, especially Eastern Community in urban areas. | The District continues to experience strong growth, which results in increasing water demand.
|
| Operations and Maintenance costs of assets | Driven by increasing costs of contractors, compliance requirements and addition of new assets to service growth.
|
| Long travel times | Are a significant issue for Council in the remote schemes
|
| Continued focus on criticality and improving asset knowledge | Asset management requires complete data. Including a need to maintain condition assessments and calculate advanced renewal profiles. |
3.1.4 Operations and Maintenance
Council has three full-time water supply operations staff (a drinking water quality scientist, a water engineer and a contract supervisor), who run the water supply schemes within the district. These staff members are supported by projects engineers, a SCADA engineer and two admin staff who work across the other 5Waters schemes.
Under contract
C1241 Water Services Network Management Contract scheduled and reactive maintenance work is undertaken by SICON for Council water supplies. This contract was approved by Council on the 22th June 2016 for a period of 1 July 2016 to 30 June 2021. Contract negotiations are underway for the renewal of the contract. The new contract rates have been integrated into budgets.
3.1.5 Demand and Capacity
High growth in the eastern urban townships including Rolleston, Lincoln, West Melton, Leeston and Prebbleton is driving the need for more public drinking water from these townships sources – both at existing and new sites.
3.1.5.1 Current Demands
As schemes vary in size from less than 10 connections to over 7,000 connections, the individual water scheme needs also differ. However when looking at a per person demand (litres per person per day) is it clear that the smaller schemes use more water than the larger ones. This is shown by Figure 3‑3 below for 1st January to 31st December 2014, note that the rural schemes have been excluded as this skews the graph. The rural schemes are Malvern Hills, Hororata Acheron and Te Pirita which used 3.84, 23.85 and 16.97 m3 per connection per day respectively.
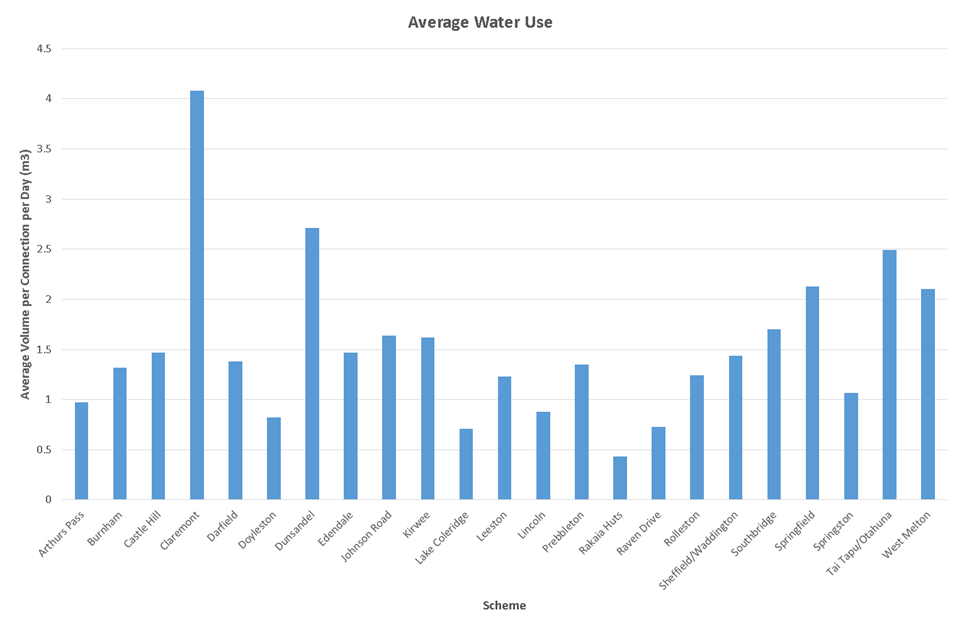
Figure 3‑3 Average Water Use per Scheme
3.1.65.2 Future Demand
Future demand considerations must be take into consideration:
- Existing resource consents and their flow rate limitations;
- Existing pumping capacity;
- Existing peak flow and future flow requirements; and
- Increase or decrease in population/number of dwellings.
Council have a key performance indicator targeting the average consumption of drinking water per resident per day. This has been set at 0.5 m3 per person per day within urban schemes for 2021/22. with a falling target in subsequent years. While not formally adopted by Council this is considered a reasonable first step in working towards the wise use of water.
3.1.6 Water Resource Consents Summary
This section identifies the type and scale of public water supplies in the district.
The majority (68%) of public water is sourced from the Waimakariri zone. This provides 85% of the daily consented water volume (volumes have been annualised where necessary). This is shown below in Figure 3‑4 and Figure 3‑5.
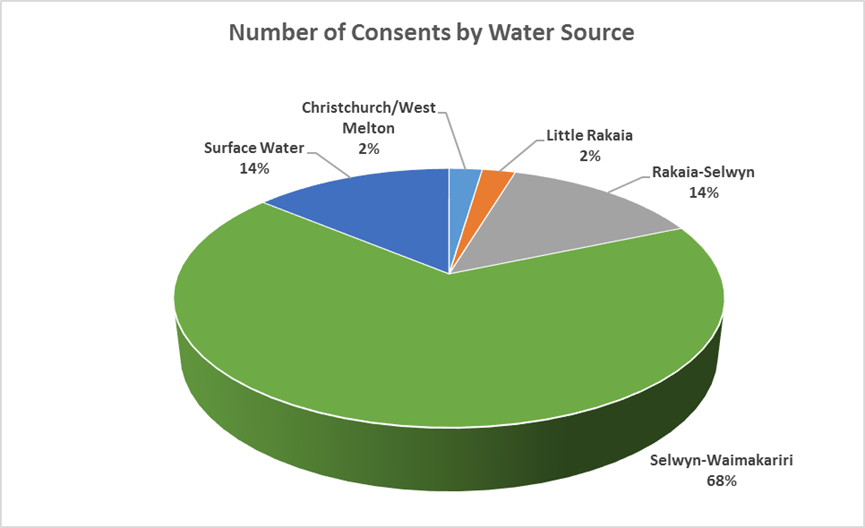
Figure 3‑4 Water Consents by Water Source
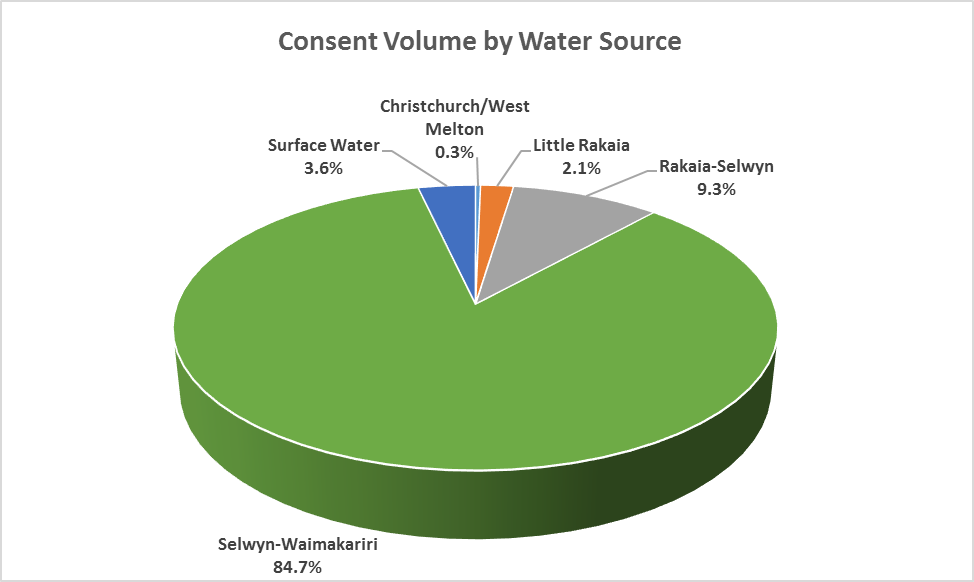
Figure 3‑5 Water Consent Volume by Water Source
The majority of consented annual volume is for Rolleston, Prebbleton and Darfield (this does not include consents which only have a litres per second take). This shown in Figure 3‑6 below.
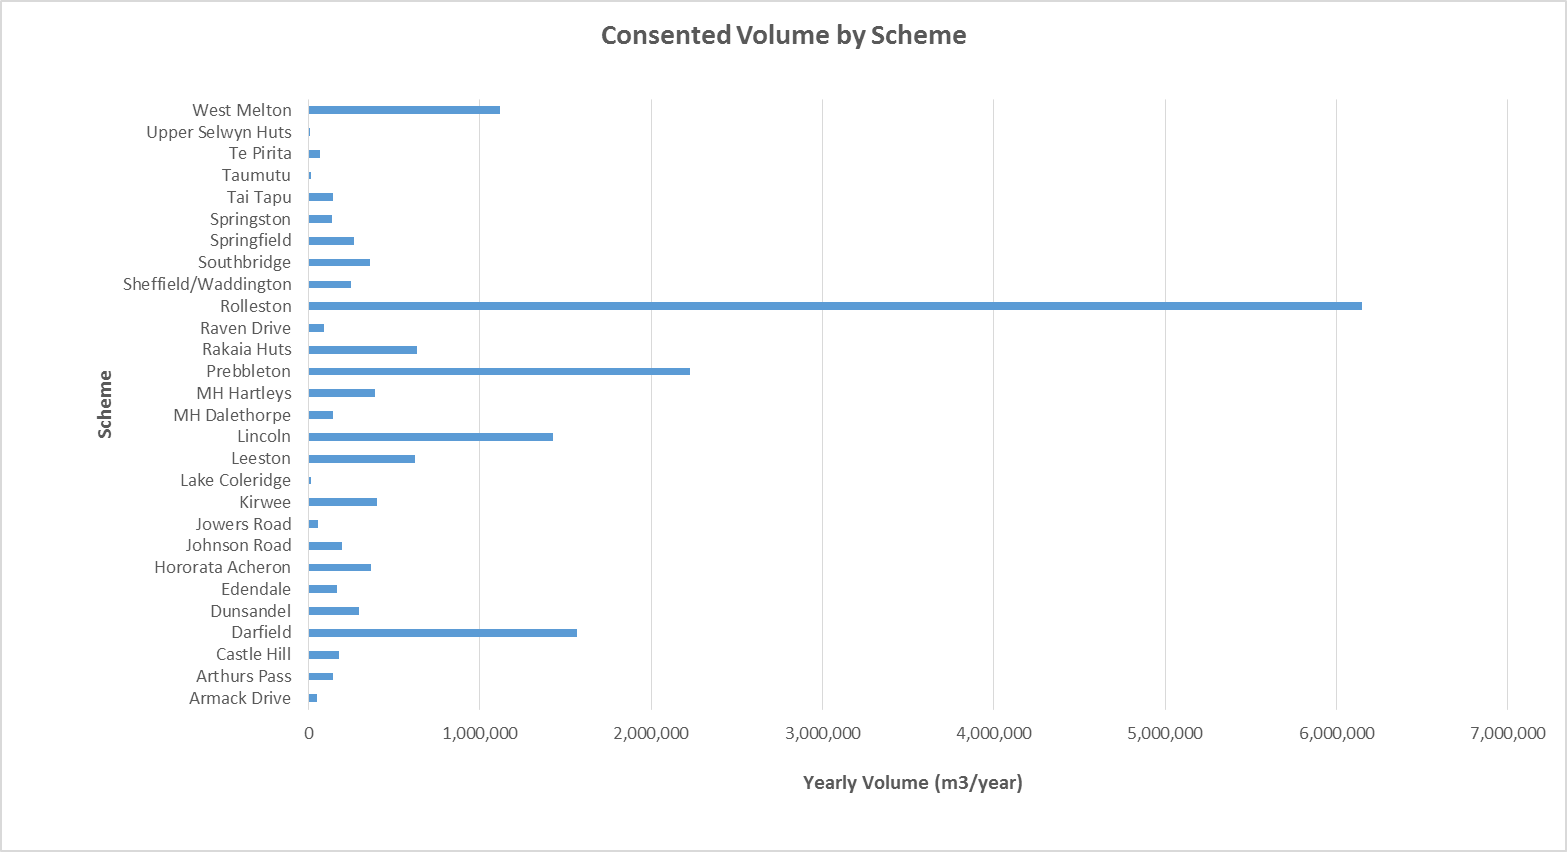
Figure 3‑6 Consented Daily Volume by Scheme
3.1.7 Water Quality
There are 9 river/gallery intakes, 1 lake intake and 49 deeper groundwater takes. The river/gallery and lake sources provide unsecure water with bacteria and silt from time to time. Water Safety Plans (WSPs) aim to address these relatively poor water quality schemes.
The WSPs are scheduled for review every five years. The completion of WSPs does not necessarily mean there will be a change in water grades. Instead acceptance of risk through the WSP is an acknowledgement by the community and Council that they will carry some risks and deal with others through financial and Council resources. In effect the WSP prioritises work by the level of risk it poses to human health.
Source, treatment plant and reticulation water is regularly tested for the presence of bacteria. Results for the period 2012-2020 are provided in Figure 3‑7, Figure 3‑8 and Figure 3‑9. These results are a reflection that the water supply communities generally have access to high quality water.
Figure 3‑7 Source Sampling and Bacteria Transgressions
Figure 3‑8 Treatment Plant Sampling and Transgressions
Figure 3‑9 Reticulation (Zone) Sampling and Transgressions
Turbidity is also sampled for the water schemes. Turbidity has a 'guidance value for aesthetic determinants' set at 2.5NTU.
3.1.8 Bore Pumps
The water supplies located on the Selwyn plains area rely on pumped systems to take deep groundwater either direct into the network and/or to surface reservoirs. Pumping capacity is limited by the rate (litres per second) specific to each scheme's resource consent.
Council has a focus on making the most efficient match of pumps and pumping systems to the water demand of each community. Variable speed drive systems are used extensively to:
- Reduce the pump start up energy load on the mainline network; and
- Minimise the energy used to meet customer water needs.
In more alpine areas, such as Arthurs Pass, gravity conveyance of water from the steep surrounding catchments is used to provide water to customers.
3.1.9 Water Treatment
23 of 27 schemes are located in the plains area, where deep generally secure groundwater can be obtained.
In the shallow unsecure water schemes, Council uses filtration, ultra violet light (UV) and chlorination treatment systems to reduce the likelihood of source water organisms entering the community water network.
Details of treatment are provided in Volume 2 at a scheme level however, a summary is provided below. This summary identifies which sources have permanent barriers installed to make water safe to drink i.e. in their normal operation. During transgression events, chlorination may be used in addition to existing treatment where applicable. Refer table Table 3‑4 below for a summary of treatment systems for each water supply.
3.1.10 Water Quality and Chlorination
Selwyn District Council is committed to providing our communities with safe drinking water.
The Council currently uses a variety of water treatment methods for its 27 water supplies and all supplies have Water Safety Plans which are approved by the Canterbury District Health Board. Treatment methods used in various supplies include secure ground water (to meet current New Zealand Drinking Water Standards), Ultraviolet (UV) disinfection, selective abstraction, filtration, and chlorination. For more information on the ways that we treat water, visit:
https://www.selwyn.govt.nz/services/water/water-supplies/water-quality-in-selwyn-district
Below are some answers to common questions about chlorination.
Why would SDC want to add chlorine to our water?
We want to make sure that everyone in the Selwyn District has safe drinking water. The Health Act makes SDC responsible for providing a safe and wholesome drinking water supply and to do everything practicable to meet the NZ Drinking Water Standards.
On the 20 December 2017 The Director-General of Health issued
a formal statement reminding water suppliers of their statutory responsibilities set out in the Health Act 1956.
The formal statement recommends reconsidering reliance on 'secure bores' and warns that the public risk is increased if drinking-water is untreated. Councils and DHBs have been advised to seek information from public health units on the need to disinfect any drinking-water supply that is currently not being treated. The Ministry strongly advises water should be treated, with chlorination the safest treatment option.
We already have UV treatment so why do we need chlorine too?
UV (ultra violet light) treats the water where it enters our supply network. It is very effective as long as the water is not turbid (discoloured). UV treatment does not treat the water once it is in our reservoirs and pipes.
There is always the potential for contaminants to get into the water reticulation system, for example through cracks in the reservoir, broken pipes – tree roots growing through pipes are a potential problem, as are unlawful connections from households where people do their own plumbing. A chlorine residual provides protection against this type of contamination.
How much chlorine will you use?
As little as possible to keep your water safe. Typically we will use a dose of 1.0 - 0.5mg of chlorine for every litre of water. This will give a residual dose of 0.3mg per litre in what comes through your taps.
I've heard that chlorine is unsafe – is that true?
Chlorine has been used safely all over the world for around 120 years. It keeps millions of people all round the world – including most of New Zealand – safe from waterborne illness.
The amount of chlorine dosed into the water supply will be carefully managed to ensure levels of chlorine in the water people drink are absolutely minimised.
In a small number of people chlorine can be an irritant for an existing condition such as asthma or eczema. If you feel your skin getting dry or itchy use moisturiser after having a shower or bath. If you notice increased skin irritation, asthma symptoms or other symptoms – seek medical advice from your GP.
The use of filters will mitigate any risks for those on dialysis. This can be arranged by the Canterbury District Health Board.
I don't like the taste of chlorinated water. Is there anything I can do?
If you are concerned about the taste, you can either:
-
Fill a jug of water and leave it on the bench or in your fridge overnight. The chlorine will dissipate naturally over a few hours. or
-
Install an under-bench filter. Chlorine and any associated by-products can removed by using a granulated, activated carbon (GAC) filter. These are available from hardware supplies stores and water filter companies.
I don't want to shower or wash my clothes in chlorinated water – what can I do?
You can buy a carbon filter that attaches to your water supply where it enters your property. It will remove all the chlorine from the water to your home.
Pets
If you have fish in outside ponds you will need to either turn down in-coming water to an absolute trickle (this dilutes the chlorine level to a safe amount for your fish), or fill up drums of water and let them sit for at least 24 hours before using (the UV of the sun evaporates chlorine).
For fish tanks or bowls inside, fill up a container of water and let it sit for at least 24 hours and then only replace 1/3 of this water at a time with what is in the tank already. If you're still worried, you can buy de-chlorinating kits (sodium thiosulfate) at pet supplies stores.
What are the Drinking Water Standards?
The Drinking Water Standards for New Zealand are issued by the Ministry of Health(external link) under the Health Act and set out the requirements water suppliers need to meet to provide safe water to their communities. The standards specify:
-
Maximum amounts of substances, organisms, contaminants and residues that may be present in drinking water.
-
Criteria for demonstrating compliance with standards.
Remedial action to be taken in the event of non-compliance with standards.
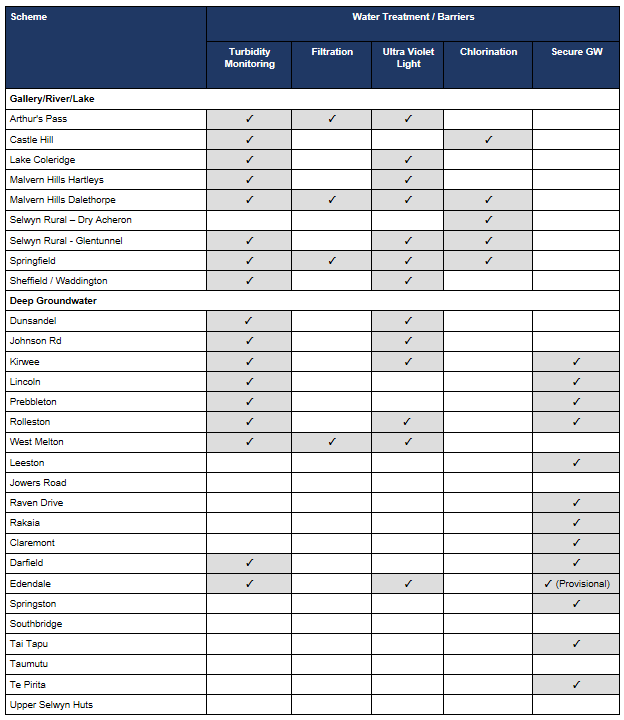
Table 3‑4 Public Water Supply Treatment Devices (normal operation)
3.1.11 Reservoirs
Council has above and below ground water storage. Above ground storage reservoirs are timber, concrete and plastic material and are reasonably durable. Below ground aquifer systems are considered to be a secure and appropriate type of storage, though with increasing catchment abstraction, monitoring of recharge and well levels is required.
The philosophy that below ground storage via the aquifer is appropriate comes with the:
- Risk that the aquifer yields not remain constant; and
- Requirement that adequate and resilient redundancy in surface pumping and electrical systems is available; and
- Above ground storage is provided in steel reinforced concrete and wire band timber tanks.
Above ground storage is employed to:
- Ensure sufficient water is available over peak demand periods. A normal peak demand period is 2-5 hour, over which time the reservoir water is rapidly drawn down. Councils target storage for new schemes is 8 hours at peak demand. Existing schemes are configured to utilise ground and surface storage, pipe capacity and reservoirs; and
- Allow for lower rates of water source take, and stop oversizing of mainline pipes and pumping systems ; and
- Provide fire flow requirements, where a set volume of water is reserved for fire flow needs.
A review of all Councils public water supply reservoirs was undertaken after the September 2010 Greendale earthquake. This review identified there was no severe damage which required urgent attention, but repairs were needed. These repairs have either been completed or are planned.
3.1.11 Water Storage for Fire Fighting
New Zealand Fire Service Firefighting Waters Supplies Code of Practice “The Code" is a publicly available specification published by Standards New Zealand (SNZ PAS 4509:2008). It provides criteria around what constitutes a sufficient minimum supply of water pressure and volume for firefighting in structures in Urban Fire Districts. A Code such as this is non-mandatory but can be incorporated into relevant bylaws or district plans. Council have
not incorporated it into the 2008 Water Supply Bylaws. The Code is not necessarily relevant to water supplies in rural areas. However, Council may wish to use some aspects of the Code as a guide. The Code includes guidance on provision of alternative firefighting water sources that may be appropriate to rural firefighting needs.
Council works with FENZ to determine firefighting water requirements throughout the district. The table below provides an indication of the firefighting water requirements for each urban area in Selwyn District.
Darfield
Dunsandel
Kirwee
Leeston
Doyleston Lincoln Prebbleton Rolleston Sheffield/Waddington
Southbridge Springfield
Springston Tai Tapu
West Melton
| There are urban areas, most of which have local volunteer fire brigades. It would be appropriate for Council to provide a fire fighting water supply in general accordance with the Code.
It should be possible to meet FW2 Code requirements for the urban areas served by Council water supplies. It may be possible to provide a higher standard for business zones in the larger towns. Izone should be targeted for provision of a higher level of fire fighting water supply. |
Arthur's Pass Castle Hill Lake Coleridge Rakaia Huts
| Arthur's Pass and Lake Coleridge have Volunteer Rural Fire Forces (VRFF). These towns are served by mains pressure water supplies.
Where practicable, Council should seek to meet FW2 Code requirements for the Living Zone areas served by the community water supply. Hydrants should be provided within the prescribed distances of structures even if flows and volumes cannot be provided or sustained for the desired period.
|
Armack Drive Branthwaite Drive Edendale
Taumutu Templeton (Claremont) Upper Selwyn Huts | These small rural communities are typically rural-residential subdivisions served by very small mains pressure water supplies that will not be able to provide adequate flows for fire fighting.
The provision of hydrants, tanker filling points and identification of alternative water sources are options to facilitate fire fighting, even if only in a limited way. Private on-site storage, or community storage may be appropriate.
|
Burnham Jowers Road Johnson Road Raven Drive | These small rural communities are typically rural-residential subdivisions served by low-pressure water schemes supplying tanks on each property.
The provision of hydrants, tanker filling points and identification of alternative water sources are options to facilitate fire fighting, even if only in a limited way. Private on-site storage, or community storage may be appropriate. |
Whitecliffs, Glentunnel, Coalgate (MHRWS) Hororata (Selwyn RWS)
| Hororata and Coalgate have auxiliary volunteer rural fire brigades. These towns are supplied from rural water schemes supplying tanks on each property.
The provision of hydrants, tanker filling points and identification of alternative water sources are options to facilitate fire fighting, even if only in a limited way. Private on-site storage, or community storage may be appropriate. |
Darfield (rural)
Kirwee (rural) Leeston (rural) Malvern Hills RWS (excl towns) Selwyn RWS (excl. towns) Sheffield/Waddington (rural) Springfield (rural) Tai Tapu (Otahuna) Te Pirita RWS
| These small communities and rural areas have rural water schemes providing low pressure water to tanks on each property. Some are an extension of the local town supply.
The provision of hydrants, tanker filling points and identification of alternative water sources are options to facilitate fire fighting, even if only in a limited way. Private on-site storage, or community storage may be appropriate.
|
3.1.12 Risk Assessment
A risk assessment has been undertaken for Water Supplies. The key output from the risk assessment is the identification of any extreme and high risks which need to be mitigated. In order to mitigate these risks they have been included and budgeted for in the projects within the LTP. The list of business wide risks is in Section 9.2 and scheme wide risks are listed in 5Waters Activity Management Plan: Volume 2. Table 3‑7 below outlines the risk priority rating and Table 3‑8 lists the scheme wide risks.
Table 3‑7 Risk Priority Rating
| > 50 | Extreme | Awareness of the event to be reported to Council. Urgent action to eliminate / mitigate / manage the risk. Document risk and action in the AMP. |
| 35-50 | Very High | Risk to be eliminated / mitigated / managed through normal business planning processes with responsibility assigned. |
| 14-35 | High | Manage risk using routine procedures. |
| 3.5-14 | Moderate | Monitor the risk. |
| < 3.5 | Low | Awareness of the event to be reported to Council. Immediate action required to eliminate / mitigate / manage the risk. Document risk and action in the AMP. |
Table 3‑8 Risks – Water Supplies
| Inaccurate asset data causes inaccuracies in valuations and renewals programs | Carry out P&E inventory checks on assets
| 2014
| 20
| 20 | 20 |
| Increasing number of easements | Document easements
| 2014 | 12 | 12 | 12 |
| Lack of bore and reservoir turnover | Review bore and reservoir turn over
| 2014 | 27 | 27 | 12
|
| backflow contamination | Staff project for inspections | 2017 | | 40 | 20 |
| SCADA upgrade | Network SCADA Upgrade | | | 20 | 10 |
| Water quality does not meet DWSNZ | Review treatment and upgrade as required | 2017 |
| 40 | 7
|
3.1.13 Funding Program
Section 11.0 provides the financial summary and details the funding and expenditure across the 5Waters activities. An overall summary of the funding program for the water supply activity is outlined within this section.
The 10 Year financial programme for the 5Waters is divided into the following categories:
- Expenditure – Operations and Maintenance;
- Projects – either specific or jointly funded;
- Capital Projects - result in new assets; and
- Renewals - replacement of assets on a like for like basis within a 20 year horizon.
Table 3‑9 and Figure 3‑10 outline the budget for the water supply activity for the next 10 years.
Table 3‑9 Water Supply Budget Summary
| Year 1 | $4,586,606
| $3,742,709
| $558,500
| $10,875,806
|
| Year 2 | $4,730,201
| $3,742,709 | $575,561
| $10,005,122
|
| Year 3 | $4,826,952
| $3,742,709 | $307,000
| $5,981,358
|
| Years 4 to 10 | $36,501,843
| $24,233,963
| $1,364,000
| $17,533,653
|
|
Total |
$50,645,602
|
$35,462,090
|
$2,805,061
|
$44,395,939
|
Figure 3‑10 Water Supply Financial Summary
3.1.13.1 Shared Projects
There are a number of shared projects for water. Shared projects are projects across one activity which share the costs across all schemes as they all receive the benefit.
The list of scheme specific projects can be found in Volume 2: Water Supplies.
Table 3‑10 Key Shared Projects
Capital Projects
| 400090036
| Backflow
| $19,920
| $50,000
| $50,000
| $800,000
| 100% LoS
|
Capital Projects
| -
| Reservoir upgrades
| -
| -
| -
| $200,000
| 100% LoS
|
Capital Projects
| 400090039
| Water metering
| $200,000
| -
| -
| -
| 100% LoS
|
Capital Projects
| -
| Implement findings of pressure plan
| -
| -
| $200,000
| -
| 100% LoS
|
Capital Projects
| -
| Security upgrades at all sites
| -
| $100,000
| -
| -
| 100% LoS
|
Projects
| -
| Groundwater quality monitoring to give early warnings of water quality issues
| $30,000
| $10,000
| $10,000 | $70,000
| 100% LoS
|
Capital Projects
| -
| Chlorination
| $1,000,000
| -
| -
| -
| 100% LoS
|
Capital Projects
| -
| Review bulk water extraction process and implement findings
| -
| -
| -
| $300,000
| 100% LoS |
* LoS refers to Level of Service; G refers to Growth
3.2 Wastewater
This section describes the wastewater activity. Further detail on the schemes is provided in Volume 3: Wastewater.
3.2.1 Description of the Activity
The Council is responsible for 14 reticulated wastewater systems that service 63% of properties within the district, shown in Figure 3‑11. Reticulated community wastewater schemes have been provided where:
- Unsanitary conditions were created through high groundwater conditions and/or urban growth; and
- Sale of Crown operations to Council required that a reticulated scheme be provided for, e.g. Arthurs Pass and Lake Coleridge.
The wastewater schemes have a replacement value of approximately $311M (excluding land value). Overall there are 54 pump stations and 8 wastewater treatment and disposal plants. The total length of the reticulation is 574 km, varying in diameter from DN50 to DN600.
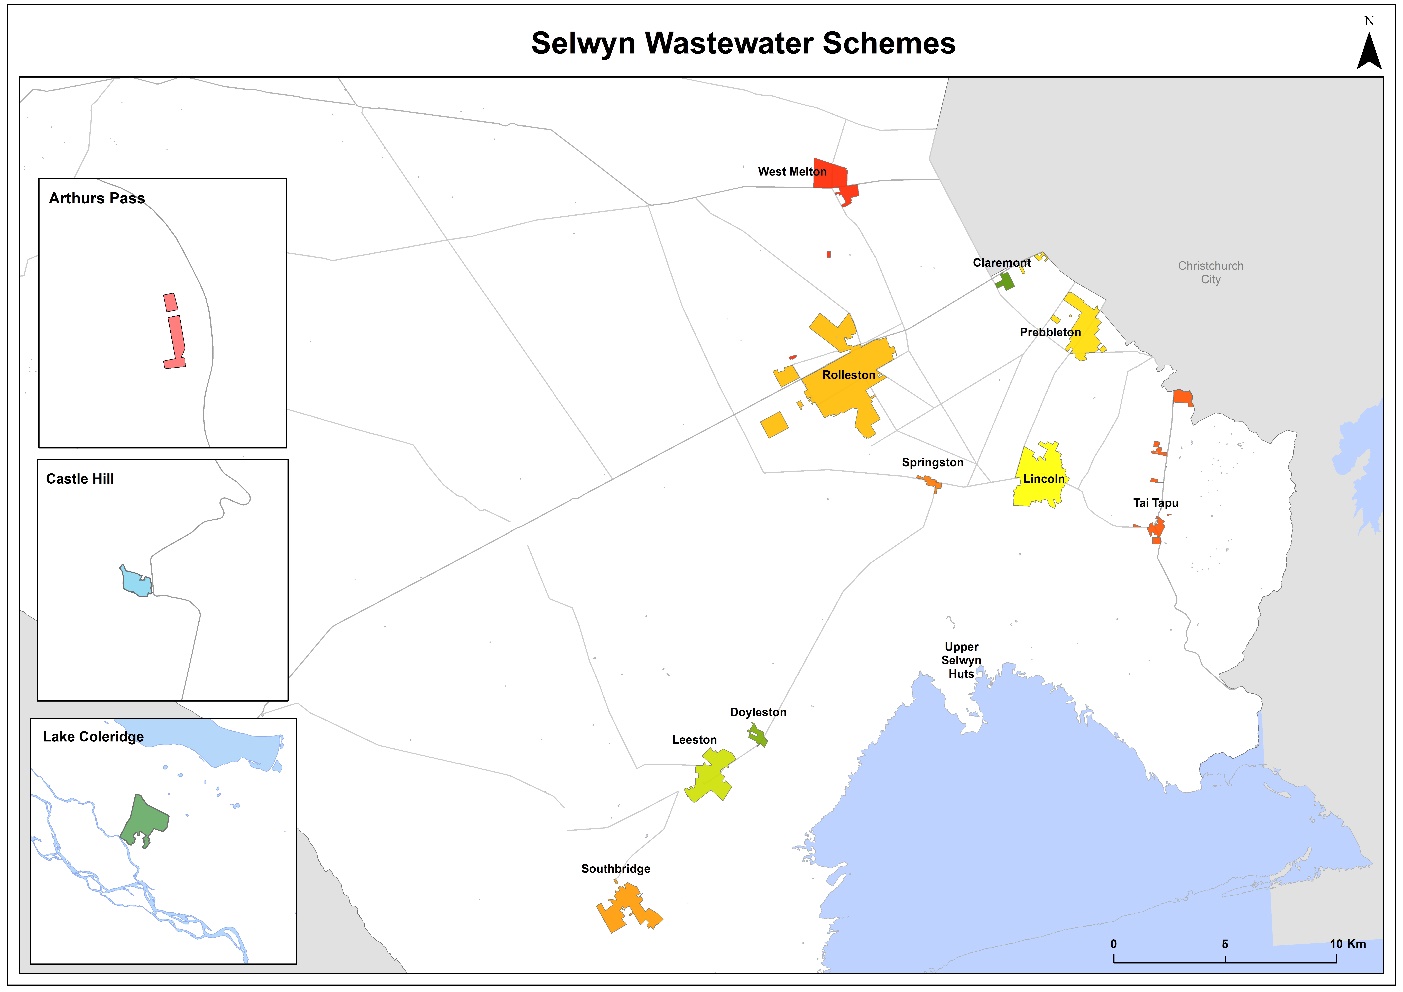
Figure 3‑11 Location of Wastewater Systems
Council also used to operate 2 septage pits – Ardlui Road and Bleakhouse Road. These take septic tank (household and small business) wastewater. Council is investigating wastewater management options for Darfield and Kirwee, which currently rely on individual onsite treatment and disposal systems. These schemes are discussed in Volume 3: Wastewater at a scheme level. Wastewater effluent discharge quality must be within Councils Wastewater Bylaw 2008 criteria. Outside these standards, the discharger is covered by Tradewaste Bylaw criteria.
A summary of the wastewater schemes is provided below in Table 3‑11.
Table 3‑11 Summary of Wastewater Schemes
Arthur's Pass Wastewater Scheme
| 9
| $304,471
| $6,024
|
| Castle Hill Wastewater Scheme | 134
| $4,998,794
| $76
|
| Claremont Wastewater Scheme | 49
| $2,566,534
| $1,003
|
Doyleston Wastewater Scheme
| 113
| $2,025,568
| $381
|
| Eastern Selwyn Sewer Scheme | -
| $66,919,041
| $119
|
| Ellesmere Sewer Scheme | -
| $4,309,666 (P&E only)
| $258
|
| Lake Coleridge Wastewater Scheme | 51
| $1,573,791
| $1,297
|
| Leeston Wastewater Scheme | 874
| $15,310,917 (excluding P&E)
| $101
|
| Lincoln Wastewater Scheme | 2,520
| $56,108,676
| $81
|
| Prebbleton Wastewater Scheme | 1,502
| $28,780,428
| $105
|
| Rolleston Wastewater Scheme | 6,338
| $88,879,203
| $46
|
| Septage Disposal Facilities | -
| - | - |
| Southbridge Wastewater Scheme | 327
| $9,412,187
| $166
|
| Springston Wastewater Scheme | 177
| $5,013,825
| $145
|
| Tai Tapu Wastewater Scheme | 210
| $6,006,183
| $136
|
| Upper Selwyn Huts Wastewater Scheme | 97
| $942,462
| $243
|
| West Melton Wastewater Scheme | 692
| $10,661,568
| $76
|
3.2.2 Key Issues
The following key issues have been identified across the Councils wastewater schemes. Issues within each individual scheme is provided in Volume 3 of the AcMP. Issues common to one or more of the schemes are below in Table 3‑12.
Table 3‑12 District Wide Key Issues
High Infiltration and Inflow rates
| Leeston, Lincoln, Springston, Upper Selwyn Huts |
Te Waihora Water Conservation Order (2011) strengthened protection of cultural values and the Land and Water Plan requirements
| Upper Selwyn Huts treatment and disposal system is installed on the lake edge with consent due to expire. |
Renewals
| Costs for asset replacement in high groundwater areas have increased Upper Selwyn Huts reticulation are Grade 5 (very poor) condition |
| Capital Works - ESSS | Financing Pines Extension |
| Darfield-Kirwee | High growth is predicted for Darfield. A wastewater system is programmed for year13 of the LTP. |
| Septage Sites – Ardlui and Bleakhouse | Sites now closed and require remediation. |
| Long travel times | Are a significant issue for Council in the remote schemes |
3.2.3 Operations and Maintenance
Council has two full time wastewater operations staff (an engineer and a contract supervisor), who run the wastewater schemes within the district. These staff members are supported by projects engineers, a SCADA engineer, and two admin staff who work across the other 5Waters schemes.
Under contract
C1241 Water Services Network Management Contract scheduled and reactive maintenance work is undertaken on these supplies. This contract was approved by Council on the 22th June 2016 for a period of 1 July 2016 to 30 June 2021. Contract negotiations are underway for the extension of the contract. The new contract rates have been integrated into the budgets. Telemetry is heavily relied upon to provide early warning of scheme faults.
3.2.4 Demand and Capacity
High growth in the eastern urban townships including Rolleston, Lincoln, West Melton and Prebbleton is driving the need for upgrades and expansion of the existing treatment plants
3.2.5 Treatment Plants Summary
An overview of the eight wastewater treatment plants is provided below in Table 3‑13 below with a brief outline of the treatment plants further below. Specific scheme details are provided in Volume 3: Wastewater.
Table 3‑13 Selwyn Sewer Treatment Plants
| Arthurs Pass |
Community Treatment Plant |
| Castle Hill |
Community Treatment Plant |
Claremont
|
Community Treatment Plant |
| Doyleston |
Leeston - pumped to Leeston, treated and disposed of via “Ellesmere" WWTP |
| Lake Coleridge |
Community Treatment Plant |
| Leeston |
Ellesmere Community Treatment Plant Multi staged maturation ponds followed by border-dyked irrigation. When groundwater is high, discharge is to drains via ground filtration basins. Consents expire 2029. In the 2021-31 LTP, Council have consulted on the proposal to pipe wastewater from Ellesmere WWTP to Pines WWTP.
|
| Lincoln |
Eastern Selwyn Sewer Scheme – pumped to Rolleston, treated and disposed of via “Pines" WWTP |
| Prebbleton |
Eastern Selwyn Sewer Scheme – pumped to Rolleston, treated and disposed of via “Pines" WWTP |
| Rolleston |
Eastern Selwyn Sewer Scheme – pumped to Rolleston, treated and disposed of via “Pines" WWTP |
| Southbridge |
Leeston - pumped to Leeston, treated and disposed of via “Ellesmere" WWTP |
| Springston |
Eastern Selwyn Sewer Scheme – pumped to Rolleston, treated and disposed of via “Pines" WWTP |
| Tai Tapu |
CCC- pumped to Christchurch City, disposal at Bromley/Ocean Outfall |
| Upper Selwyn Huts |
Community Treatment Plant
In the 2021-31 LTP, Council have consulted on a proposal to pipe wastewater from Upper Selwyn Huts to Pines WWTP.
|
West Melton
|
Eastern Selwyn Sewer Scheme – pumped to Rolleston, treated and disposed of via “Pines" WWTP |
3.2.5.1 Eastern Selwyn Sewer Scheme
The Eastern Selwyn Sewer Scheme serves the townships of Rolleston, Lincoln, Prebbleton, Springston and West Melton. Burnham Military Camp will connect in 2021. The purpose of this scheme is to ensure a staged and managed approach to the development of wastewater bulk conveyance, treatment and disposal infrastructure while providing equality in the scheme costs for existing residents, new developments and future generations.
Further details are provided in Volume 3.
3.2.5.2 Templeton Claremont
The Templeton Claremont scheme was installed in 2005, for the 56 lot subdivision created on the Selwyn-Christchurch City boundary. Access to the adjacent City Council network was only available on the basis that Selwyn District “transfer" wastewater connections from another scheme, e.g. reduce Prebbleton wastewater allocation by 56 equivalent connections. This was not possible, with the result that a consented package plant treatment and land irrigation scheme were installed.
Further details are provided in Volume 3.
3.2.5.3 Ellesmere Treatment Plant
The Ellesmere Treatment Plant serves Leeston, Doyleston and Southbridge. Due to increased growth in the area, an assessment of plant performance has found that the amount of wastewater that needs to be treated at the Ellesmere WWTP exceeds the design capacity of the plant by approximately 300 people. As a result, the plant does not always comply with the total nitrogen (TN) discharge to land consent condition. In the 2021 - 2031 LTP, Council have publicly consulted on the option of piping wastewater from Ellesmere to Pines WWTP.
Further details are provided in Volume 3.
3.2.5.4 Tai Tapu Wastewater Scheme
Tai Tapu was provided with a CCC bulk conveyance disposal connection in 1996/1997. Wastewater is pumped to Christchurch City in an untreated form with limitations on flows. A maximum of 279 connections can be made.
Further details are provided in Volume 3.
3.2.5.4 Upper Selwyn Huts Wastewater Scheme
The Upper Selwyn Huts area provides for approximately 39 normally resident people, and during peak periods around 282 people.
The Upper Selwyn Huts wastewater treatment and disposal system is located adjacent to the Selwyn River. During normal operation wastewater is treated in an oxidation pond and discharges to a grassed border dyke area.
The consent for discharge to land expired in 2020 and is currently operating under a s124 continuance. In the 2021 - 31 LTP, Council consulted on a plan to pipe wastewater from Upper Selwyn Huts to Pines WWTP, joining the Ellesmere to Pines pipeline. Council is working with ECan and affected parties to seek an interim discharge consent for the 3 year period until the pipeline can be built. If the pipeline to Pines WWTP goes ahead, the Upper Selwyn Huts WWTP would be decommissioned. The decommissioning plan (if required) would be developed with input from all affected parties.
Further details are provided in Volume 3.
3.2.5.5 Arthurs Pass, Lake Coleridge and Castle Hill Village
These schemes are located within alpine areas and are relatively isolated.
Static growth is predicted for Arthurs Pass and Lake Coleridge. Castle Hill has experienced considerable growth in the past few years, with the addition of at least 44 new houses. The wastewater scheme is now near capacity.
Discharge to sensitive environments – Arthurs Pass (National Park), Castle Hill (reserve) and Lake Coleridge (Rakaia River via tail race) is subject to scrutiny from ECan and the Department of Conservation.
Council are currently underway with an application for a winter discharge consent and land use consent for the Castle Hill WWTP.
Further details are provided in Volume 3.
3.2.5.6 Septage Pits
Council used to operate two septage pits, which take septic tank effluent. Further details are provided in Volume 3: Wastewater.
3.2.6 Wastewater Reticulation
A summary of the material and diameter for the pipes within the reticulation as well as more information about the types of assets for wastewater can be found in Section 7.0, Lifecycle Management.
3.2.7 Risk Assessment
A risk assessment has been undertaken for Wastewater schemes. The key output from the risk assessment is the identification of extreme and high risks which need to be mitigated. In order to mitigate these risks, they have been included and budgeted for in the projects within the LTP. The list of business-wide risks is in Section 9.2 and scheme-wide risks are listed in 5Waters Activity Management Plan: Volume 3. Table 3‑14 below outlines the risk priority rating and Table 3‑15 lists the scheme-wide risks.
Table 3‑14 Risk Priority Rating
> 50
| Extreme
| Awareness of the event to be reported to Council. Urgent action to eliminate / mitigate / manage the risk. Document risk and action in the AMP. |
| 35-50 | Very High | Risk to be eliminated/mitigated/managed through normal business planning processes with responsibility assigned. |
| 14-35 | High | Manage risk using routine procedures. |
| 3.5-14 | Moderate | Monitor the risk. |
| < 3.5 | Low | Awareness of the event to be reported to Council. Immediate action required to eliminate/mitigate/manage the risk. Document risk and action in the AMP.
|
Table 3‑15 Risks - Wastewater
| Increasing number of easements | Document easements | 2014 | 27 | 27 | 6 |
| Cross connections | Backflow protection and overflow review | 2017 | | 40 | 20 |
| SCADA upgrade | Network SCADA Upgrade | 2017 | | 20 | 10 |
3.2.8 Funding Program
Section 11.0 provides the financial summary and details the funding and expenditure across the 5Waters activities. An overall summary of the funding program for the wastewater activity is outlined in this section.
The 10 Year financial programme for the 5Waters is divided into the following categories:
- Expenditure - Operations and Maintenance;
- Projects - either specific or jointly funded;
- Capital Projects - result in new assets; and
- Renewals - replacement of assets on a like-for-like basis within a 20-year horizon.
Table 3‑16 and Figure 3‑12 outline the budget for the wastewater activity for the next 10 years.
Table 3‑16 Wastewater Budget Summary
| Year 1 | $4,813,233
| $2,608,711
| $333,000
| $21,090,041
|
| Year 2 | $4,970,787
| $2,608,711
| $303,495
| $10,740,480
|
| Year 3 | $5,055,730
| $3,918,711
| $372,000
| $26,435,041
|
| Years 4 to 10 | $38,893,357
| $12,685,427
| $1,524,000
| $32,411,570
|
|
Total | $53,733,107
| $21,821,561
| $2,532,495
| $90,677,131
|
Figure 3‑12 Wastewater Financial Summary
3.2.8.1 Shared Projects
There are a number of shared projects for wastewater. Shared projects are projects across one activity which share the costs across all schemes as they all receive the benefit.
Table 3‑17 List of Shared Projects
Projects
| 4600096
| AMS | $35,000
| $35,000
| $35,000
| $245,000
| 100% LoS |
| Projects | 46000100 | AMP Valuation | $14,000
| $14,000
| $14,000
| $98,000
| 100% LoS |
| Projects | 46000981
| Planning and Policy | $80,000
| $80,000
| $80,000
| $560,000
| 100% LoS |
| Projects | 46000986 | Education | $8,000
| $8,000
| $8,000
| $56,000
| 100% LoS |
| Projects | 460090009
| Wastewater Upgrade - Compliance
| $200,000
| $200,000
| $200,000
| $1,400,000
| 100% LoS |
Projects
| 39000172 | Wastewater Investigations
| $106,000
| $75,000
| $145,000
| $235,000
| 100% LoS
|
| Capital Projects | 4600900171
| Wastewater Capital Works
| $3,831,000
| $2,994,000
| $316,000
| $10,599,000
| 100% LoS |
| Capital Projects | 46000171
| Wastewater Management Systems
| $10,000
| $10,000
| $10,000
| $70,000
| 100% LoS |
* LoS refers to Level of Service; G refers to Growth
3.3 Stormwater
The following section describes the stormwater activity. Further detail on the schemes is provided in Volume 3: Stormwater.
3.3.1 Description of the Activity
Council manages 22 stormwater management areas within the Selwyn District. These areas are all urban in nature and have infrastructure in place to collect, convey and dispose of surface water. Many areas also manage stormwater in terms of water quality and quantity. This helps manage surface water in these urban areas that can lead to risks to public health and safety, damage to property and contribute to dangerous road conditions. The stormwater management areas are located between the main divide (Arthurs Pass) and Pacific coast (Rakaia Huts) and do not include rural areas, refer Figure 3‑13 below for the location of the stormwater management areas. The diverse geographic location of the stormwater management areas brings with it the need to provide a range of location-specific stormwater management techniques that meet particular community's needs. For example, rainfall, ground water depths and soils types vary across the district and affect stormwater management.
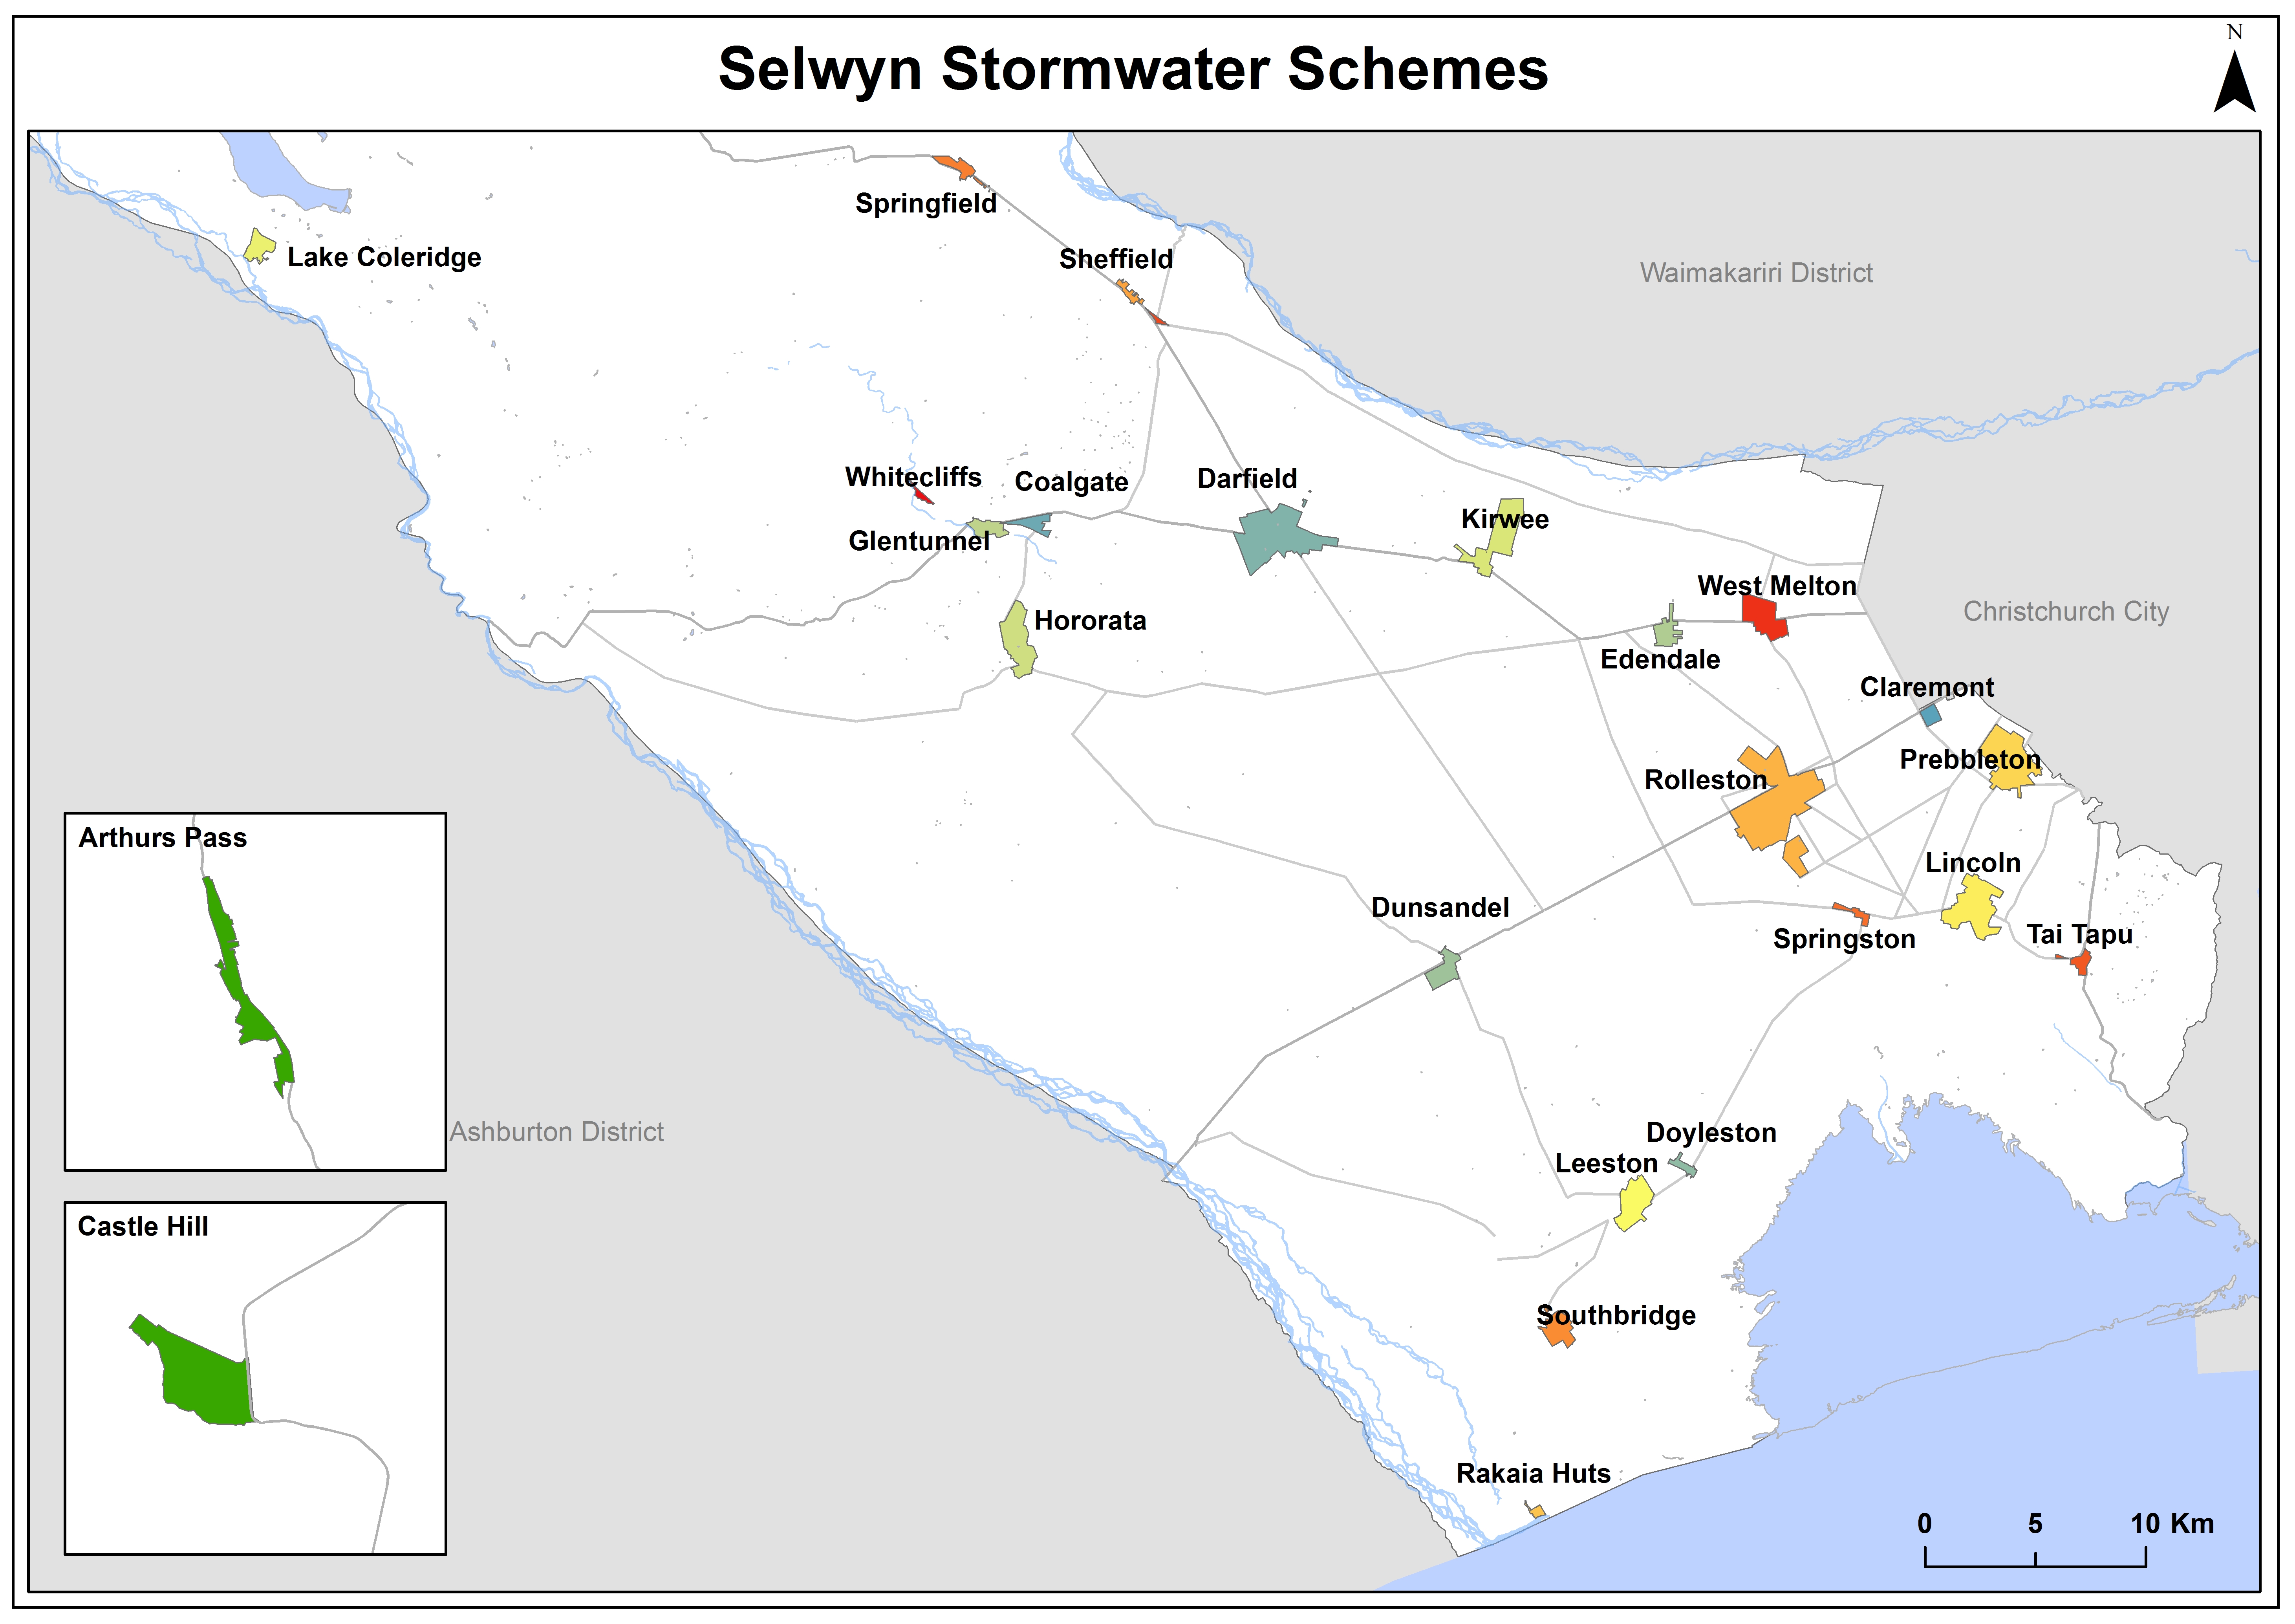
Figure 3‑13 Location of Stormwater Schemes
Figure 3‑14 below shows rainfall varying between 600mm (Lincoln) in the Lower Plains to 4330mm (Arthurs Pass) along the main divide. Rainfall affects the sizing of future devices and the planning for future upgrades.
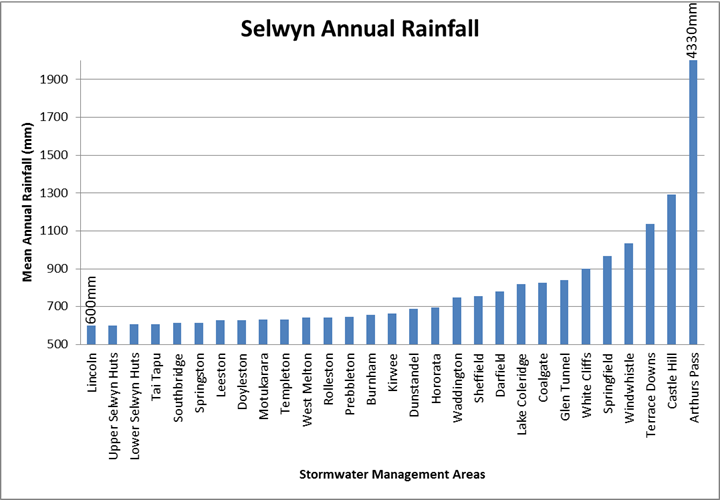
Figure 3‑14 Selwyn Annual Rainfall
Figure 3‑15 shows the depth of ground water varying between near surface (Lincoln) and over 80m deep (Darfield). Groundwater levels affects the selection of stormwater management devices e.g. high ground water sites (Lincoln) are best suited to ponds and wetlands to manage stormwater while areas with low (deeper than 6m) ground water (Rolleston) are best disposed to ground depending on soil types/infiltration rates.
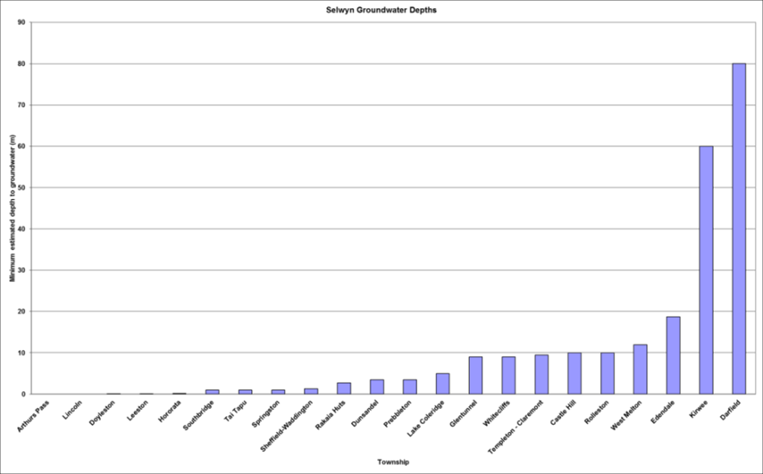
Figure 3‑15 Selwyn Maximum Ground Water Depth
A summary of the 22 stormwater schemes is provided below in Table 3‑18.
Table 3‑18 Summary of Stormwater Schemes
| Arthurs Pass Stormwater Scheme | 136 | $332,902
| $57.11
|
| Castle Hill Stormwater Scheme | 189
| $774,656
| $65.88
|
| Claremont Stormwater Scheme | 58
| $111,617
| $5.61
|
| Darfield Stormwater Scheme | 1,106
| $610,296
| $16.95
|
| Doyleston Stormwater Scheme | 121
| $679,235
| $14.80
|
| Dunsandel Stormwater Scheme | 174
| $241,268
| $10.29
|
| Glentunnel Stormwater Scheme | 77
| $158,774
| $21.92
|
Hororata Stormwater Scheme
| 75
| $312,095
| $18.44
|
| Kirwee Stormwater Scheme | 370
| $171,976
| $8.03
|
| Lake Coleridge Stormwater Scheme | 69
| $113,799
| $13.79
|
| Leeston Stormwater Scheme | 929
| $6,692,351
| $19.23
|
| Lincoln Stormwater Scheme | 2,541
| $35,921,003
| $69.91
|
| Prebbleton Stormwater Scheme | 1,596
| $8,584,279
| $46.13
|
| Rakaia Huts Stormwater Scheme | 114
| $281,448
| $4.26
|
| Rolleston Stormwater Scheme | 6,438
| $5,890,885
| $31.20
|
| Southbridge Stormwater Scheme | 366
| $1,034,558
| $14.97
|
| Springfield Stormwater Scheme | 141
| $41,399
| $17.87
|
| Springston Stormwater Scheme | 195
| $935,688
| $26.72
|
| Tai Tapu Stormwater Scheme | 204
| $2,459,581
| $63.91
|
| West Melton Stormwater Scheme | 734
| $3,584,615
| $60.14
|
| Whitecliffs Stormwater Scheme | 91
| $80,781
| $3.58
|
3.3.2 Key Issues
The following key issues have been identified across the Councils stormwater schemes. Issues within each individual scheme is provided in Volume 4 of this AcMP. And issues common to one or more of the schemes are below in Table 3‑19.
Table 3‑19 District Wide Key Issues
| Schemes are becoming management Intensive | Due to system development/growth, environmental requirements and public expectations. |
| Long travel times | Are a significant issue for Council in the remote schemes. |
| Provision of water quality monitoring, treatment upgrades and the associated capital burden on applicable communities. | This is driven by the Land and Water Plan/Discharge Consents. |
| Increasing number of capacity upgrades | Capacity upgrades which result from increasing expectations from ratepayers signal that a higher LoS is provided. |
| Data accuracy | Continuous improvement of stormwater asset data records in terms of completeness and accuracy required. |
3.3.3 Operations and Maintenance
Council has two full-time surface water engineers, who focus on the operation and maintenance of stormwater, land drainage and water race schemes within the district. These staff members are supported by a projects engineer, SCADA engineer and two admin staff who work across the other 5Waters schemes.
Under contract
C1241 Water Services Network Management Contract scheduled and reactive maintenance work is undertaken on these supplies. This contract was approved by Council on the 22th June 2016 for a period of 1 July 2016 to 30 June 2021. Contract negotiations are underway for an extension to the contract. The new contract rates have been integrated into the budgets. Telemetry is relied upon to provide early flood warnings for Tai Tapu, Leeston and Doyleston.
3.3.4 Demand and Capacity
High growth in the urban areas of Rolleston, Lincoln, and Prebbleton is driving the need for the extension of the stormwater management areas and associated infrastructure.
Demand on the stormwater network is based on the conveyance of prescribed design rainfall events.
It is impractical to provide a primary stormwater system with the capacity to fully accommodate the runoff from all possible storms. The historic design standard for most of the primary Council stormwater system was to convey runoff resulting from a storm with a 2 - 5 year return period storm.
Rainfall totals for the 10 year 1 hour event is shown below for comparative purposes and illustrates the varying rainfall depths for this particular rainfall event over the district.
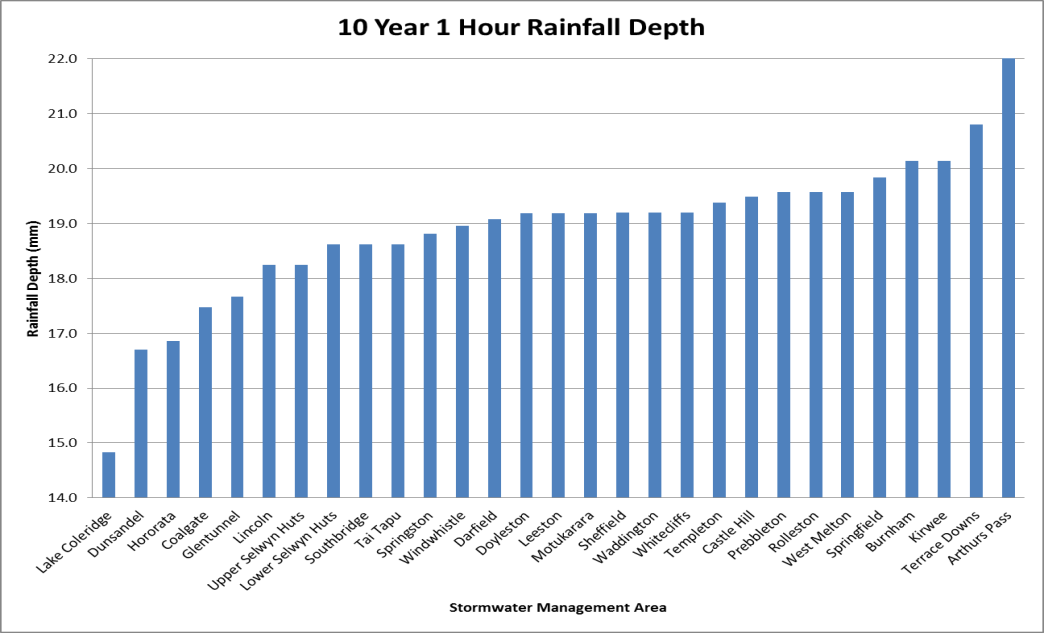
Figure 3‑16 Selwyn 10 year 1 hour rainfall depth
Modern subdivisions and stormwater renewals/upgrades are now designed for the 10 year return period. Current standards in Selwyn are designed for, primary a 1 in 10 year event and secondary for a 1 in 50 year event. It is inevitable that the parts of the piped system will be overloaded to varying degrees whenever rainfall with a return period in excess of the design storm occurs.
3.3.5 Water Quality
In terms of stormwater discharge there are two types of receiving environment and measured effects. These are:
- Discharge to ground (potentially affecting drinking water); and
- Discharge to surface water (potentially affecting aquatic life).
Council undertakes stormwater sampling to meet consent conditions. A summary of information collected from Rolleston (discharge to ground) and Lincoln (discharge to surface water) is provided below.
3.3.5.1 Discharge to Ground
Water quality samples are taken as part of the global stormwater consents for Selwyn townships. The receiving environment is sampled upstream and downstream of the discharge point. The results from July 2017 for the townships of Arthurs Pass and Hororata are presented below in Table 3‑20.
Table 3‑20 Stormwater Characterisation
| Total Suspended Solids | g/m3 | <3 | 645 |
| Nitrate – Nitrogen | g/m3 | 0.02 | 0.33 |
| Amomonia Nitrogen | g/m3 | <001 | 0.07 |
| Total Phosphorus | g/m3 | <0.005 | 1.31 |
| Dissolved Reactive Phosphorus | g/m3 | <0.005 | 0.113 |
| Total Nitrogen | g/m3 | <0.05 | 5.08 |
| Dissolved Copper | g/m3 | <0.0005 | 0.0014 |
| Dissolved Lead | g/m3 | <0.0005 | <0.0005 |
| Dissolved Zinc | g/m3 | <0.002 | <0.002 |
| pH | | 7.21 | 6.90 |
| Conductivity at 25 degress | uS/cm | 46 | 78 |
| Temperature | Deg C | 6.8 | 6.8 |
| Dissolve Oxygen | g O2/m3 | 10.7 | 10.6 |
3.3.5.2 Discharge to Surface Water
Water quality samples were taken from the L2 River immediately downstream of the Lincoln stormwater management area. The results are presented below and compared to the Australian water quality guidelines for fresh and marine (ANZECC) guidelines. Regular sampling is undertaken to meet consent conditions.
Table 3‑21 Stormwater Characterisation
| 6 March 2015 | 4
| <0.0005 | <0.0001 | 0.0011 |
| 10 June 2014 | 19 | 0.0013 | <0.0001 | 0.0092 |
| 8 April 2014 | 47 | 0.0016 | <0.0001 | 0.0085 |
| 6 January 2014 (dry) | 13 | 0.0005 | <0.0001 | 0.0011 |
| 4 September 2013 | 30 | 0.0012 | <0.0001 | 0.0054 |
| 6 May 2013 | 420 | 0.0019 | <0.0001 | 0.0029 |
| 18 March 2013 | 51 | 0.003 | 0.00023 | 0.0049 |
| Water Quality standard for 95% protection level | na | 0.0014
| 0.0034 | 0.008 |
The results were taken as part of the Lincoln Stormwater Monitoring Programme at site 6 below the Lincoln township.
The results in Table 3‑21 above show low dissolved metal concentration in the L2 River in both low and high flow conditions. The metal levels are below the 95% protection level (spring fed plains rivers NRRP WQL4 Table WQL17) in all but one high flow sample where copper levels were elevated. One high flow event in May 2013 resulted in high TSS results downstream of the township. This was associated with construction in adjacent subdivisions.
3.3.6 Stormwater Management
Stormwater management relates to the 'day to day' management of the quantity and quality of stormwater discharge. The management of stormwater needs to address quantity effects to control erosion and flooding, and quality effects as runoff is one of the principal mechanisms for transfer of road/traffic generated contaminants to the environment.
Integrated stormwater management plans are required for all townships under the Land and Water Regional Plan. The plans form part of the discharge consents required. Table 3‑22 below shows the townships for which this has been completed.
Table 3‑22 Stormwater Management Plans
Rolleston (CRC132527)
| Tai Tapu (CRC167468) |
Lincoln (CRC151652)
| Prebbleton (CRC167469) |
Claremont (CRC050844.1)
| Southbridge (CRC167470) |
Castle Hill (CRC064128.1)
| Hororata (CRC167471)
|
West Melton (CRC167467)
| Doyleston (CRC186171)
|
| Kirwee (CRC167466) | Dunsandel (CRC186172)
|
| Darfield (CRC167465) | Glentunnel (CRC186173)
|
| Rakaia Huts (CRC175956) | Lake Coleridge (CRC186174)
|
| Leeston (CRC186175)
|
| Springfield (CRC186176)
|
| Springston (CRC186177)
|
| Whitecliffs (CRC186178)
|
| Arthurs Pass (CRC186179)
|
3.3.7 Stormwater Assets
Council has a wide variety of stormwater assets within the district. A brief description of these assets is discussed here:
- Oil Interceptor – Is a proprietary device which uses baffles to trap and contain hydrocarbons (oils and fuels).
- Humeceptor - Is a hydrodynamic separator which helps to reduce mass sediment load from the discharge, some removal of hydrocarbons is also achieved.
- Swale (Rock lined) – Is a longitudinal open channel which is lined with rocks. The swale both conveys and treats stormwater.
- Swale (Grassed) – Is a longitudinal open channel which is lined with grass. The swale both conveys and treats stormwater.
- Swale (Wetland) – Is a longitudinal open channel which is lined with wetland plant species. The swale both conveys and treats stormwater and is particular useful in areas with high groundwater tables.
- Soakage trench – Carries out the same function as soakholes but is orientated in a horizontal direction rather than vertically. They are particularly useful in areas with reduced infiltration rates or higher ground water tables.
- Reticulated network – Includes pipes, manholes, sumps. The primary purpose of the reticulated network is to collect and convey stormwater. Historically these systems were designed for the 2 year storm event. Today's engineering standards require the piped network to be designed for a 10 year event with overland flow provision for up to the 50 year event.
- Corrugated Flume – is a corrugated half pipe used to convey stormwater in areas which are prone to erosion.
- Infiltration basin – is a stormwater management device which is used to store, treat and dispose of stormwater to the ground via soakage.
- Wetland - is a stormwater management device which is used to attenuate, treat and dispose of stormwater. Discharge from a wetland is to surface water (open drains or streams). Wetlands have high biodiversity value and are best suited in areas where the ground water table is high.
- Soakholes – Are used to dispose of stormwater to ground in areas where the ground water table is low and soil permeability is high.
- Open drains – are channels used to convey stormwater. They are cost effective means to convey large volumes of water.
- Flood diversion channel – is a large scale open drain designed to convey flood flows.
- Soakage Pit – these are historic gravel abstraction pits which are used to store and dispose of flood waters.
Details of the stormwater management devices utilised in each scheme are provided in Volume 4: Stormwater, at the scheme level.
3.3.8 Stormwater Reticulation
A summary of the material and diameter for the pipes within the reticulation as well as more information about the types of stormwater assets can be found in Section 7.0, Lifecycle Management.
3.3.9 Risk Assessment
A risk assessment has been undertaken for Stormwater schemes. The key output from the risk assessment is the identification of any extreme and high risks which need to be mitigated. In order to mitigate these risks, they have been included and budgeted for in the projects within the LTP. The list of business-wide risks is in Section 9.2 and scheme-wide risks are listed in 5Waters Activity Management Plan: Volume 4. Table 3‑23 below outlines the risk priority rating and
Table 3‑24 lists the scheme-wide risks.
Table 3‑23 Risk Priority Rating
| > 50 | Extreme | Awareness of the event to be reported to Council. Urgent action to eliminate / mitigate / manage the risk. Document risk and action in the AMP. |
| 35-50 | Very High | Risk to be eliminated / mitigated / managed through normal business planning processes with responsibility assigned. |
| 14-35 | High | Manage risk using routine procedures. |
| 3.5-14 | Moderate | Monitor the risk. |
| < 3.5 | Low
| Awareness of the event to be reported to Council. Immediate action required to eliminate / mitigate / manage the risk. Document risk and action in the AMP. |
Table 3‑24 Risks - Stormwater
| Increasing number of easements | Document easements | 2014
| 27
| 27
| 6
|
| Public health and safety risks, such as drowning | Review Health and safety risks | 2014 | 3.5
| 3.5
| 3.5
|
| Sediment from subdivisions | Sediment Control Rules | 2014 | 27
| 27 | 12 |
| Unable to predict heavy rainfall events | Develop a flood warning system | 2014 | 6 | 6
| 6 |
| Environmental contamination, urban stormwater containing heavy metal contaminants reaching downgradient water supplies, cultural impacts | Renewal of consents | 2014 | 45 | 45 | 10 |
| Flood identification | Scope out flood protection works | 2017 | | 20 | 2.1 |
| Stormwater management | Stormwater upgrades with consents | 2017 | | 6 | 2.1 |
3.3.10 Funding Program
Section 11.0 provides the financial summary and details the funding and expenditure across the 5Waters activities. An overall summary of the funding program for the Stormwater activity is outlined within this section.
The 10 Year financial programme for the 5Waters is divided into the following categories:
- Expenditure – Operations and Maintenance;
- Projects – either specific or jointly funded;
- Capital Projects - result in new assets; and
- Renewals - replacement of assets on a like for like basis within a 20 year horizon.
Table 3‑25 and Figure 3‑17 outline the budget for the stormwater activity for the next 10 years.
Table 3‑25 Stormwater Budget Summary
| Year 1 | $1,126,705
| $119,162
| $167,500
| $1,135,000
|
| Year 2 | $1,163,311
| $119,162
| $125,500
| $940,000
|
| Year 3 | $1,193,078
| $119,162 | $112,500
| $915,000
|
| Years 4 to 10 | $9,178,429
| $1,364,134
| $699,500
| $3,425,000
|
|
Total | $12,661,523
| $1,721,620
| $1,105,000
| $6,415,000
|
Figure 3‑17 Stormwater Financial Summary
3.3.10.1 Shared Projects
There are a number of shared projects for stormwater. Shared projects are projects across one activity which share the costs across all schemes as they all receive the benefit.
The list of scheme specific projects can be found in 5Waters Activity Management Plan: Stormwater.
Table 3‑26 List of Shared Projects
| Projects | 4400068 | AMS | $10,000 | $10,000 | $10,000 | $70,000 | 100% LoS |
| Projects | 4400074 | AMP Valuation
| $3,500
| $3,500
| $3,500
| $24,500 | 100% LoS |
| Projects | 4400081 | Planning and Policy
| $20,000
| $20,000 | $20,000 | $140,000 | 100% LoS |
| Projects | 4400085 | Education
| $2,000
| $2,000 | $2,000 | $14,000 | 100% LoS |
| Projects | 44000172
| SW Investigations
| $122,000
| $80,000
| $67,000
| $381,000
| 100% LoS |
| Capital Projects | 4400900171
| SW Capital Works
| $1,135,000
| $940,000
| $915,000
| $3,425,000
| 100% LoS |
| Projects | 44000171
| SW Management Systems
| $10,000
| $10,000
| $10,000
| $70,000
| 100% LoS |
* LoS refers to Level of Service; G refers to Growth
3.4 Land Drainage
The following section describes the Land Drainage activity. Further detail on the schemes is provided in Volume 5: Land Drainage.
3.4.1 Description of the Activity
Council manages 10 drainage schemes covering 20,732 hectares within the Selwyn District as shown below in Figure 3‑18. These schemes are in place to drain groundwater (primary function) from the land and stormwater (secondary function). One scheme is for specifically the purpose of flood protection, Bealey River stopbanks/flood water diversion, and one scheme is for erosion protection maintenance on a section of waterway on the Hororata River. The remaining schemes are primarily land drainage.
The land drainage schemes operated by Council are:
- Arthurs Pass Drainage District
- Hororata River Drainage District
- Osbornes Drainage District
- Ellesmere Drainage District
- Greenpark Drainage District
- Leeston Drainage District (including Leeston Township and Leeston Rural)
- LII Drainage District
- Taumutu Culverts
- Taumutu Drains
- Wairiri Valley
There is a high concentration of schemes around Te Waihora, reflecting ancient geophysical and geological events including the position of the Waimakariri River.
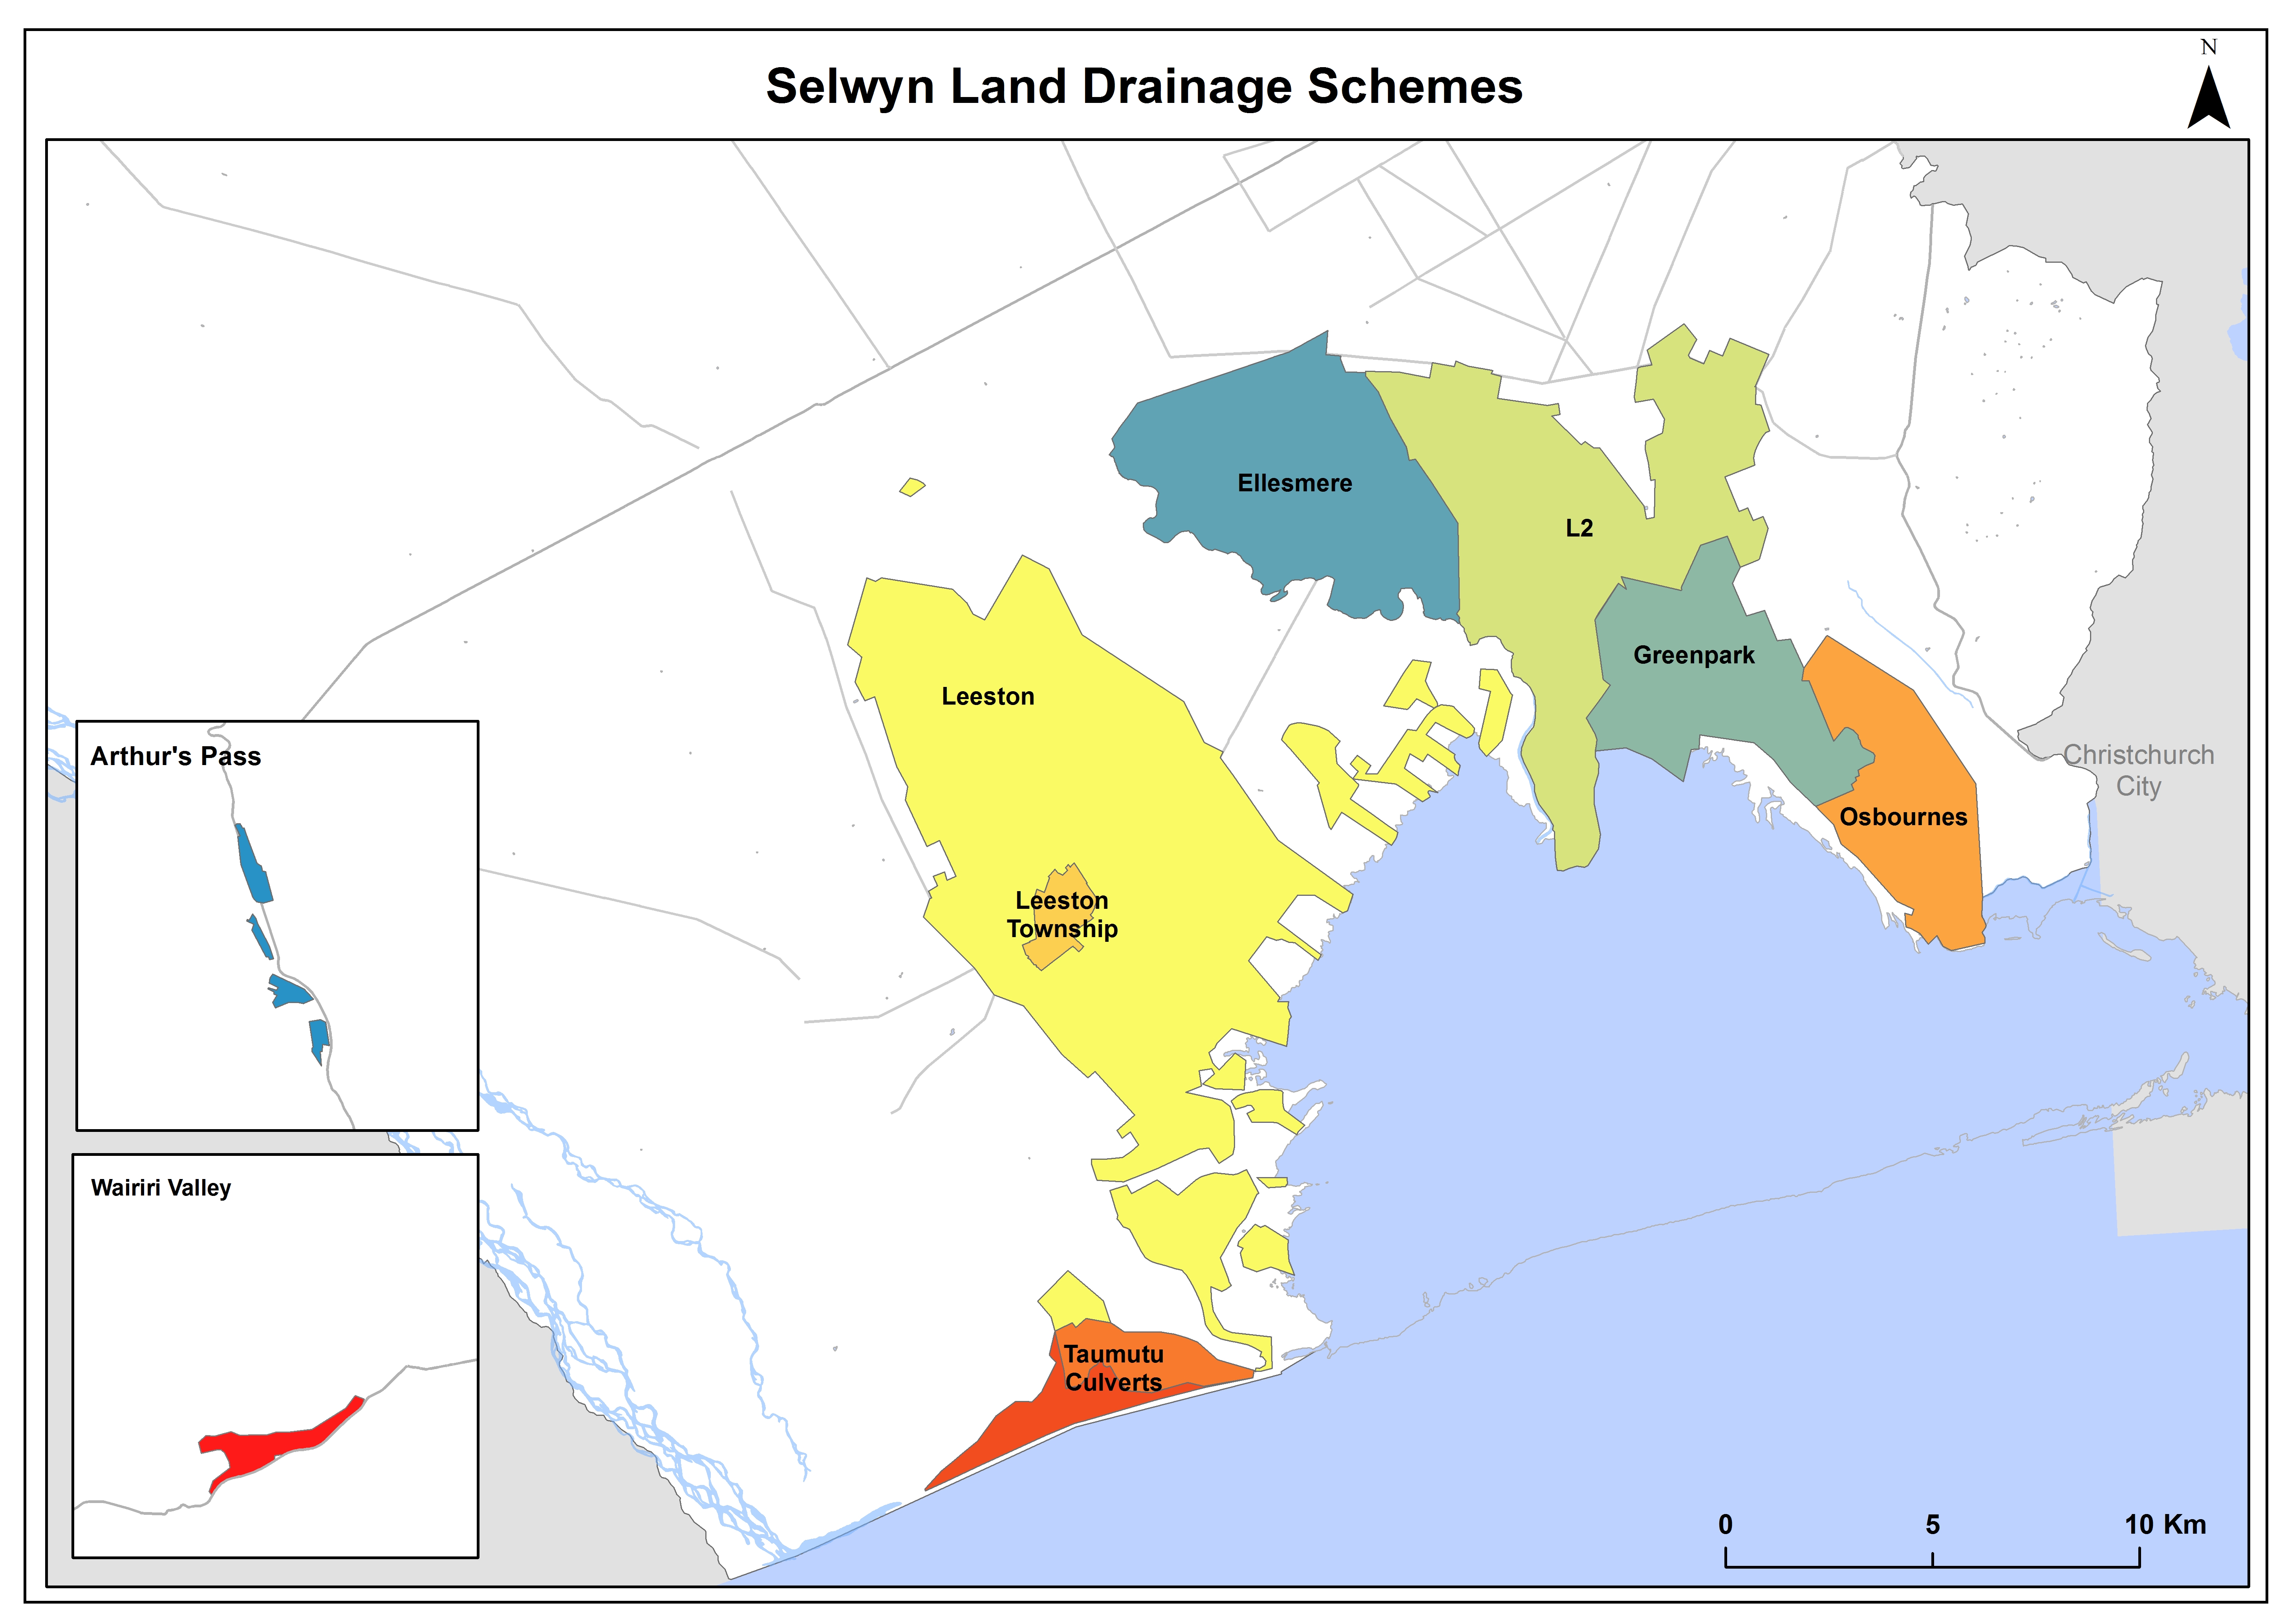
Figure 3‑18 Location of Land Drainage Schemes
3.4.1.1 Primary Purpose - Removal of Groundwater
The primary purpose of the land drainage network is to reduce groundwater levels, including natural spring water, and in doing so make land available for arable farming and dwelling. With the exception of the Osbornes area, these drains convey water by gravity flow, to Te Waihora / Lake Ellesmere. Use of productive land in the Osbornes drainage scheme is reliant on electrically driven pumps which lift water into Te Waihora / Lake Ellesmere.
Osbornes Drainage was developed from 1967 onwards and has been considered to be a model example of the economic and social benefits resulting from land drainage being provided in rural land.
3.4.1.2 Secondary Purpose – Stormwater Conveyance
The secondary benefit of the land drainage network is to minimise the effects of flooding due to stormwater runoff. This secondary benefit is a result of their construction but not the purpose for which they were built.
From the 1850's onwards settlers found the majority of the District's lowland areas covered in flax swamps and light tussocks in the higher areas. Drains were installed to bring the land into production, some by the Ellesmere Road Board, but most by settlers themselves. By the 1920's the drained country had become highly productive.
Prior to 2004, stormwater from townships was generally discharged directly to the drains, particularly Doyleston, Leeston, Lincoln, Southbridge, Springston, Prebbleton and Tai Tapu. Since 2004, new development land has been required to install stormwater systems that reduce or delay peak discharges, and manage the water quality by stormwater treatment. Council has also progressively taken over the development stormwater consents from new developments and has employed qualified staff to manage these 35 year consents.
A summary of the land drainage schemes is provided below in Table 3‑27.
Table 3‑27 Summary of Land Drainage Schemes
| Arthur's Pass Drainage Area | 15.44 ha | $64,675
| $3,000
|
| Ellesmere Drainage District | 1,265.59 ha
| $3,338,222
| $10,000
|
| Greenpark Drainage District | 2,243.87 ha | $1,947,075
| $3,670
|
| Hororata River Drainage Area | 761.91 ha
| -
| $4,500
|
| Leeston Urban and Rural Drainage District | 10,607.13 ha
| $22,312,345
| $83,619
|
| LII Drainage District | 4,755.06 ha
| $8,204,995
| $52,000
|
| Osborne Drainage District | 1,791.77 ha
| $2,537,453
| $5,000
|
| Taumutu Drainage District | 653.60 ha
| $2,076,480
| $12,070
|
| Taumutu Culverts | -
| $459,374
| $5,000
|
| Wairiri Valley Drainage Area | 377.46 ha
| $4,319,785
| $3,421
|
3.4.2 Key Issues
The following key issues have been identified across the Councils Land drainage schemes. Issues within each individual scheme is provided in Volume 5 of the AcMP. And issues common to one or more of the schemes is shown below in Table 3‑28.
Table 3‑28 District Wide Key Issues
Provision of water quality monitoring and management
| This is driven by the Land and Water Plan/Discharge Consents. |
| Capacity upgrades | Resulting from increasing expectations from ratepayers that a higher LoS will be provided. |
| Data accuracy | Continuous improvement of stormwater asset data records in terms of completeness and accuracy is required. |
| Management intensive | Due to environmental requirements and public expectations. |
| Scheme Condition | Require capital works upgrades, monitoring and reporting, and a higher level of resources input to operate the scheme in future. |
| Drain Monitoring | Regularly monitor to ensure appropriate standards are maintained to deliver the design flow. Critical drains are to be inspected at least once every year. Minor drains are to be inspected at least once every five years. |
3.4.3 Governance
Council delegates some aspects of management of the Land Drainage network to the Land Drainage Advisory committee and nine Land Drainage Committees, comprising of local residents with an interest in the Land Drainage network. Council Service Delivery Staff work alongside the Committee's to prioritise and facilitate maintenance activities which are undertaken by a number of local contractors around April/May each year. During the 2021 - 2031 LTP period, Council are underway with a review of the governance structure for Land Drainage.
3.4.4 Operation and Maintenance
Council has two full-time engineers, who focus on the operation and maintenance of stormwater, land drainage and water race schemes within the district. These staff members are supported by a SCADA engineer and two admin staff who work across the other 5Waters schemes.
Drain inspections are carried out by either the Drainage Committees or Council Staff. These inspections are in many cases carried out in conjunction with the formulation of the yearly cleaning programme. Selwyn District Council requires Drainage Committees and individual property owners to advise when maintenance is required outside of normal maintenance cycles, and such reporting is essential to updating the monitoring program.
Inspection and monitoring will be directed at identifying the following problems:
- Encroachment of weeds and other obstructions which may impair waterway performance;
- Bank erosion that may also threaten the waterway performance, resulting in loss of pasture and sedimentation of the drains;
- Accumulation of silt which may result in poor hydraulic performance; and
- Excessive bed degrading that may destabilise drain beds and banks.
3.4.5 Land Drainage Management
The Council is responsible for the operation and maintenance of the main drains (classified drains) with all other drains being the responsibility of the owner on whose property they are located. It is understood that there are approximately 3m of private drains for every 1m of classified drains.
Drains are generally cleaned of weed, vegetation and sediment with an excavator on a 1-5 year basis. On road sides, drain cleanings are left on the berm, or where necessary taken away by truck to clean fill sites.
The drainage systems require regular maintenance, for continued productive use of the associated arable land, dwellings and infrastructure. Council is required to continue maintenance of this significant activity. Council's forecasts increased costs to maintain the network, and is also expecting land development in urban areas to continue as predicted. There is no practical alternative and inevitably the water which is discharged may contain nutrients or other potential contaminants.
Weed cutting occurs by boat in the LII Drainage scheme
The method for cleaning has been historically based focused on ensuring hydraulic efficiency. It is now recognised that drains may be important habitats, and have multiple uses and values. Many landowners recognise the values of managed waterways and want to manage the environment responsibly.
Land drainage activity is expected to change which will be driven by management of the:
- Legislation, such as the RMA and Environment Canterbury Land and Water Regional Plan; and
- Trade implications including the potential for imposition of non-tariff trade barriers by competing countries that are already operating under stricter environmental regulatory controls than New Zealand.
3.4.6 Demand - Capacity
Demand on the land drainage schemes can be potentially affected by management of Te Waihora (Lake Ellesmere), increased groundwater levels, and urban development.
3.4.6.1 Management of Te Waihora/Lake Ellesmere
Lake levels directly affect the lower reaches of the land drainage network. Low lake levels aid drainage while high lake levels restrict drainage by causing back-water effects resulting in the flooding of low-lying land. The management of the lake is controlled under the Water Conservation Order and Environment Canterbury consent CRC042860.1 (CRC110972).
The land drainage schemes most prone to inundation due to high lake levels include:
- Ellesmere Drainage District;
- Greenpark Drainage District;
- L2 Drainage District;
- Leeston Drainage District; and
- Osbornes Drainage District.
3.4.6.2 Groundwater levels
Groundwater levels vary seasonally as a result of rainfall and snow melt. In addition to these natural influences ground water abstraction for irrigation is having a significant impact on ground water levels.
There is a belief amongst the community that the proposed Central Plains Irrigation scheme has the potential to elevate groundwater levels which could potentially add stress to the land drainage network. Central Plains Water are required, under their consents, to monitor the Council network.
3.4.6.3 Urban Development
The expansion of urban development will increase the reliance on the land drainage schemes to maintain a lowered groundwater level and increase the importance of the system's secondary purpose – stormwater conveyance.
3.4.7 Water Quality
In terms of Land drainage discharge there are two types of receiving environments. These are:
- Discharge to Lake Ellesmere / Te Waihora, and
- Discharge to river / waterway.
Selwyn District Council is building up a database of water quality information. Results and sampling locations for the majority of the sites is provided below.
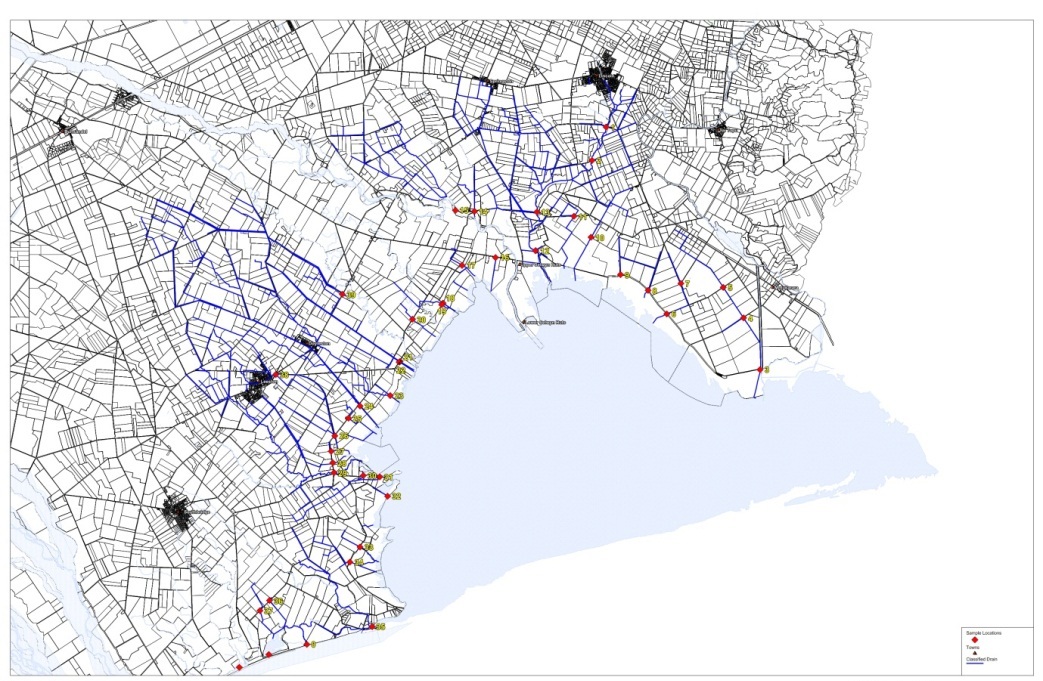
Figure 3‑19 Location of Land Drainage Water Quality Sample Locations
As an indication of water quality the table below shows a summary of Environment Canterbury's records for 6 of the land drainage discharges into the Te Waihora/Lake Ellesmere. All values are averages.
Table 3‑29 Water Quality Results (Average Values)
LII Stm @ Pannetts Rd bridge Site No:SQ30878
| 9.4 | 12.6
| 7.5
| 24
| 3.6 | 0.049 | 4.8 |
Irwell R at Lake Rd Site No:SQ30963 | 8.2
| 11.9 | 7.4 | 33 | 1.5 | 0.121 | 5.5 |
Hanmer Rd Drain at Lake Rd Site No:SQ30975 | 11.4 | 11.3 | 7.9 | 36 | 3.0 | 0.082 | 7.4 |
Boggy Creek at Lake Rd Site No:SQ30976 | 10.7 | 12.3 | 7.8 | 34 | 5.9 | 0.075 | 8.8 |
Doyleston Drain at Lake Rd Site No:SQ30977 | 10.6 | 11.9 | 7.6 | 34 | 3.8 | 0.085 | 5.4 |
Harts Creek at Lower Lake Rd Site No:SQ30992 | 9.6 | 11.5 | 7.5 | 22 | 4.9 | 0.037 | 6.8 |
3.4.8 Pump Stations
There is one land drainage pump station in the Osbornes Drain Land Drainage Scheme. The pumping hours vary substantially through the year. A new switchboard was installed in 2013 enabling the pump station to be connected to SCADA. Text alerts are received by the land drainage committee which is comprised of landowners in the area. Several of these committee members monitor the increases in drain water levels that could indicate pump failure/power outages etc.
3.4.9 Land Drainage Reticulation
A summary of the material and diameter for the pipes within the reticulation as well as more information about the types of assets for land drainage can be found in Section 7.0, Lifecycle Management.
3.4.10 Risk Assessment
A risk assessment has been undertaken for Land Drainage schemes. The key output from the risk assessment is the identification of any extreme and high risks which need to be mitigated. In order to mitigate these risks they have been included and budgeted for in the projects within the LTP. The list of business-wide risks is in Section 9.2 and scheme-wide risks are listed in 5Waters Activity Management Plan: Volume 5. Table 3‑30 below outlines the risk priority rating and Table 3‑31 lists the scheme-wide risks.
Table 3‑30 Risk Priority Rating
| > 50 | Extreme | Awareness of the event to be reported to Council. Urgent action to eliminate / mitigate / manage the risk. Document risk and action in the AMP. |
| 35-50 | Very High | Risk to be eliminated / mitigated / managed through normal business planning processes with responsibility assigned. |
| 14-35 | High | Manage risk using routine procedures. |
| 3.5-14 | Moderate | Monitor the risk. |
| < 3.5 | Low | Awareness of the event to be reported to Council. Immediate action required to eliminate / mitigate / manage the risk. Document risk and action in the AMP. |
Table 3‑31 Risks – Land Drainage
Committees issue work on behalf of council
| Develop procurement policy for Land Drainage committees
| 2014 | 12
| 4
| 4
|
| Committees run land drainage scheme - interest may wane, appropriateness | Review land drainage governance structure | 2014 | 12 | 4 | 4 |
| CPW may impact ground water levels and function of drains | Investigate CPW impact on groundwater levels | 2014 | 10 | 10 | 10 |
| Environmental impact of poor drain maintenance practices | Develop a drain cleaning protocol | 2014 | 27 | 12 | 12 |
| Inaccurate asset data | Improve asset data quality | 2014 | 12 | 4 | 4 |
| Increased cost monitoring and compliance of consents | Global consent for land drainage activities | 2014 | 27 | 27 | 27 |
| No process for converting private to classified drains | Write a protocol around adding and subtracting classified drains | 2014 | 9 | 4 | 4 |
| Non optimised drain cleaning practices result in poor and expensive operations, loss of key committee members may also result in loss of knowledge | Maintenance schedules required for all scheme | 2014 | 27 | 9 | 9 |
| Discharge exceeds WQ guidelines without Council being aware, potential compliance issues with E | Can
| ng
| 2014
| 27
| 12
| 12
|
| Inadequate legal protection / enforcement powers | Develop bylaw | 2017 | -
| 4 | 2 |
3.4.11 Funding Program
Section 11.0 provides the financial summary and details the funding and expenditure across the 5Waters activities. An overall summary of the funding program for the Land Drainage activity is outlined within this section.
The 10 Year financial programme for the 5Waters is divided into the following categories:
- Expenditure – Operations and Maintenance;
- Projects – either specific or jointly funded;
- Capital Projects - result in new assets; and
- Renewals - replacement of assets on a like for like basis within a 20 year horizon.
Table 3‑32 and Figure 3‑20 outline the budget for the water race activity for the next 10 years.
Table 3‑32 Land Drainage Budget Summary
| Year 1 | $252,377
| $5,000
| $197,100
| -
|
| Year 2 | $252,696
| $5,000
| $101,248
| -
|
| Year 3 | $252,377
| $35,000
| $278,372
| -
|
| Years 4 to 10 | $1,750,642
| $145,000
| $541,001
| -
|
|
Total | $2,508,093
| $190,000
| $1,117,721
| -
|
Figure 3‑20 Land Drainage Financial Summary
3.4.11.1 Shared Projects
There are a number of shared projects for Land Drainage. Shared projects are projects across one activity that share the costs across all schemes as they all receive the benefit.
The list of scheme-specific projects can be found in 5Waters Activity Management Plan: Land Drainage.
Table 3‑33 Key Projects
Projects
| 4500068
| AMS
| $2,000
| $2,000
| $2,000
| $14,000
| 100% L |
| o |
S
|
| e | c | t | s
| 34
| Water Quality Monitoring P | r | o | g | r | amme
| 00
| $20,854
| $21,272
| $161,301
|
LoS
|
Projects
| 4500069
| AMP V | aluation
| 00
| $700
| $700
| $4,900
|
| % |
LoS
|
s
| 4500075
| Global consent
| ,0 | 00
| 54
| $20,000
| -
| 100% LoS
|
cts
| 8
| Planning and policy
| 00
| $4,171
| $4,000 | $28,00 | 0
| S
|
Projects
| 4500082
| Education
| $400
| $400 | $400
| $2,800
| 100% LoS
|
Projects
| 4500084
| Ecological enhancement
| $30,000
| $30,000
| $30,000
| $210,000
| 100% LoS
|
* LoS refers to Level of Service; G refers to
G
owth
s
3.5.1 Description of the Activity
There are presently three water race schemes within the district: Ellesmere, Malvern and Paparua; these generally service the plains areas of the old County Councils (pre 1989 amalgamation). The Selwyn scheme with its intake on the Selwyn River was closed in 2009. Figure 3‑21 indicates the extent of the main water races and the locations of the intakes.

Figure 3‑21 Location of Water Race Schemes
A summary of the 3 water race schemes is provided below in Table 3‑34.
Table 3‑34 Summary of Water Race Schemes
| Ellesmere Water Race Scheme | 50,158 ha | $18,499,046
| $478,743
| 62.6 million m3 |
| Malvern Water Race Scheme | 61,684 ha
| $75,578,521
| $765,780
| 36.2 million m3 |
| Paparua Water Race Scheme | 35,837 ha
| $23,140,131
| $876,741
| 41.3 million m3 |
3.5.2 Key Issues
Table 3‑35 outlines key issues common to one or more of the Councils water race schemes. Issues within each individual scheme is provided in Volume 6 of the AcMP.
Table 3‑35 District Wide Key Issues
New Resource Consents
| The major implication of these consent conditions accepted by Council are: - Fish screen installation at all intakes;
- Assessment of water race flora and fauna, with protection if appropriate;
- Rationalisation of the race network to ensure efficiency of its primary use – stockwater;
- Assessment and reporting of alternative supply options
-
Assessment and reporting of alternative supply options; and
.
There is a significant cost to install and maintain these fish screens as they tend to be located in the river flood zones and can be subject to a high level of vandalism. |
Tradeoff between uses
| Tension between increasing efficiency, use and maintaining environmental instream and ameni |
| eds. |
| ns | Meeting the costs of installing fish screens while a number of rated users are requesting the removal of the water race channels. Currently users pay for it with an alternative rating structure proposed.
|
Water Quality
| Monitoring and improving water quality in the water race. This includes didymo, and aims to reduce the impact of downstream (Te Waihora) contamination.
|
3.5.3 Operations and Maintenance
Council has two full-time surface water engineers, who focus on the operation and maintenance of stormwater, land drainage, and water race schemes within the district. These staff members are supported by a projects engineer, SCADA engineer and two admin staff who work across the other 5Waters schemes.
Under contract
C1241 Water Services Network Management Contract scheduled and reactive maintenance work is undertaken on these supplies. This contract was approved by Council on the 22th June 2016 for a period of 1 July 2016 to 30 June 2021. Contract negotiations are underway for renewal of the contract. The new contract rates have been integrated into the budgets.
Telemetry is relied upon to provide data regarding intake flows at each of the headworks.
3.5.4 Water Race Management
The efficient movement of water in the race system requires an effective programme for control of aquatic/race bank weeds and silt removal. Aquatic weeds and silt build up contribute to inefficient water use by restricting water movement in races thereby increasing water losses through evaporation, seepage, by clogging flumes and siphons. However, stronger attention needs to be given to vegetation management, which includes balancing beneficial aspects of race vegetation (i.e. minimise bank erosion, enhancing amenity and providing habitat for fish /invertebrate and wildlife) with potential negative effects discussed above.
To ensure Water Races are maintained to an appropriate level the Council will continue to:
- Use race cleaning equipment and methods to minimise the effects of race cleaning on fisheries and aquatic habita
- ts;
- Use contractors that have staff with proven skills and experience or can demonstrate that they have the skills and suitable machinery for race cleaning to ensure the minimum effect on waterways;
- Develop and improve race cleaning methods /approaches in consultation with stakeh
- olders;
- d
- Refine protocols and procedures for race cleaning.
Some vegetation growth (e.g. perennial grasses) is desirable on race banks above the waterline to minimise the establishment of land weeds, preventing race bank wind and water erosion. Council carries out significant quantities of spraying to remove noxious weeds adjacent to Council races.
o:
- Investigate opportunities for enhancing race planting of appropriate species;
- Promote awareness of race planting to private property owners;
- and
- Continue consultation with stakeholders on race weed spraying activities.
Council will continue to develop a Weed Spraying Contract to improve environmental performance of weed spraying activities that includes “Best Practice" weed spraying protocols.
3.5.6 Water Race Intakes
Stock water intakes require part of the river to be directed toward intake structures to provide sufficient head for water abstraction. This is achieved by pushing up stones in the river bed as per consent for those activities which drafts water towards the intake gates.
3.5.7 Water Race Reticulation
A summary of the material and diameter for the pipes within the reticulation as well as more information about the types of assets for water races can be found in Section 7.0, Lifecycle Management.
3.5.8 Risk Assessment
A risk assessment has been undertaken for Water Race schemes. The key output from the risk assessment is the identification of any extreme and high risks which need to be mitigated. In order to mitigate these risks they have been included and budgeted for in the projects within the LTP. The list of business wide risks is in Section 9.2 and scheme wide risks are listed in 5Waters Activity Management Plan: Volume 6. Table 3‑36 below outlines the risk priority rating and Table 3‑37 lists the scheme wide risks.
Table 3‑36 Risk Priority Rating
| > 50 | Extreme
| Awareness of the event to be reported to Council. Urgent action to eliminate / mitigate / manage the risk. Document risk and action in the AMP. |
| 35-50 | Very High | Risk to be eliminated / mitigated / managed through normal business planning processes with responsibility assigned. |
| 14-35 | High | Manage risk using routine procedures. |
| 3.5-14 | Moderate | Monitor the risk. |
| < 3.5 | Low | Awareness of the event to be reported to Council. Immediate action required to eliminate / mitigate / manage the risk. Document risk and action in the AMP. |
Table 3‑37 Risks – Water Races
| Consent non-compliance | Consent compliance report and review of processes | 2014 | 27 | 27 | 12 |
| Increasing impacts for closure, impacts water/cost viability. No protocol for closure | Develop a protocol for closure | 2014 | 12 | 12 | 2 |
| Loss of knowledge (Sicon) | Maintenance Manual Update | 2014 | 12 | 12 | 4 |
| Poor asset data | Collect asset data | 2014 | 12 | 2 | 4 |
| H&S Risks | Manage risks | 2017 | | 40 | 10 |
3.5.9 Funding Program
Section 11.0 provides the financial summary and details the funding and expenditure across the 5Waters activities. An overall summary of the funding program for the Water race activity is outlined within this sectio
n.
The 10 Year financial programme for the 5Waters is divided into the following categories:
- Expenditure – Operations and Maintenance;
- Projects – either specific or jointly funded;
- Capital Projects - result in new assets; and
- Renewals - replacement of assets on a like for like basis.
Figure 3‑22 and Table 3‑38 outline the budget for the water race activity for the next 10 years.
Table 3‑38 Water Race Budget Summary
| 1 | $2,435,886
| $636,355
| 100
| $250,000
|
| Year 2 | $2,446,057
| $636,355
| $80,394
| $300,000
|
| Year 3 | $2,437,036
| $636,355
| $75,500
| $210,000
|
| Years 4 to 10 | $16,913,481
| $4,454,485
| $438,50 | 0
| $1,150,000
|
|
Total | $24,232,460
| $6,363,550
| $725,000
|
Figure 3‑22 Water Race Financial Summary
3.5.9.1 Shared Projects
There are a number of shared projects for Water Races. Shared projects are projects across one activity which share the costs across all schemes as they all receive the benefit.
The list of scheme specific projects can be found in 5Waters Activity Management Plan: Water Races.
Table 3‑39 Key Projects
cts
| 3900077
| AMS
| $10,000
| $10,000
| $10,000
| $70,000
|
100% LoS
|
cts
| 39 | 00079 | AMP Valuation
| $3,500
| $3,500 | $3,500 | $24,500 | 100% LoS |
Projects
| 3900087
| Planning and Policy
| $20,000 | $20,000
| $20,000
| $140,000
| 100% LoS
|
| Projects | 3900091
| Education
| $2,000
| $2,000
| $2,000
| $14,000 | 100% LoS |
| Projects | 46000172
| Water Race Investigations
| $70,000
| $50,000 | $30,000
| 0 | 100% LoS |
| Projects | 3900900171
| s
| 0
| $300,000
| $210,000 | $1,150,000
| 100% LoS |
| Projects | 39000171
| Water Race Management Systems
| $10,000
| $10,000 | $10,000 | $35,000
|
* LoS refers to Level of Service; G refers to Gr
owth
3.6 Improvement Planning
There are no improvement items listed for this section of the AcMP.
<<
5 Waters - Summary


